Choosing a way to display data
Choosing a way to display data
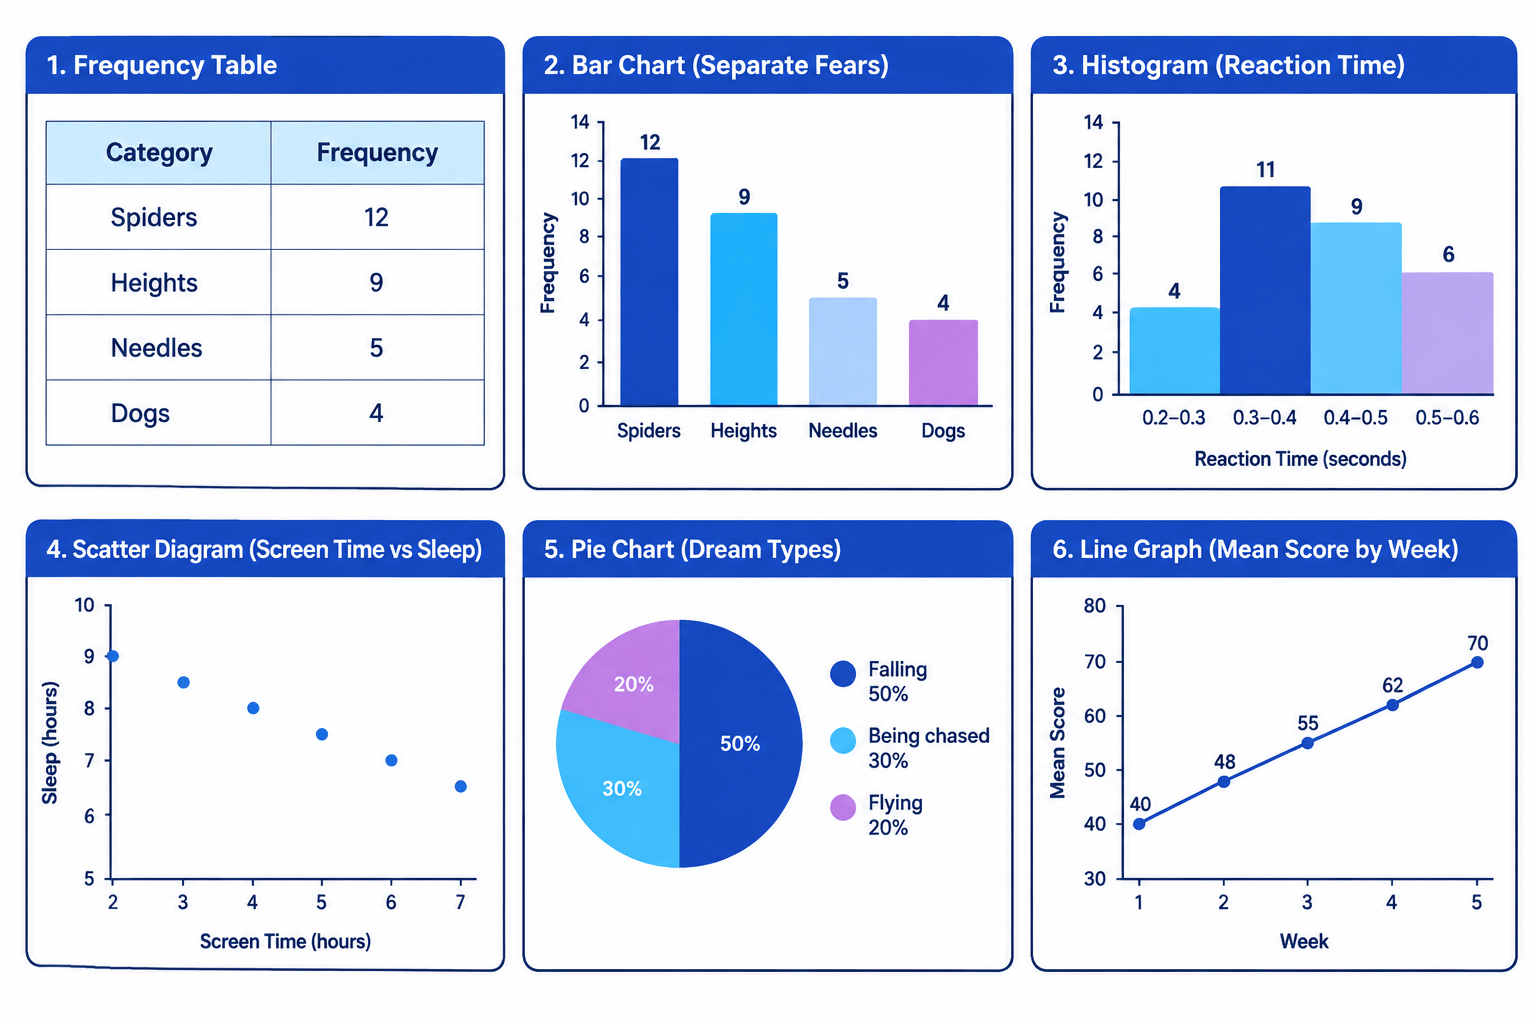
A frequency table records how often each value or category appears. It changes a long list of raw data into a short summary that can be read quickly.
7.3.4 Tables, Charts and Graphs Lesson
Step-by-step lessons on OCR GCSE Psychology 7.3.4 Tables, Charts and Graphs. Each one builds up to exam-style questions. Start with the more concrete topics like memory and development before tackling evaluation-heavy topics like psychological problems and criminal psychology.