Definition
Velocity-time graph
A velocity-time graph shows how an object's velocity changes with time.
Definition
Uniform acceleration
Uniform acceleration is acceleration that remains constant.
- Velocity is plotted on the vertical axis and time on the horizontal axis. Values below the time axis represent motion in the chosen negative direction.
- A horizontal line represents constant velocity and zero acceleration.
- A straight sloping line represents uniform acceleration.
- A curve represents changing acceleration because its gradient changes.
- Crossing the time axis means the velocity is zero at that instant. If the graph continues across the axis, the object reverses direction.
Gradient gives acceleration
- The gradient of a velocity–time graph is
- gradient=ΔvΔt=a\text{gradient}=\frac{\Delta v}{\Delta t}=agradient=ΔtΔv=a
- A positive gradient gives acceleration in the positive direction and a negative gradient gives acceleration in the negative direction.
- To calculate uniform acceleration, choose two points far apart on the straight section and use
- a=v2−v1t2−t1a=\frac{v_2-v_1}{t_2-t_1}a=t2−t1v2−v1
Example
- Velocity rises uniformly from 4.0 m/s4.0\ \text{m/s}4.0 m/s at 2.0 s2.0\ \text{s}2.0 s to 16 m/s16\ \text{m/s}16 m/s at 8.0 s8.0\ \text{s}8.0 s.
- The velocity change is 16−4.0=12 m/s16-4.0=12\ \text{m/s}16−4.0=12 m/s.
- The time change is 8.0−2.0=6.0 s8.0-2.0=6.0\ \text{s}8.0−2.0=6.0 s.
- The acceleration is 126.0=2.0 m/s2\dfrac{12}{6.0}=2.0\ \text{m/s}^26.012=2.0 m/s2.
Area gives displacement
Definition
Displacement from a velocity-time graph
Displacement is the signed area between a velocity-time graph and the time axis.
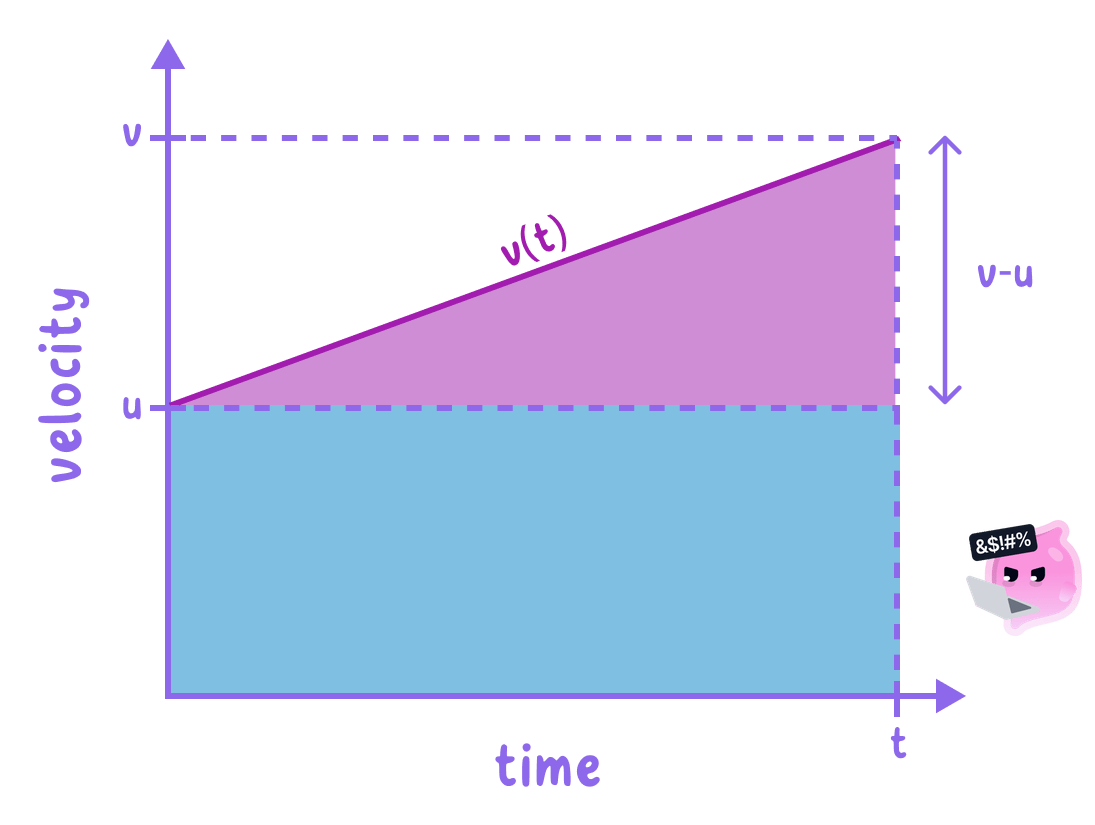
- For uniform acceleration, split the region into rectangles and triangles, then calculate each area.
- For a rectangle, A=bhA=bhA=bh. For a triangle, A=12bhA=\dfrac{1}{2}bhA=21bh. Time provides the base and velocity provides the height, so the area unit is s×m/s=m\text{s}\times\text{m/s}=\text{m}s×m/s=m.
- Area above the time axis is positive displacement. Area below the axis is negative displacement.
- Total displacement is the signed sum of all areas. Total distance is the sum of the magnitudes of the separate areas.
Example
- A car accelerates uniformly from 5.0 m/s5.0\ \text{m/s}5.0 m/s to 15 m/s15\ \text{m/s}15 m/s in 4.0 s4.0\ \text{s}4.0 s.
- The area is a rectangle plus a triangle: x=(5.0)(4.0)+12(4.0)(15−5.0)x=(5.0)(4.0)+\dfrac{1}{2}(4.0)(15-5.0)x=(5.0)(4.0)+21(4.0)(15−5.0).
- The displacement is 20+20=40 m20+20=40\ \text{m}20+20=40 m.
Describing motion from the graph
- State the velocity at the start of each section, whether it is constant or changing, and the direction of motion.
- Use the sign and gradient separately. The sign of velocity gives the direction of motion, while the sign of the gradient gives the direction of acceleration.
- An upward-sloping line below the axis can represent an object slowing down while travelling in the negative direction because its velocity moves towards zero.
- A downward-sloping line below the axis can represent speeding up in the negative direction because the magnitude of velocity increases.
Common Mistake
- Do not call every negative gradient deceleration. Compare the signs of velocity and acceleration.
- Do not use the line length as distance. Calculate the area between the graph and the time axis.
- Do not add areas below the axis as positive when finding displacement. Use signed areas.
Exam technique
- For a comparison of accelerations, compare gradients and state which line is steeper.
- For displacement, label the geometric shapes, show every area calculation and combine them with the correct signs.
- When a graph crosses the axis, state that the object is momentarily at rest and then changes direction.
Self review
- What does the gradient of a velocity–time graph represent?
- What does the area between the line and time axis represent?
- How is total distance found when part of the graph lies below the axis?
- What happens when a velocity–time graph crosses the time axis?
