2 Motion and forces
123456789101112131415161718192021222324252627282930313233343536373839404142434445464748495051525354555657585960616263646566676869707172737475767778798081828384858687888990919293949596979899100101102103104105106107108109110111112113114115116117118119120121122123124125126127128129130131132133134135136137138139140141142143144145146147148149150151152153154155156157158159160161162163164165166167168169170
Question 75
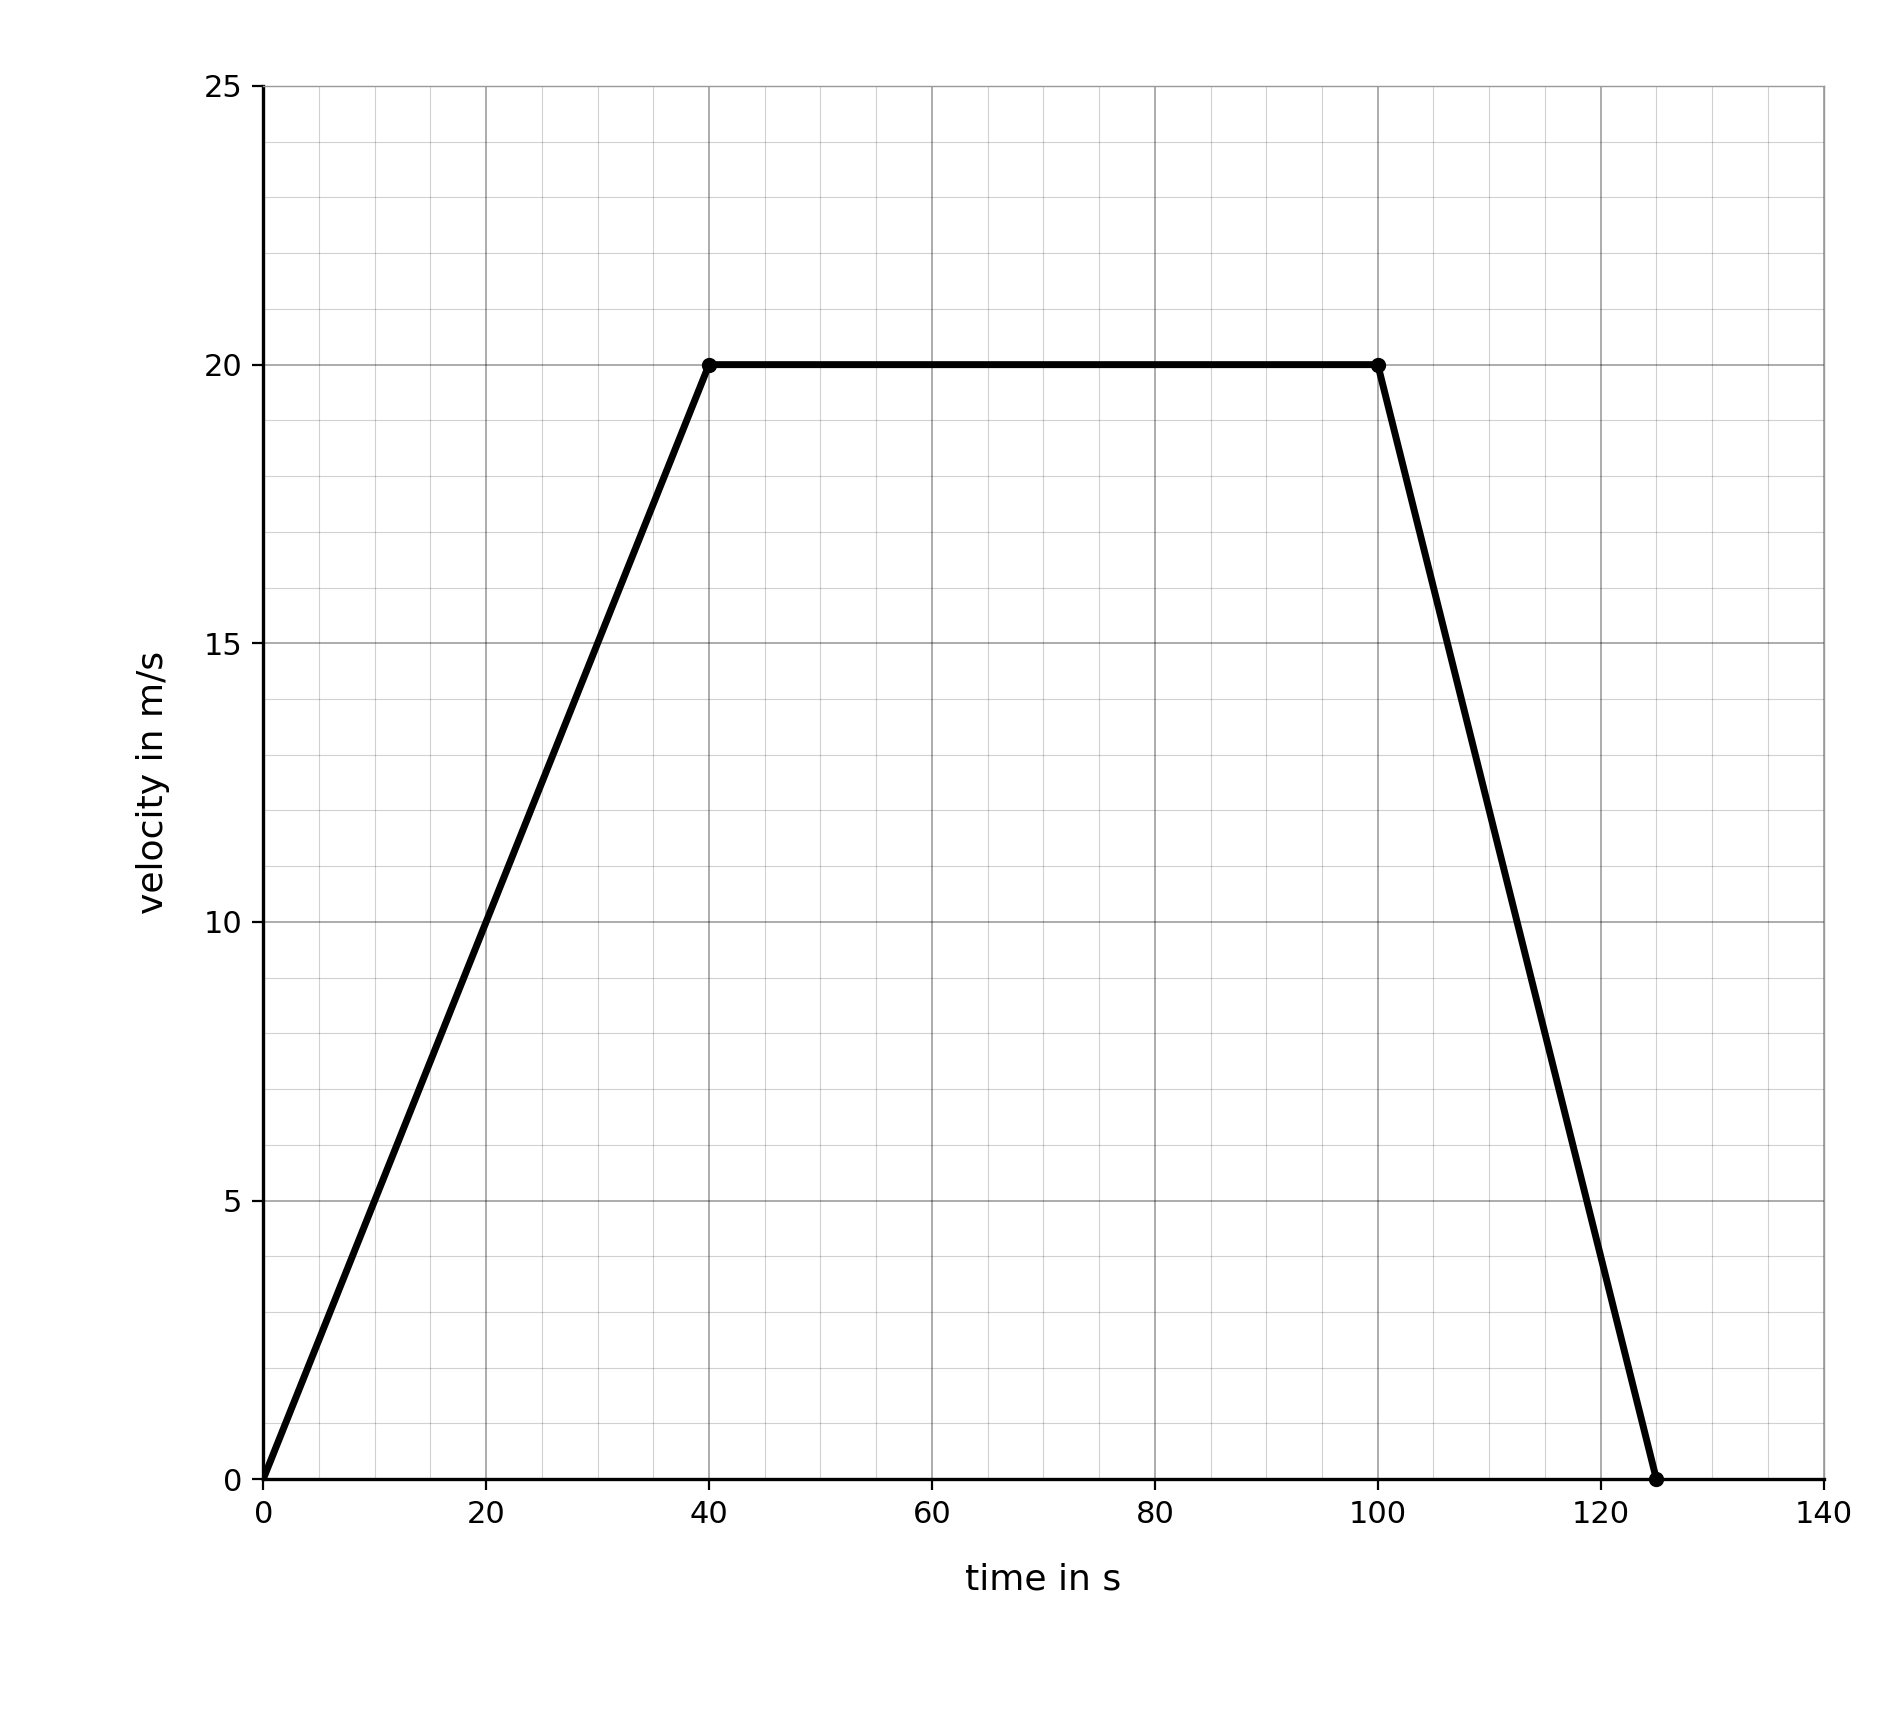
FA train travels between two stations along a straight track.
The Figure shows the velocity/time graph for the journey.
Figure
a.[1]
Describe the motion of the train between 40 s and 100 s.
b.[2]
Calculate the acceleration of the train in the first 40 s.
c.[2]
Explain how the graph shows that the deceleration of the train between 100 s and 125 s is greater than its acceleration in the first 40 s.
d.[2]
Determine the distance travelled by the train between 40 s and 100 s.
e.[3]
Determine the total distance travelled by the train between the two stations.