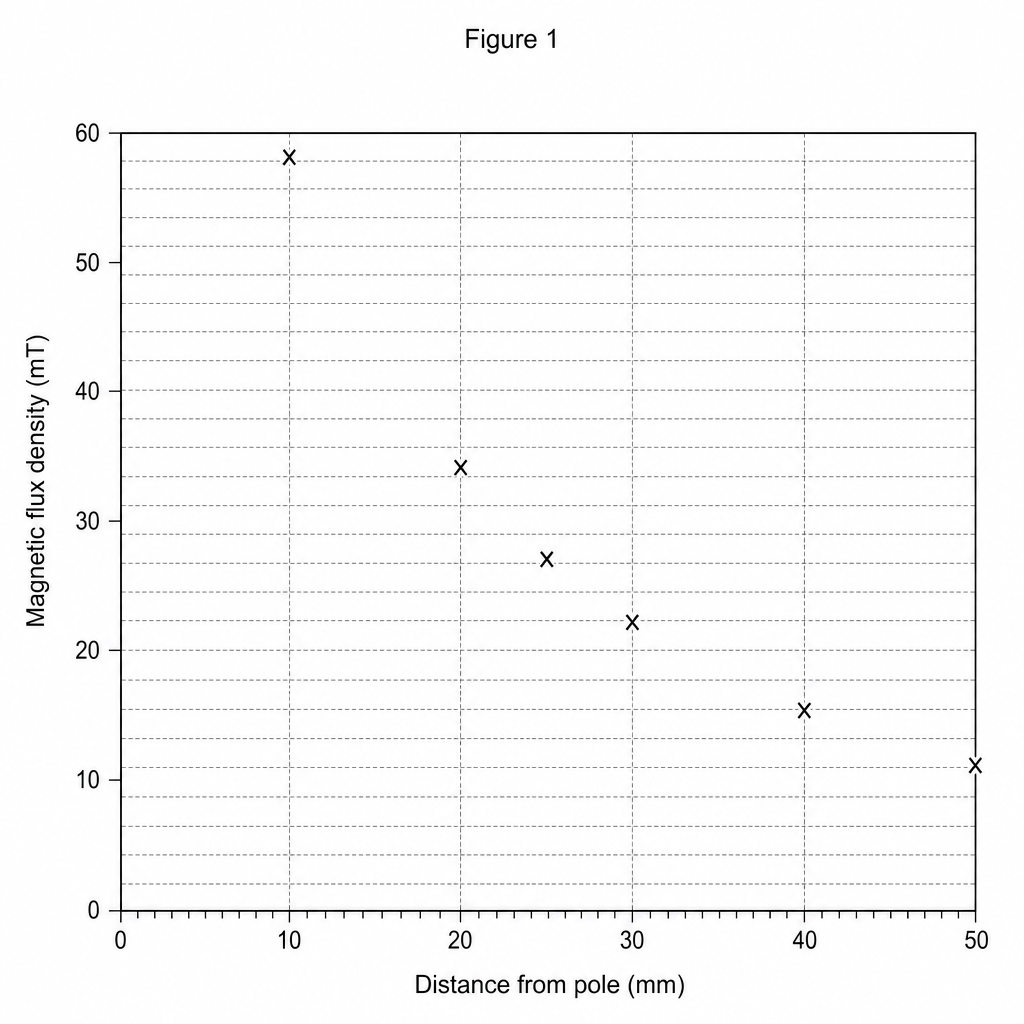
A student investigates how the magnetic flux density of a bar magnet varies with distance from its north pole.
The grid in Figure 1 shows most of the student's results plotted.
The table in Figure 2 shows two additional sets of results.
Figure 2
| Distance from pole (mm) | Magnetic flux density (mT) |
|---|---|
| 15 | 44 |
| 35 | 18 |
Plot the two extra data points from Figure 2 onto the graph in Figure 1.
Magnets and magnetic fields Questions
Practise Edexcel GCSE Physics Magnets and magnetic fields with exam-style questions for Foundation and Higher tier. 100 questions, matched to the Edexcel GCSE Physics (1PH0) specification and written in Paper 1 and Paper 2 style. Every question includes a full worked solution and mark scheme, so you can see where marks are awarded rather than just whether you got the answer right.