6.4.1 Activity and its decrease over time
Activity and its unit
Activity
The activity of a radioactive source is the number of nuclei that decay each second.
Becquerel
The becquerel is the unit of activity, equal to one nuclear decay per second.
Undecayed nuclei
Undecayed nuclei are the nuclei in a sample that have not yet decayed at a given moment.
- A radioactive sample contains an enormous number of unstable nuclei, and each one will decay at some point, but they do not all decay together.
- Activity counts how fast the sample as a whole is decaying, measured as the number of nuclei that break down each second.
- The unit of activity is the becquerel, symbol Bq\text{Bq}Bq, and 1 Bq1\ \text{Bq}1 Bq means exactly one decay per second.
- Because one decay per second is a tiny rate, real sources are quoted in kilobecquerels or megabecquerels, where 1 kBq=1000 Bq1\ \text{kBq} = 1000\ \text{Bq}1 kBq=1000 Bq and 1 MBq=1 000 000 Bq1\ \text{MBq} = 1\,000\,000\ \text{Bq}1 MBq=1000000 Bq.
- Activity depends on two things: how many undecayed nuclei are still present, and how likely each of those nuclei is to decay in the next second.
- The second of those is fixed for a given isotope and cannot be altered, so heating a source, dissolving it or grinding it up has no effect on its activity.
- The first can only fall, because every decay permanently removes one undecayed nucleus from the sample.
- Activity is a rate, not an amount, so a source with a high activity is not necessarily one that contains a lot of material; it may simply be decaying quickly.
Why activity falls over time
- At the start there is a large stock of undecayed nuclei, so a large number of them happen to decay each second and the activity is high.
- Every one of those decays converts an unstable nucleus into a different nucleus, so the stock of undecayed nuclei is smaller a second later.
- With fewer nuclei available to decay, fewer of them decay in the next second, so the activity is lower.
- That lower activity in turn removes nuclei more slowly, so the fall in activity itself becomes gentler as time goes on.
- The result is a curve that starts steep and flattens out, always heading towards zero but never quite reaching it, which is described as exponential decay.
- A useful way to state the mechanism is that the activity at any moment is proportional to the number of undecayed nuclei remaining, so as one falls the other falls with it.
- The fall is not perfectly smooth from one reading to the next, so a run of measurements has to be repeated and averaged before the trend can be trusted.
Measuring activity in the laboratory
Count rate
The count rate is the number of decays detected each second by a radiation detector.
- A Geiger-Muller tube connected to a counter is the instrument used to follow how a source is decaying.
- What the counter records is a count rate, in counts per second, and this is not the same as the activity of the source.
- The count rate is always lower than the activity, for three reasons.
- Radiation is emitted in all directions, so only the fraction aimed at the tube can be detected.
- Some radiation is absorbed by the air and by the window of the tube before it can be registered.
- The tube does not respond to every particle that enters it, and it detects alpha radiation very poorly compared with beta and gamma.
- The count rate is still a valid measure of how the activity is changing, because the fraction detected stays roughly constant if the detector and the source are not moved.
- Every reading also includes background radiation, which is present in the room whether or not the source is there.
- Background must therefore be measured with the source removed and subtracted from every reading, giving a corrected count rate.
- In symbols, corrected count rate=measured count rate−background count rate\text{corrected count rate} = \text{measured count rate} - \text{background count rate}corrected count rate=measured count rate−background count rate.
Investigating how count rate falls with time
- Aim: to measure how the count rate from a short-lived radioactive source falls over time, and to show that the fall is exponential.
- Apparatus: a sealed protactinium generator bottle, a Geiger-Muller tube with a counter or datalogger, a stand, boss and clamp, a stopclock, a tray to stand the bottle in, disposable gloves and long-handled tongs.
- Variables: time is the independent variable, count rate is the dependent variable, and the distance from the source to the tube, the position of the bottle, the counting interval and the tube's operating voltage are all controlled.
- Method, background measurement:
- Set up the Geiger-Muller tube in the clamp with no source anywhere near it, and switch the counter on.
- Record the total number of counts over 300 s300\ \text{s}300 s, then divide by 300300300 to obtain the background count rate in counts per second.
- Take this reading before the source is brought out, because background must be known before it can be subtracted.
- Method, preparing the source:
- Wearing gloves, lift the sealed bottle with tongs and keep it at arm's length; the bottle is never opened.
- Shake the bottle firmly for several seconds so that the short-lived protactinium passes into the upper organic layer, then stand it in the tray and allow the two layers to separate.
- Clamp the window of the Geiger-Muller tube against the upper layer of the bottle, close to it but not touching, and note the separation so it can be kept the same.
- Method, taking readings:
- Start the stopclock and the counter at the same moment, and record the number of counts in each successive 10 s10\ \text{s}10 s interval.
- Continue for at least 200 s200\ \text{s}200 s without moving the bottle or the tube, since any change of distance would change the fraction of radiation detected.
- Convert each interval count into a count rate by dividing by the length of the interval in seconds.
- Subtract the background count rate from every value to obtain the corrected count rate.
- Repeat the whole run after the bottle has been shaken again, then average corresponding readings, because single readings scatter.
- Results: the corrected count rate falls steeply at first and then more gradually, and equal time intervals each remove the same fraction of the count rate rather than the same number of counts.
- Processing: plot corrected count rate on the vertical axis against time on the horizontal axis, draw a smooth curve of best fit rather than joining the points, and describe the shape of the fall in words.
- Watch out: forgetting the background subtraction flattens the tail of the curve; moving the tube during the run changes the detected fraction and puts a step in the graph; too short a counting interval gives so few counts that the scatter hides the trend.
- Safety: keep the bottle sealed at all times, handle it with gloves and tongs, hold it away from your body, stand it in a tray in case of leakage, return it to the store immediately after use, and wash your hands afterwards.
Correcting a count rate for background
- A counter records 150015001500 counts in 300 s300\ \text{s}300 s with no source present.
- The background count rate is 1500300=5.0\dfrac{1500}{300} = 5.03001500=5.0 counts per second.
- With the source in place, the counter records 360360360 counts in 10 s10\ \text{s}10 s.
- The measured count rate is 36010=36\dfrac{360}{10} = 3610360=36 counts per second.
- The corrected count rate is 36−5.0=3136 - 5.0 = 3136−5.0=31 counts per second.
- Every later reading in the same experiment must have the same 5.05.05.0 counts per second taken off it.
Converting between activity and decays
- A source is labelled as having an activity of 2.4 kBq2.4\ \text{kBq}2.4 kBq.
- Converting the unit gives 2.4 kBq=2.4×1000=2400 Bq2.4\ \text{kBq} = 2.4 \times 1000 = 2400\ \text{Bq}2.4 kBq=2.4×1000=2400 Bq.
- Since 1 Bq1\ \text{Bq}1 Bq is one decay per second, the source undergoes 240024002400 decays every second.
- Over one minute the number of decays is 2400×60=144 0002400 \times 60 = 144\,0002400×60=144000.
- This figure is only a good estimate if the activity has not fallen noticeably during that minute.
Writing about activity and count rate
- Use becquerel or Bq\text{Bq}Bq as the unit of activity, and counts per second for a count rate, because the two are measured and named differently.
- Explain the fall in activity through the number of undecayed nuclei, since saying only that the source gets weaker does not earn the reasoning mark.
- Mention background subtraction whenever you describe or improve a radioactivity measurement, because it is a standard marking point.
- Justify repeats by referring to the scatter between readings and the need to average, rather than to accuracy, which is not credited here.
- Say that the detector position must be kept fixed, and give the reason that the detected fraction of the emitted radiation would otherwise change.
- Read a value from a graph by drawing construction lines on the axes, because a bare number without them can lose the method mark.
- Do not treat the count rate as the activity, because a detector picks up only a small fraction of the radiation emitted.
- Do not leave background radiation in your readings, because it is present whether or not the source is there.
- Do not say that activity falls because the nuclei get tired or lose energy, since it falls because there are fewer undecayed nuclei left.
- Do not claim that cooling, sealing or dissolving a source changes its activity, because nothing done to the material affects the chance of a nucleus decaying.
- Do not describe the activity as reaching zero at a definite time, because the curve approaches zero without ever meeting it.
- Define activity and give its unit.
- How many decays per second does an activity of 3.5 kBq3.5\ \text{kBq}3.5 kBq represent?
- Explain why the activity of a source decreases over time.
- Why is a measured count rate always smaller than the activity of the source?
- A background count rate of 0.80.80.8 counts per second is measured. A reading with the source gives 24.524.524.5 counts per second. What is the corrected count rate?
- Why must the detector stay in the same position throughout a run?
6.4.2 Half-life and its random nature
What half-life means
Half-life
The half-life of a radioactive isotope is the time taken for half the undecayed nuclei in a sample to decay, or for the activity of a source to fall by half.
Undecayed nuclei
Undecayed nuclei are the nuclei in a sample that have not yet decayed at a given moment.
- Activity falls away smoothly towards zero, so there is no moment at which a source can be said to have finished decaying, and no way to quote a simple lifetime for it.
- Half-life solves this by timing the loss of a fixed fraction rather than a fixed amount, and the fraction chosen is one half.
- There are two equivalent statements of it, and either is acceptable.
- The time taken for half the undecayed nuclei in a sample to decay.
- The time taken for the activity of a source to fall to half its starting value.
- The two agree because activity is proportional to the number of undecayed nuclei, so halving one halves the other.
- Half-life is a time, so it is quoted in seconds, hours, days or years, and never as a fraction or a rate.
- Half-life is a property of the isotope, so every sample of the same isotope shares it, and it cannot be altered by heating, cooling, dissolving, compressing or chemically reacting the material.
- A short half-life means the activity dies away quickly, and a long half-life means a lower activity that persists for a very long time.
Half-life is constant along the curve
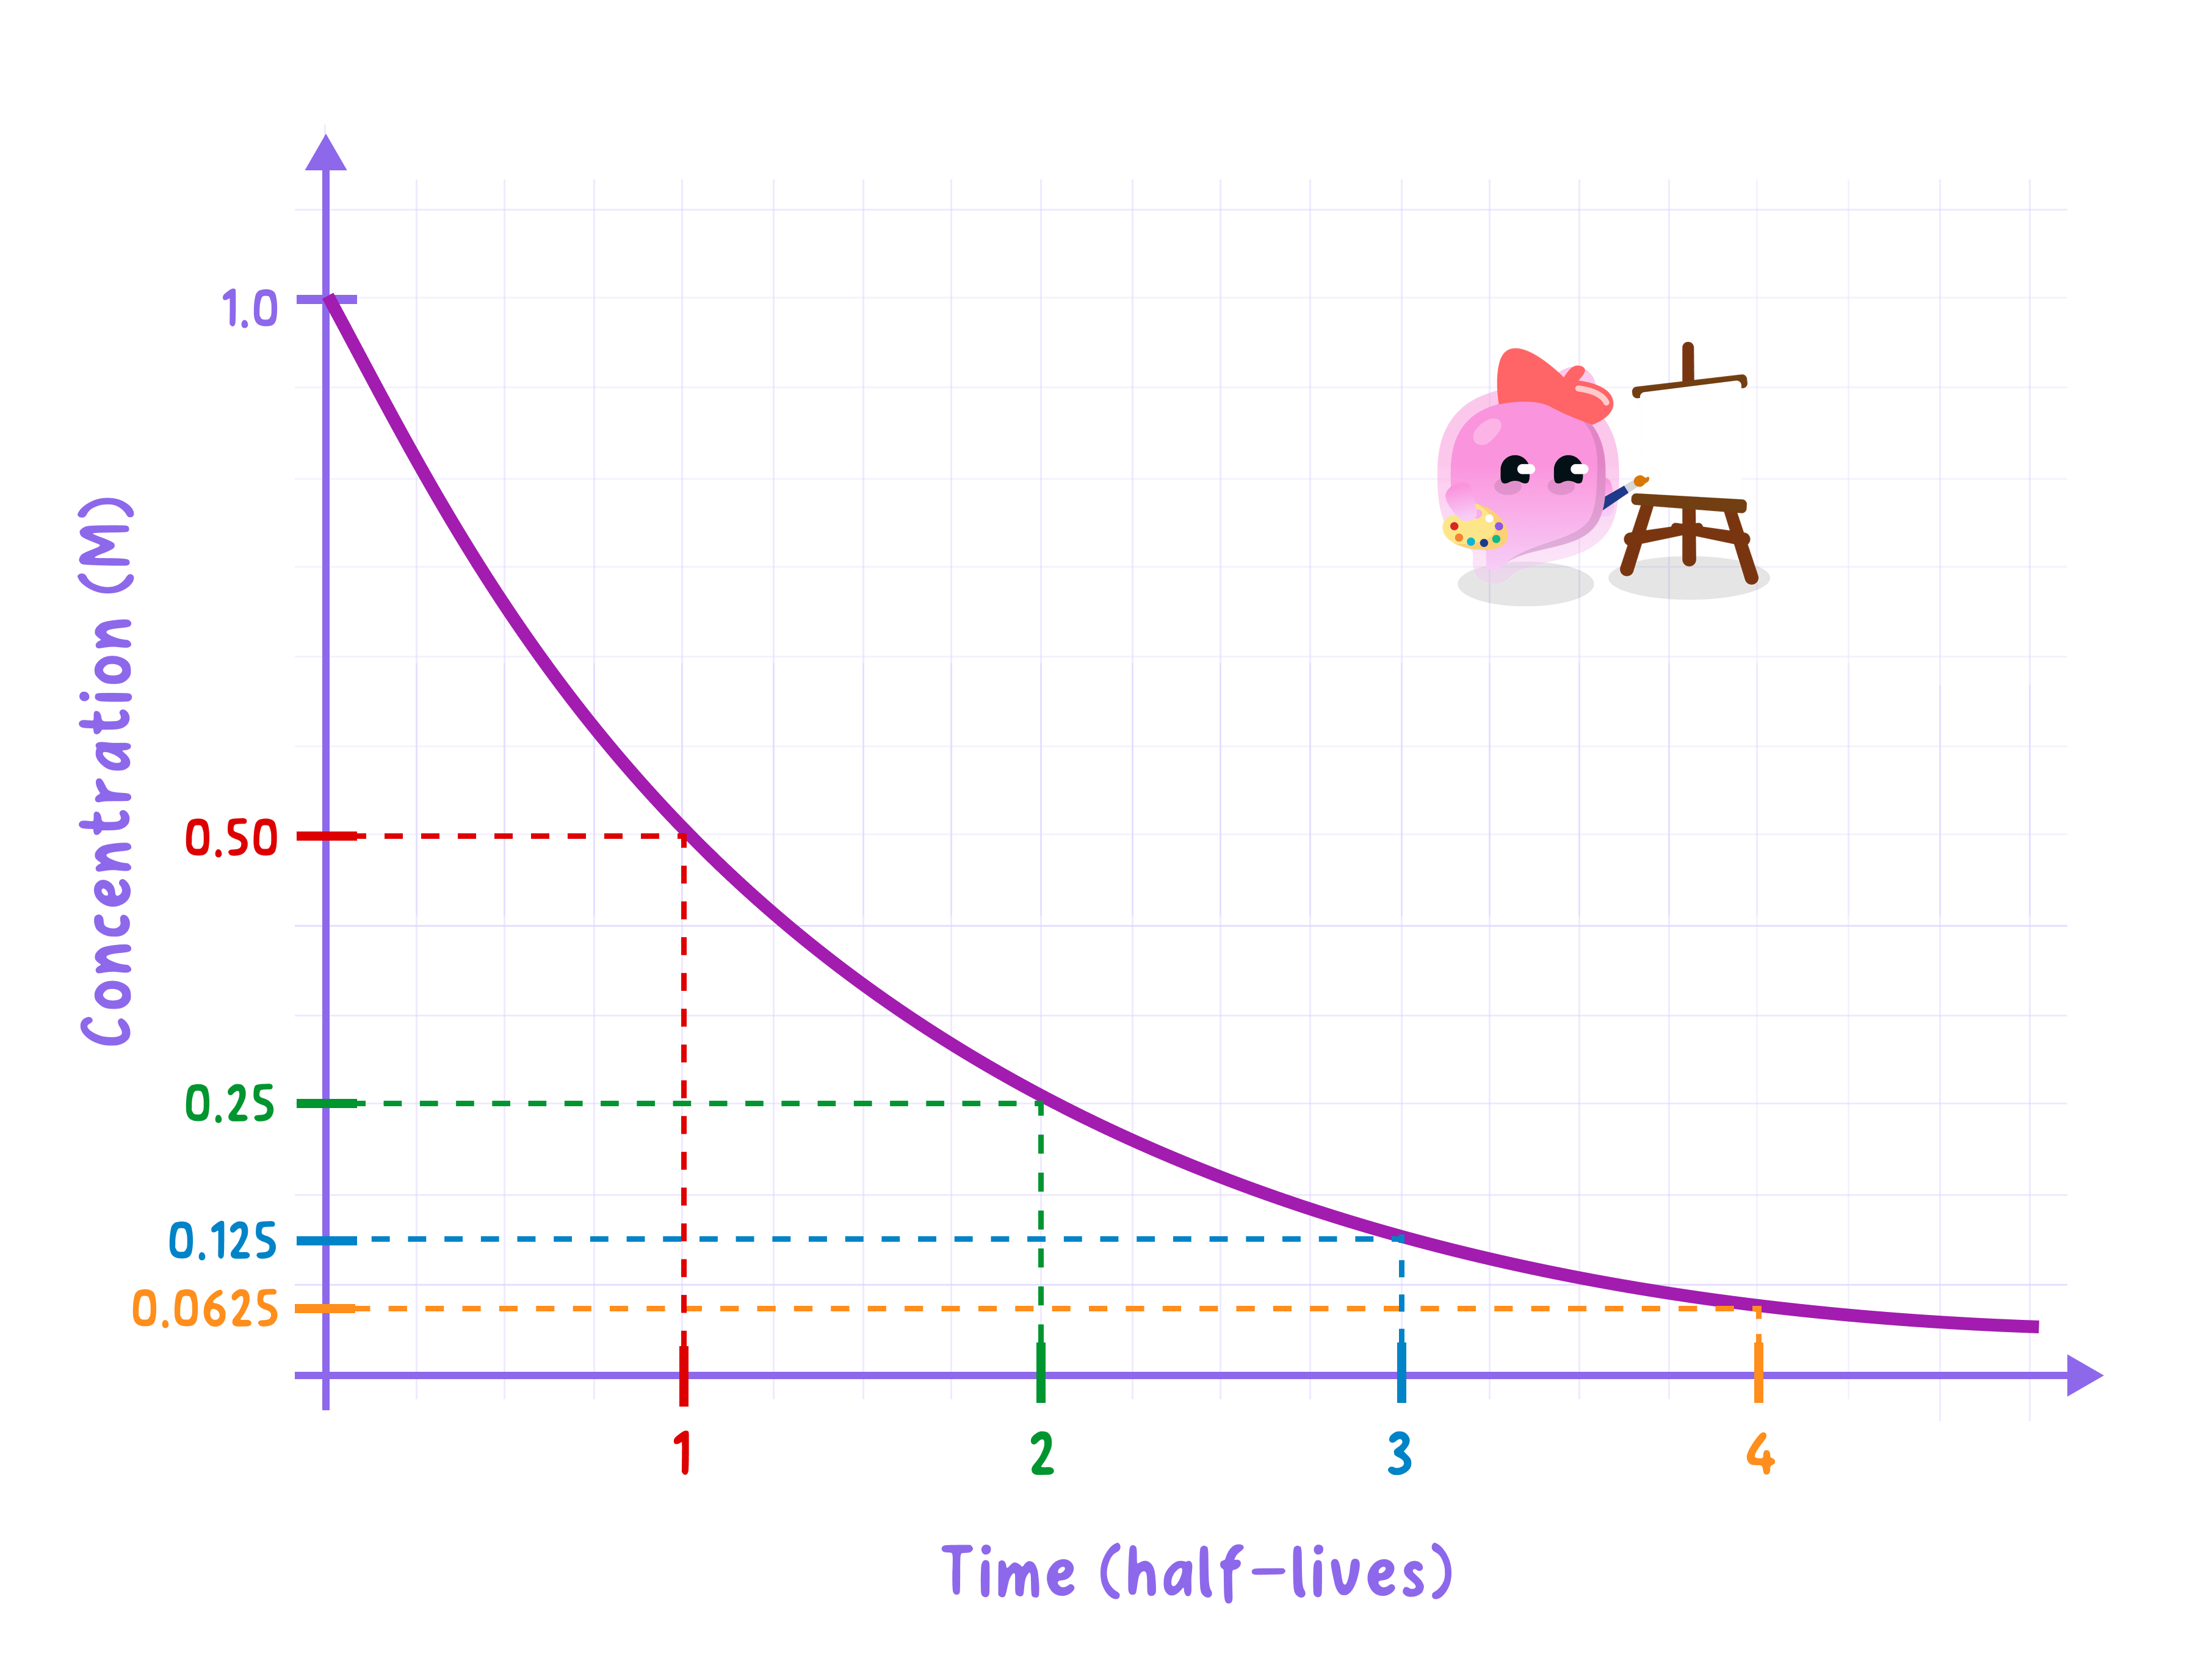
- The defining property is that the same interval of time removes the same fraction of what is left, wherever on the curve you begin.
- So the time to fall from the full amount to a half is the same as the time to fall from a half to a quarter, and the same again from a quarter to an eighth.
- This is why the fall is described as exponential: the step down is always proportional to the amount currently present.
- It also explains the shape of the graph, which is steep at the start where there is most left to lose and shallow later where there is least.
- Because the fraction lost is fixed, the amount remaining never reaches zero on the graph, and the curve approaches the time axis without meeting it.
- A practical consequence is that half-life can be measured from any convenient pair of points on a curve, not only from the starting value, and several such measurements should agree.
Why decay is random
Random process
A random process is one in which the outcome of any individual event cannot be predicted, so it is impossible to say when a particular nucleus will decay.
- Nothing inside a nucleus counts down to its decay, and a nucleus does not age, wear out or become more likely to decay the longer it has already survived.
- Every undecayed nucleus of a given isotope simply carries the same fixed chance of decaying in the next second.
- It is therefore impossible to predict when a particular nucleus will decay, and impossible to say which nucleus in a sample will be next.
- It is equally impossible to make a chosen nucleus decay sooner or later, because nothing done to the material changes that fixed chance.
- What can be predicted is the behaviour of a very large number of nuclei taken together, and this is exactly what half-life does.
- Even a very small sample holds nuclei in numbers of the order of 102010^{20}1020, so although each one is unpredictable, the fraction that decays in a given interval is almost exactly the same every time.
- Half-life is therefore a statistical quantity: it predicts the activity of a large sample reliably while saying nothing whatever about any individual nucleus.
- The randomness is still visible when the numbers involved are small, which is why a count taken over a few seconds jumps about while the same source counted over several minutes gives a steady value.
- Readings taken late in the decay scatter far more than early ones, because by then too few nuclei remain for the averaging to work well.
- The two ideas fit together rather than contradicting each other: the process is random at the level of one nucleus and predictable at the level of a whole sample.
Modelling random decay with dice
- Aim: to model radioactive decay with dice, showing that a random process with a fixed chance per interval produces a constant half-life.
- Apparatus: 100100100 identical dice, a large shallow tray with raised sides, a results table, graph paper and a calculator.
- Variables: the throw number stands for time and is the independent variable, the number of dice remaining stands for the number of undecayed nuclei and is the dependent variable, and the starting number of dice, the chance of decay per throw and the shaking technique are controlled.
- What each part of the model stands for:
- One die stands for one undecayed nucleus, and one throw of all the dice stands for one interval of time.
- A die landing on a six has decayed and is removed, so every die carries the same chance of 16\dfrac{1}{6}61 of decaying in each interval.
- Which particular die shows a six is unpredictable, which is the feature of real decay the model exists to show.
- Method:
- Record 100100100 as the number remaining at throw 000, before any dice have been removed.
- Place all 100100100 dice in the tray, shake it so that every die tumbles freely, then tip them out onto a flat surface.
- Remove every die showing a six, count the dice left and record that number against throw 111.
- Return only the remaining dice to the tray, so each throw starts from a smaller population than the one before.
- Repeat for at least 151515 throws, or until fewer than five dice remain, recording the number remaining after every throw.
- Pool the whole class's results by adding the numbers remaining at each throw number, because a larger starting population smooths out the scatter.
- Results: the number remaining falls by roughly the same fraction at each throw, so many dice are removed early and only a few at each of the later throws.
- Processing: plot the number of dice remaining on the vertical axis against throw number on the horizontal axis, draw a smooth curve of best fit rather than joining the points, then check that the number of throws taken to fall from 100100100 to 505050, from 505050 to 252525 and from 252525 to about 121212 come out the same.
- Expected pattern: with a chance of 16\dfrac{1}{6}61 per throw the model gives a half-life of roughly four throws, and the same value is obtained from any part of the curve.
- Watch out: returning removed dice destroys the model, because a decayed nucleus does not come back; one group's data is very noisy near the end and should be pooled; failing to shake the tray properly makes the throws less than random.
- Limitations of the model: a die that survives is completely unchanged, whereas a real decay leaves a new nucleus behind, and real decay runs continuously rather than in separate throws.
- Safety: use a tray with raised sides so that dice are not scattered onto the floor and do not become a trip hazard.
What randomness looks like in a measurement
- A long-lived source is placed a fixed distance from a detector and five successive counts are taken, each lasting 10 s10\ \text{s}10 s.
- The five counts come out noticeably different from one another, even though nothing about the source or the apparatus has changed.
- The variation is not a fault in the equipment; it happens because the number of nuclei that happen to decay in any 10 s10\ \text{s}10 s window is a matter of chance.
- Counting instead for a single interval of 600 s600\ \text{s}600 s gathers so many more decays that the same chance variation becomes a much smaller share of the total.
- The steadier value from the longer count is the reason a radioactivity experiment uses long counting intervals and averages several repeats.
Why pooling the dice results helps
- One group starting with 100100100 dice expects about 171717 sixes on the first throw, but may well remove 111111 or 232323 instead.
- By the twelfth throw only a handful of dice are left, so removing one die or none changes the plotted point a great deal and the curve looks ragged.
- Adding the results of thirty groups makes the population at every throw about thirty times larger.
- The chance variation in each group partly cancels against the others, so the pooled totals sit much closer to the smooth curve.
- The same reasoning applies to a real source: the enormous number of nuclei present is what makes its decay curve smooth.
Stating half-life and randomness
- Define half-life using the words half the undecayed nuclei or half the activity, because a loose statement about the source halving is not precise enough.
- Include the word time in the definition, since half-life is an interval of time.
- When asked about randomness, give both halves: an individual nucleus cannot be predicted, and a large number of nuclei can be.
- Use the phrase cannot be predicted rather than saying decay is unknown or uncertain.
- Justify repeat readings by naming the random nature of decay and the need to average, because reliability and consistency are credited here while accuracy is not.
- For a question on the dice model, link each rule to the thing it represents, since the marks are for the comparison rather than for the procedure.
- If asked why the model is limited, name a specific difference such as the discrete throws, rather than saying only that it is not realistic.
- Do not define half-life as the time for a source to decay completely, because the activity approaches zero without ever reaching it.
- Do not define half-life as the time for half the mass of the sample to disappear, because the atoms are still there as a different element.
- Do not say that half-life gets shorter as the source decays, because it is constant and applies from any point on the curve.
- Do not claim that half-life can be changed by anything done to the material, because nothing alters the chance of a nucleus decaying.
- Do not take randomness to mean the overall pattern is unpredictable, because a large sample behaves very predictably.
- Do not say a nucleus becomes more likely to decay the longer it has survived, because its chance in the next second never changes.
- Give two equivalent definitions of half-life.
- Explain why the time to fall from a half to a quarter equals the time to fall from the full amount to a half.
- Why is it impossible to predict when a particular nucleus will decay?
- Why can the activity of a large sample still be predicted?
- Name two things that cannot change the half-life of an isotope.
- In the dice model, what does removing a die showing a six represent?
- State one way in which the dice model differs from real radioactive decay.
6.4.3 Half-life calculations
Counting half-lives
Half-life
The half-life of a radioactive isotope is the time taken for half the undecayed nuclei in a sample to decay, or for the activity of a source to fall by half.
Undecayed nuclei
Undecayed nuclei are the nuclei in a sample that have not yet decayed at a given moment.
- Every half-life calculation turns on one number: how many half-lives have passed.
- The number of half-lives is n=tt1/2n = \dfrac{t}{t_{1/2}}n=t1/2t, where ttt is the total elapsed time and t1/2t_{1/2}t1/2 is the half-life.
- Both times must be in the same unit before dividing, so a time given in hours and a half-life given in minutes must be converted first.
- Each half-life multiplies whatever is left by 12\dfrac{1}{2}21, so after nnn half-lives the fraction remaining is (12)n=12n\left(\dfrac{1}{2}\right)^{n} = \dfrac{1}{2^{n}}(21)n=2n1.
- It is worth knowing the first few values by sight: 12\dfrac{1}{2}21, 14\dfrac{1}{4}41, 18\dfrac{1}{8}81, 116\dfrac{1}{16}161, 132\dfrac{1}{32}321, 164\dfrac{1}{64}641 for n=1n = 1n=1 to 666.
- The same fraction applies whether the quantity being tracked is the activity, the count rate or the number of undecayed nuclei, because all three fall together in proportion.
- For activity, this gives A=A0×(12)nA = A_{0} \times \left(\dfrac{1}{2}\right)^{n}A=A0×(21)n, where A0A_{0}A0 is the starting activity and AAA is the activity after nnn half-lives.
- For nuclei, the same relationship is N=N0×(12)nN = N_{0} \times \left(\dfrac{1}{2}\right)^{n}N=N0×(21)n.
- The fraction that has decayed is whatever is left over, so it is 1−12n1 - \dfrac{1}{2^{n}}1−2n1; after 333 half-lives, 18\dfrac{1}{8}81 remains and 78\dfrac{7}{8}87 has decayed.
- Reading the question carefully matters here, because it may ask for the amount remaining, the amount decayed, or the ratio between them, and these are three different answers.
The four question types
- Type one: find the amount left after a given time. Work out nnn, then halve the starting value nnn times, or multiply it by 12n\dfrac{1}{2^{n}}2n1.
- Type two: find the time for a given fall. Count how many halvings take the starting value to the final value, then multiply that count by the half-life, since t=n×t1/2t = n \times t_{1/2}t=n×t1/2.
- Type three: find the half-life. Count the halvings between the two given values to get nnn, then divide the elapsed time by it, since t1/2=tnt_{1/2} = \dfrac{t}{n}t1/2=nt.
- Type four: express the fall as a ratio. Give the answer in the form final to initial, such as 1:81 : 81:8, or as the fraction 18\dfrac{1}{8}81, whichever the question asks for.
- When nnn is not a whole number, halving repeatedly will not reach the answer exactly, and the value must be read from a graph instead.
- Working in whole halvings is the quickest and safest route whenever the numbers allow it, because it needs no power key on the calculator.
Finding the activity after a given time
- A source has a starting activity of 6400 Bq6400\ \text{Bq}6400 Bq and a half-life of 151515 minutes, and the activity after 111 hour is required.
- Converting to a common unit gives t=60t = 60t=60 minutes and t1/2=15t_{1/2} = 15t1/2=15 minutes.
- The number of half-lives is n=6015=4n = \dfrac{60}{15} = 4n=1560=4.
- The fraction remaining is 124=116\dfrac{1}{2^{4}} = \dfrac{1}{16}241=161.
- Substituting gives A=6400×116=400 BqA = 6400 \times \dfrac{1}{16} = 400\ \text{Bq}A=6400×161=400 Bq.
- Halving four times checks this: 6400→3200→1600→800→400 Bq6400 \rightarrow 3200 \rightarrow 1600 \rightarrow 800 \rightarrow 400\ \text{Bq}6400→3200→1600→800→400 Bq.
Finding the half-life from two readings
- A count rate falls from 960960960 counts per second to 606060 counts per second in 121212 hours, and the half-life is required.
- Halving from the start gives 960→480→240→120→60960 \rightarrow 480 \rightarrow 240 \rightarrow 120 \rightarrow 60960→480→240→120→60 counts per second.
- That is four halvings, so n=4n = 4n=4.
- Substituting into t1/2=tnt_{1/2} = \dfrac{t}{n}t1/2=nt gives t1/2=124=3t_{1/2} = \dfrac{12}{4} = 3t1/2=412=3 hours.
- Checking the fraction confirms it: 60960=116=124\dfrac{60}{960} = \dfrac{1}{16} = \dfrac{1}{2^{4}}96060=161=241, which needs exactly four half-lives.
Finding the time for a given fall
- An isotope has a half-life of 888 days, and the time for its activity to fall to one eighth of its starting value is required.
- Writing the fraction as a power of a half gives 18=123\dfrac{1}{8} = \dfrac{1}{2^{3}}81=231, so n=3n = 3n=3.
- Substituting into t=n×t1/2t = n \times t_{1/2}t=n×t1/2 gives t=3×8=24t = 3 \times 8 = 24t=3×8=24 days.
- Stated as a ratio, the activity has changed from 888 to 111, so the final to initial ratio is 1:81 : 81:8.
- The fraction that has decayed is 1−18=781 - \dfrac{1}{8} = \dfrac{7}{8}1−81=87 of the original nuclei.
Working with a number of nuclei
- A sample starts with 4.8×10124.8 \times 10^{12}4.8×10¹² undecayed nuclei of an isotope whose half-life is 252525 years, and the number left after a century is required.
- The number of half-lives is n=10025=4n = \dfrac{100}{25} = 4n=25100=4.
- The fraction remaining is 124=116\dfrac{1}{2^{4}} = \dfrac{1}{16}241=161.
- Substituting gives N=4.8×1012×116=3.0×10¹¹N = 4.8 \times 10^{12} \times \dfrac{1}{16} = 3.0 \times 10^{11}N=4.8×1012×161=3.0×10¹¹.
- The number that has decayed is 4.8×10¹²−3.0×1011=4.5×10124.8 \times 10^{12} - 3.0 \times 10^{11} = 4.5 \times 10^{12}4.8×10¹²−3.0×1011=4.5×10¹².
- Keeping the answer in standard form avoids a power of ten error, which is the commonest slip in questions of this kind.
Reading a decay curve
Decay curve
A decay curve is a graph of activity, count rate or number of undecayed nuclei against time for a radioactive source.
- A decay curve plots activity, count rate or number of undecayed nuclei on the vertical axis against time on the horizontal axis.
- Start by reading the value on the vertical axis at t=0t = 0t=0, which is the starting value A0A_{0}A0.
- Halve that value, find the halved value on the vertical axis, and draw a horizontal construction line across to the curve.
- From that meeting point, drop a vertical construction line down to the time axis and read off the time, which is the half-life.
- Repeat the same steps starting from a different point on the curve, for instance from the half value down to the quarter value, and check that the two times agree.
- Averaging two or three such readings gives a better value than one, because the curve is drawn through scattered points.
- Leave the construction lines on the graph, since they show the method and are what a marker looks for.
- Where the vertical axis is a count rate, subtract any background count rate the question supplies before halving, otherwise the halving is applied to the wrong starting value.
- To read the value at a time between plotted points, go up from the time axis to the curve and across, rather than trying to calculate it.
Taking a half-life from a graph
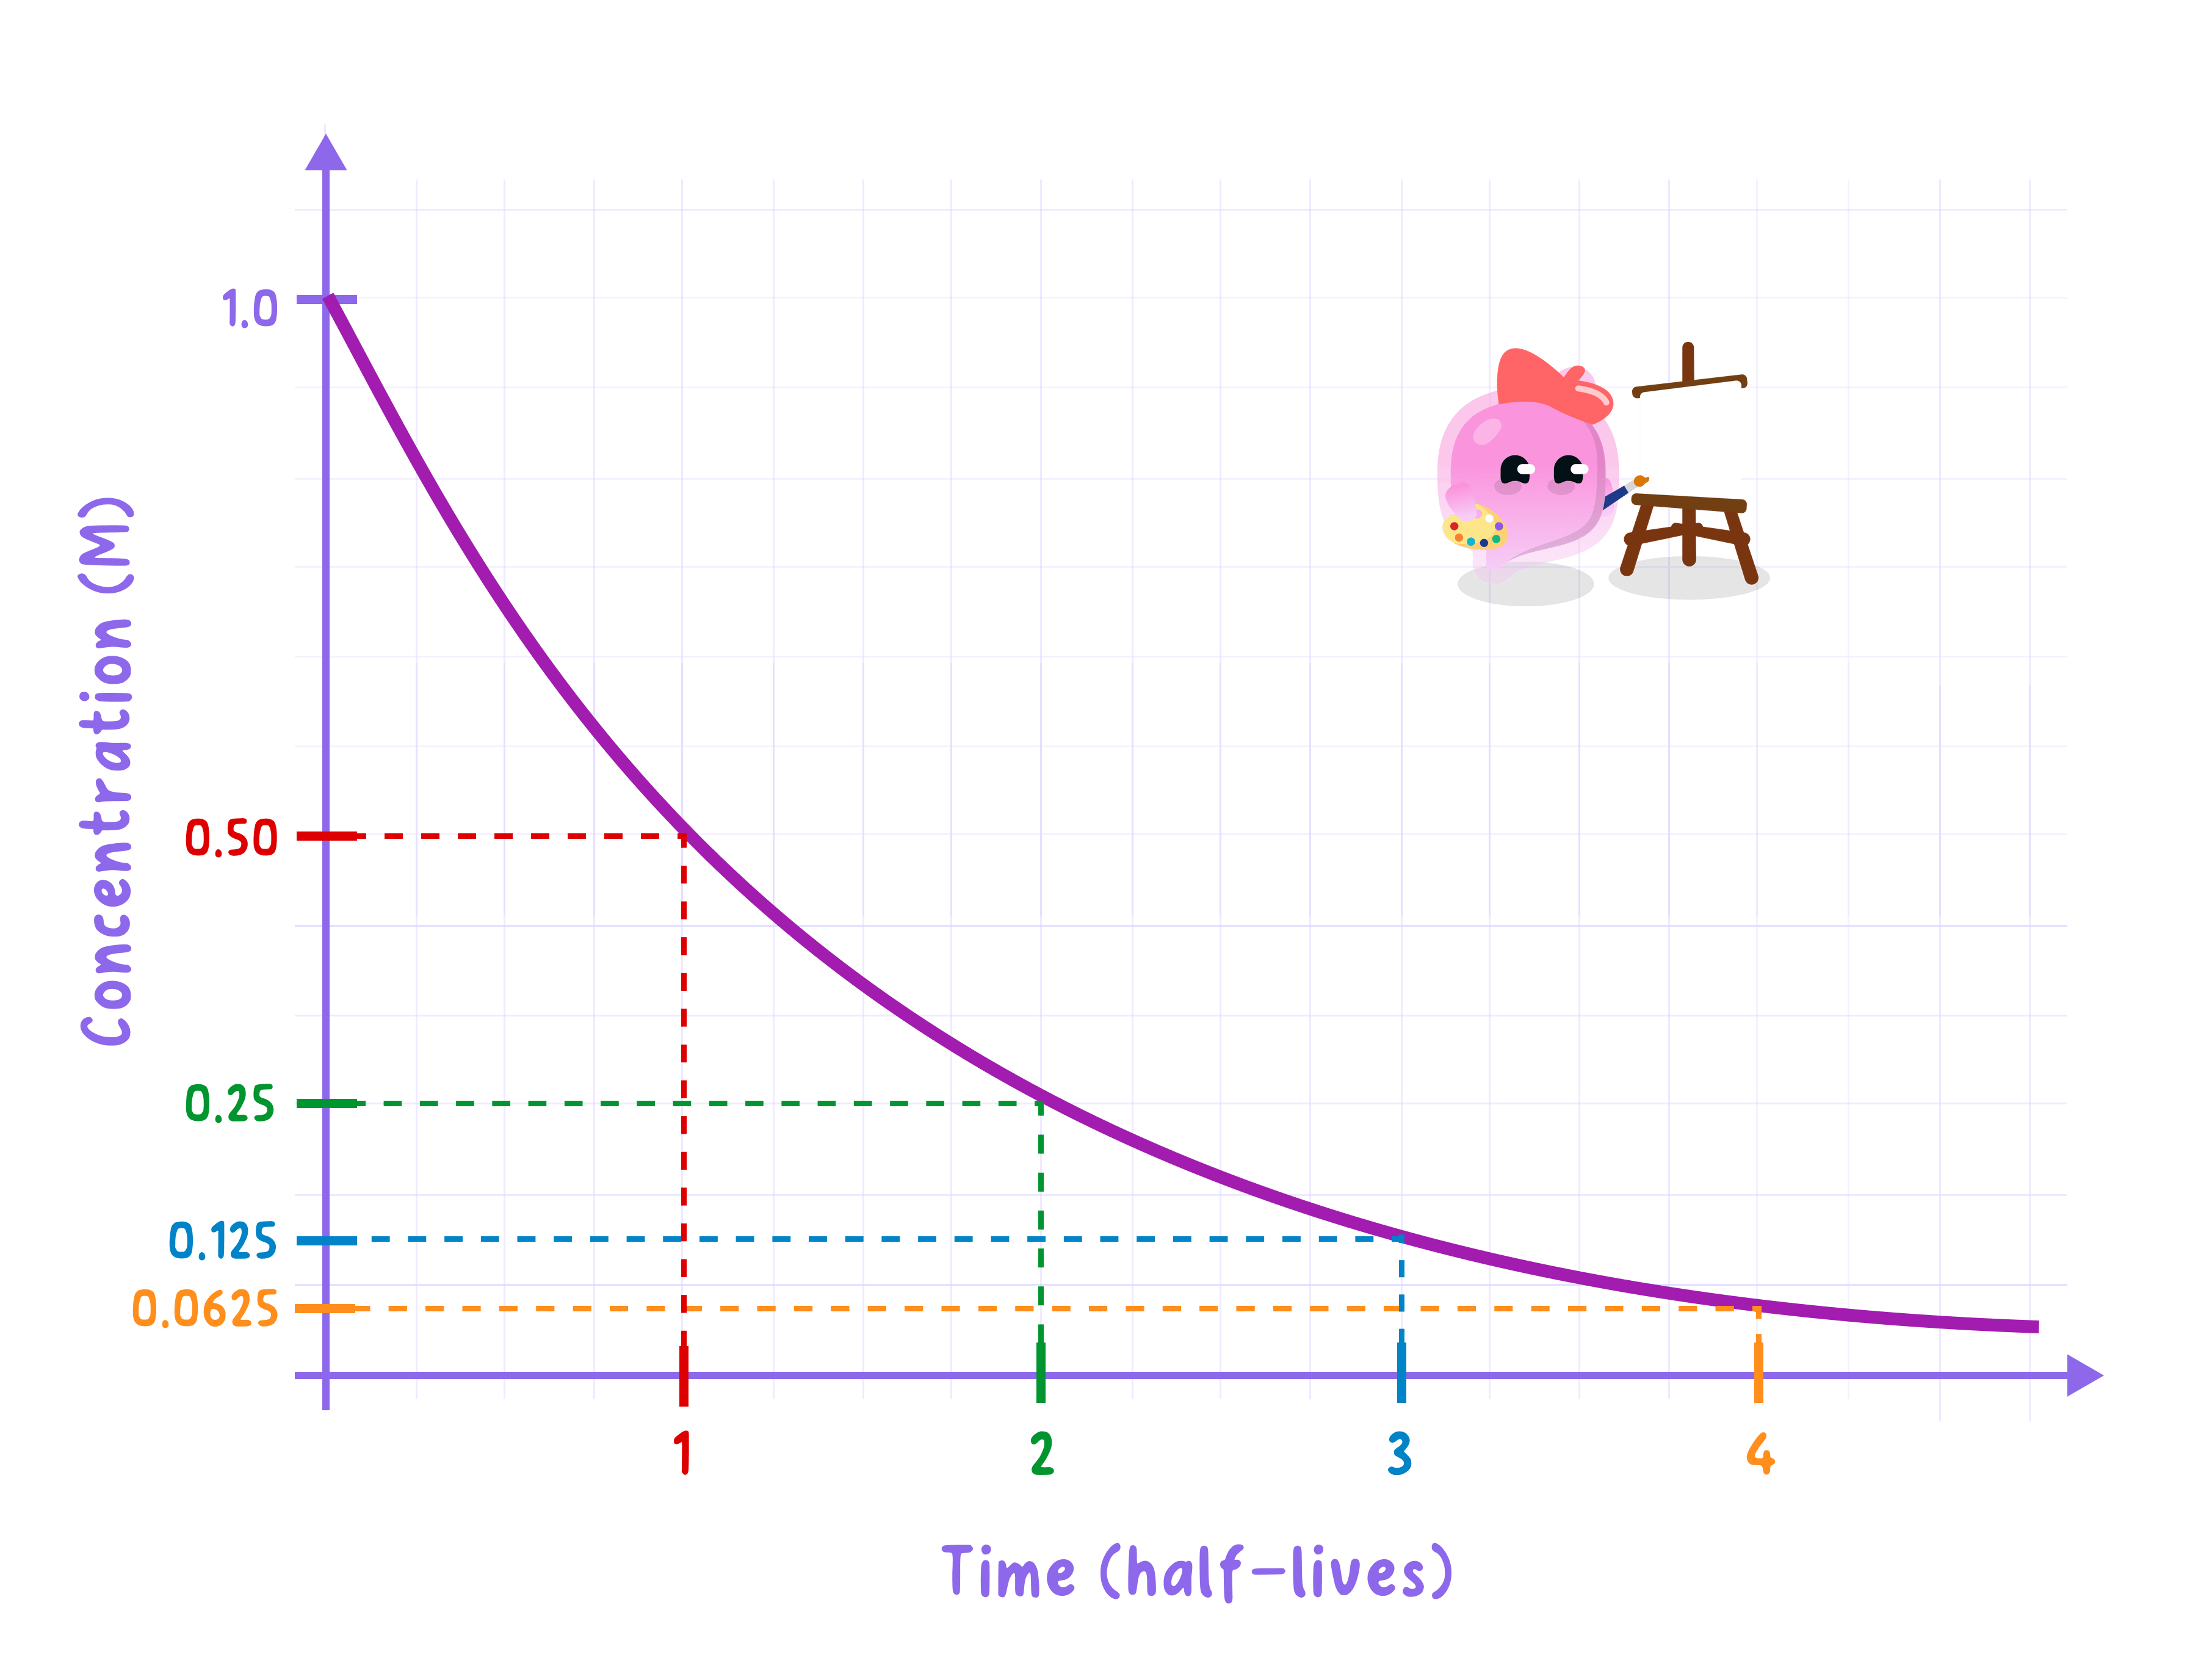
- A decay curve of count rate against time starts at 808080 counts per second at t=0t = 0t=0.
- Half of 808080 is 404040, so a horizontal line is drawn from 404040 on the vertical axis across to the curve.
- Dropping a vertical line from that point meets the time axis at 666 minutes, giving a first half-life value of 666 minutes.
- For a second reading, half of 404040 is 202020, and the same construction gives a time of 121212 minutes.
- The interval between the two readings is 12−6=612 - 6 = 612−6=6 minutes, which agrees with the first value.
- Since both readings give 666 minutes, the half-life is 666 minutes.
Setting out a half-life calculation
- Show the number of half-lives as a separate line of working, because nnn is usually worth a mark of its own.
- Print the substitution with the numbers in it, such as A=6400×116A = 6400 \times \dfrac{1}{16}A=6400×161, rather than only the rearranged formula.
- Convert both times into the same unit before dividing, and state the unit you converted to.
- Give the unit with the final answer, since a bare number can be marked down where the unit carries a mark.
- Write out the successive halvings when the numbers are friendly, because each halving is visible working that can earn credit if the final value slips.
- Answer the question that was asked: remaining, decayed, or a ratio are three different answers from the same value of nnn.
- For a graph question, draw and leave the construction lines, and take two readings from different parts of the curve.
- Keep large or small numbers in standard form throughout, because a power of ten error can cost every mark after it.
- Do not multiply the starting value by nnn or divide it by 2n2n2n, because each half-life multiplies what is left by 12\dfrac{1}{2}21 and the effect compounds.
- Do not assume the activity is zero once several half-lives have passed, because a fraction always remains.
- Do not divide the elapsed time by the half-life and then treat the result as the answer, because that quotient is nnn and not the activity.
- Do not give the fraction remaining when the question asks for the fraction that has decayed, since the two add to 111.
- Do not read a half-life from a graph without halving the starting value first, because the interval must run between a value and its half.
- Do not forget to subtract a stated background count rate before halving, or the starting value will be too high.
- Do not mix units, because a half-life in minutes with a time in hours gives an answer wrong by a factor of 606060.
- Write the equation linking the number of half-lives, the elapsed time and the half-life.
- What fraction of the original nuclei remains after 555 half-lives?
- A source of activity 1200 Bq1200\ \text{Bq}1200 Bq has a half-life of 202020 minutes. What is its activity after 111 hour?
- A count rate falls from 640640640 to 404040 counts per second in 181818 hours. What is the half-life?
- An isotope has a half-life of 555 days. How long does its activity take to fall to one sixteenth of its starting value?
- Describe how to find a half-life from a graph of count rate against time.
- After 444 half-lives, what fraction of the original nuclei has decayed?
