x

Probability

What you'll learn

  • How to describe chance using numbers from 0 to 1.
  • How to read and mark a probability scale.
  • How to calculate simple probabilities from spinners, dice, cards, bags and tables.
  • How to find the probability of something not happening.

1. What probability means

Probability is all about how likely something is to happen. At GCSE Grade 2, most probability questions are about careful counting.

Definition

Probability words

  • Probability is a number that tells you how likely something is to happen.
  • An outcome is one possible result, such as rolling a 5.
  • An event is the outcome or group of outcomes you are interested in, such as rolling an even number.
  • At random means the result is not chosen on purpose.
  • Equally likely means each outcome has the same chance.
  • A fair dice or spinner has equal chances for equal sides or sections.
Key Idea

Main rule

For equally likely outcomes, use:

probability=number of wanted outcomestotal number of outcomes\text{probability} = \frac{\text{number of wanted outcomes}}{\text{total number of outcomes}}probability=total number of outcomesnumber of wanted outcomes​
Example

Choosing a number card

  1. Imagine seven cards show 2, 4, 4, 5, 7, 8 and 9. One card is picked at random.

Seven number cards show that repeated values count as separate outcomes when finding probabilities.

  1. There are 7 cards altogether, so the total number of outcomes is 7.

  2. The number 4 appears on 2 cards.

  3. The probability of picking a 4 is 27\frac{2}{7}72​.

  4. The odd numbers are 5, 7 and 9, so the probability of picking an odd number is 37\frac{3}{7}73​.

2. The probability scale

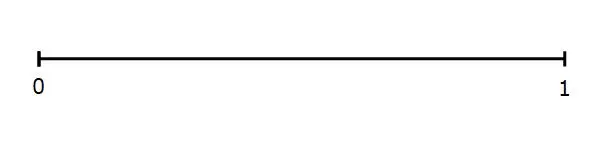
A probability scale is a line from 0 to 1.

  • 0 means impossible.
  • 1 means certain.
  • 12\frac{1}{2}21​ means an even chance.

If a probability is less than 12\frac{1}{2}21​, it is closer to impossible. If it is greater than 12\frac{1}{2}21​, it is closer to certain.

Example

Spinner and the probability scale

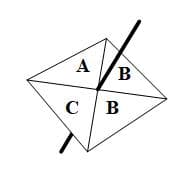
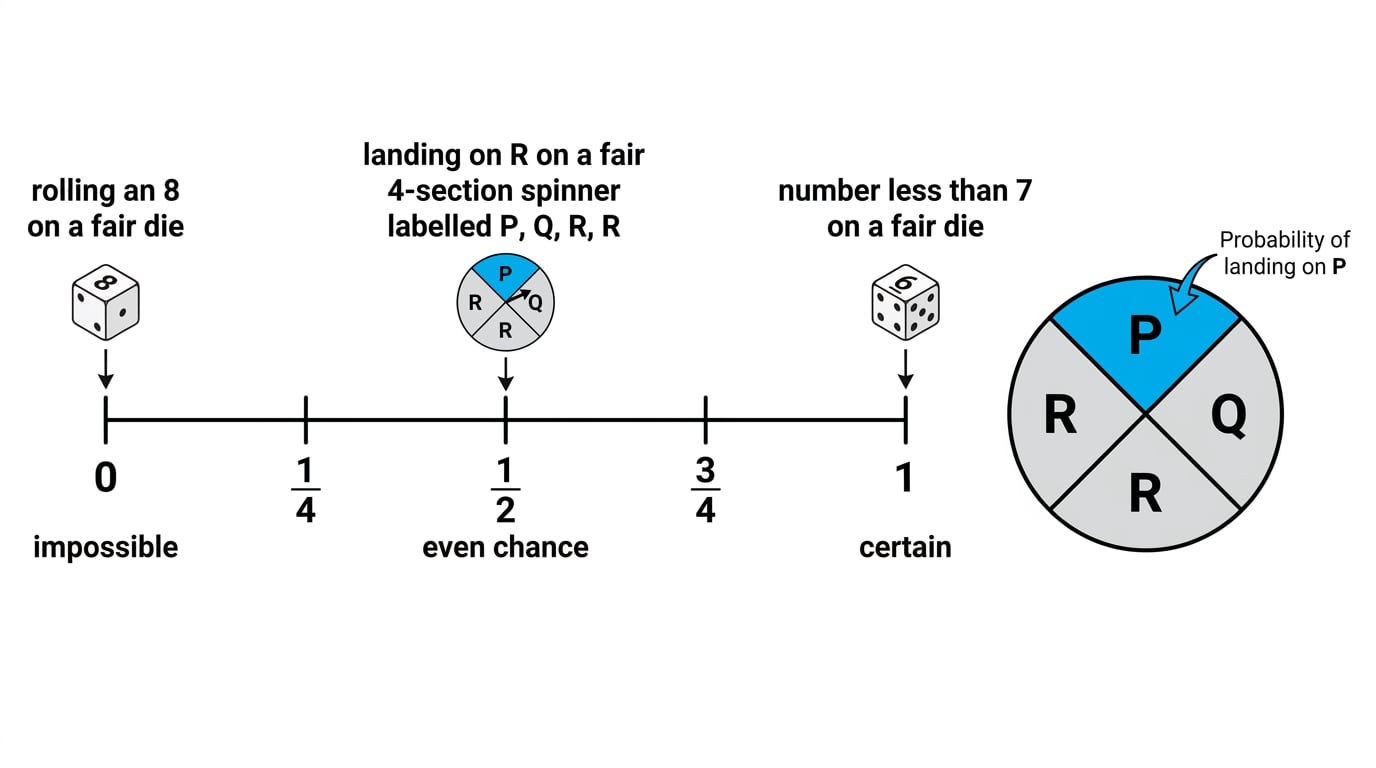
  1. A fair spinner has 4 equal sections labelled P, Q, R and R.

A fair spinner split into four equal sections, with one P section and two R sections, matches the probability scale marks.

  1. The spinner has 4 equal sections altogether.

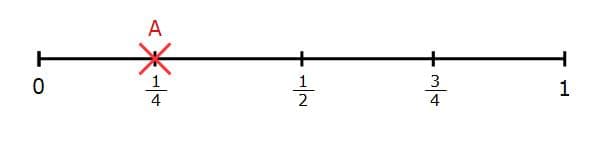
  2. There is 1 section labelled P, so the probability of landing on P is 14\frac{1}{4}41​.

  3. On a probability scale, 14\frac{1}{4}41​ goes halfway between 0 and 12\frac{1}{2}21​.

  4. There are 2 sections labelled R, so the probability of landing on R is 24=12\frac{2}{4} = \frac{1}{2}42​=21​.

Tip

Scale check

Quarters are useful on probability scales: 14\frac{1}{4}41​ is halfway between 0 and 12\frac{1}{2}21​, and 34\frac{3}{4}43​ is halfway between 12\frac{1}{2}21​ and 1.

3. Impossible and certain events

An ordinary fair dice has six equally likely outcomes: 1, 2, 3, 4, 5 and 6.

Some events cannot happen. Some events must happen.

Example

Dice probabilities

  1. A fair dice is rolled once.

The ordinary fair dice has outcomes 1 to 6, so impossible, even chance and certain events can be placed on the probability scale.

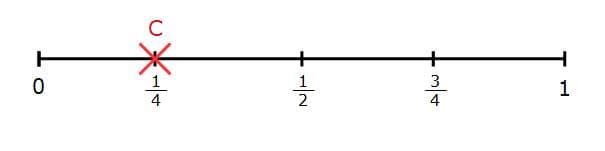
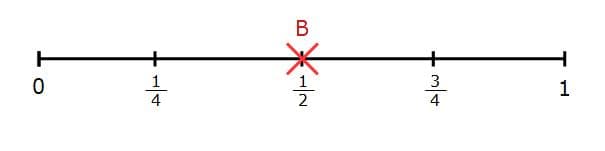
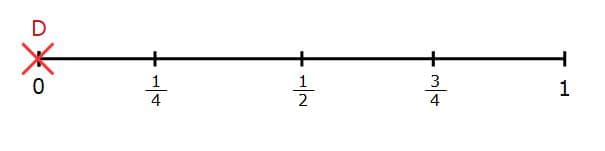
  1. The probability of rolling an 8 is 0, because 8 is not on an ordinary dice. On a probability scale, the cross goes at 0.

  2. The probability of rolling a number less than 7 is 1, because every number on the dice is less than 7. On a probability scale, the cross goes at 1.

  3. The numbers greater than 3 are 4, 5 and 6.

  4. There are 3 wanted outcomes out of 6, so the probability of rolling a number greater than 3 is 36=12\frac{3}{6} = \frac{1}{2}63​=21​.

Common Mistake

Less than means do not include the end number

“Less than 3” means 1 and 2 only. “Greater than 3” means 4, 5 and 6.

4. Bags, boxes and “the rest”

For bags and boxes, each item counts as one outcome.

If the question says “the rest are red”, subtract the known amounts from the total.

Example

Finding the rest

  1. A box contains 25 counters. There are 9 red counters and 6 blue counters. The rest are green.

The box diagram shows the 25 counters split into 9 red, 6 blue and the remaining green counters.

  1. First count the known counters: 9 + 6 = 15.

  2. Find the green counters: 25 - 15 = 10.

  3. There are 10 green counters out of 25 counters altogether.

  4. The probability of picking a green counter is 1025=25\frac{10}{25} = \frac{2}{5}2510​=52​.

  5. If there are no yellow counters in the box, the probability of picking a yellow counter is 0.

Common Mistake

Counting colours instead of items

If a bag has 5 red counters and 1 blue counter, red is not “1 out of 2 colours”. It is 5 out of 6 counters.

5. The probability of “not”

Sometimes you are asked for the probability that something does not happen.

Definition

Complement

The complement of an event means “the event does not happen”. The probabilities of an event and its complement add to 1.

You can either subtract from the total number of outcomes, or subtract the probability from 1.

Example

Raffle ticket not winning

  1. Aisha buys 12 tickets in a prize draw.

A bar model separates Aisha’s 12 tickets from the other tickets to show the complement, not Aisha’s ticket.

  1. There are 300 tickets altogether.

  2. The number of tickets that are not Aisha’s is 300 - 12 = 288.

  3. The probability that Aisha does not win is 288300\frac{288}{300}300288​.

  4. This can be simplified to 2425\frac{24}{25}2524​.

Example

Using 1 minus

  1. A player has probability 0.7 of winning a match.

The complement on a probability bar shows that winning and not winning together make 1.

  1. To find the probability of not winning, subtract from 1:

    1−0.7=0.31 - 0.7 = 0.31−0.7=0.3
  2. The probability of not winning is 0.3.

6. Tables

Tables can show counts or probabilities. Always check which type of table you have.

Tables with counts

If the table gives numbers of items, add the numbers to find the total.

Example

Counters in a table

  1. A bag has 6 red counters, 4 blue counters, 5 yellow counters and 3 green counters.

A frequency table makes it easier to add the total counters and identify the green and not blue outcomes.

  1. Add them to find the total: 6 + 4 + 5 + 3 = 18.

  2. There are 3 green counters, so the probability of picking green is 318=16\frac{3}{18} = \frac{1}{6}183​=61​.

  3. “Not blue” means every colour except blue.

  4. There are 18 - 4 = 14 counters that are not blue, so the probability of not blue is 1418=79\frac{14}{18} = \frac{7}{9}1814​=97​.

Tables with probabilities

If the table gives probabilities, they must add up to 1.

Example

Missing probability in a table

  1. A bag contains red, blue, yellow and green counters.

A probability table shows the known probabilities adding towards 1, with the green probability missing.

  1. The probability of red is 0.25, blue is 0.15 and yellow is 0.40.

  2. Add the known probabilities:

    0.25+0.15+0.40=0.800.25 + 0.15 + 0.40 = 0.800.25+0.15+0.40=0.80
  3. Subtract from 1:

    1−0.80=0.201 - 0.80 = 0.201−0.80=0.20
  4. The probability of green is 0.20.

Exam technique

In the exam

  1. Count the total number of equally likely outcomes first.

  2. Count the wanted outcomes carefully, especially when numbers or labels repeat.

  3. Check your answer is between 0 and 1.

  4. For “not” questions, either subtract the count from the total or subtract the probability from 1.

Self review

Check yourself

  • A fair spinner has 8 equal sections, and 3 are labelled A. What is the probability of landing on A?
  • On a probability scale, where would you place 34\frac{3}{4}43​?
  • If the probability of winning is 0.6, what is the probability of not winning?

Recap questions

Test yourself with 5 quick questions on this guide. Answer them all correctly to complete it.

How was this guide?

Probability Revision Guide

  1. GCSE
  2. /Maths
  3. /Probability