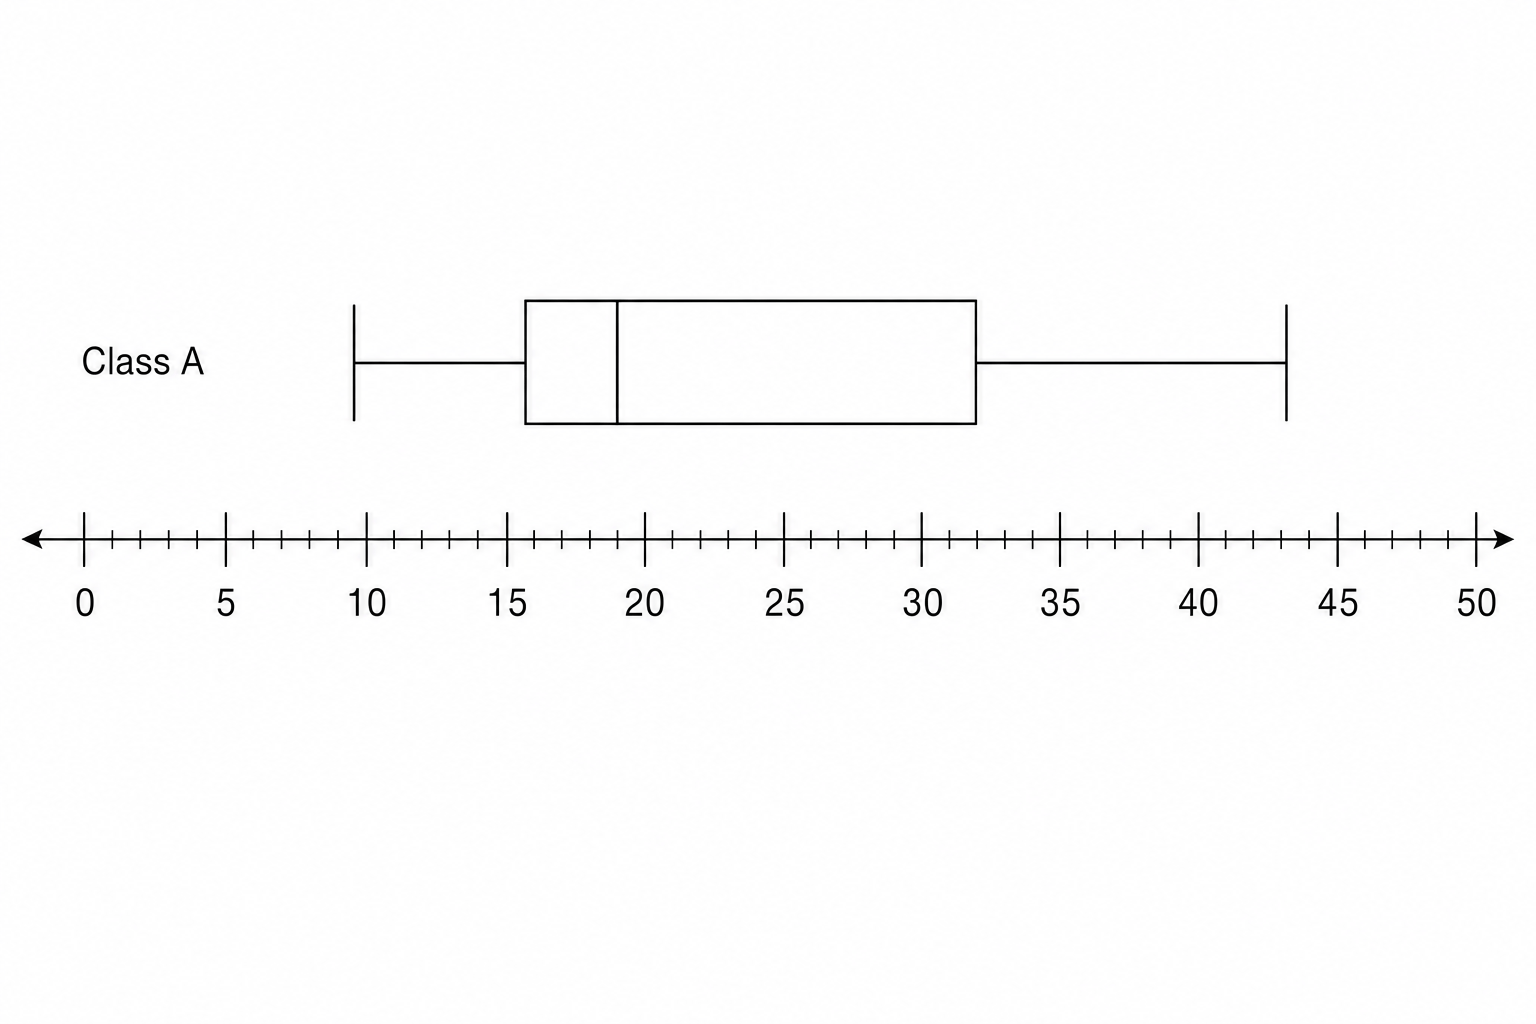
The table shows some information about the maths scores of students in class A.
| Minimum | Lower Quartile | Median | Upper Quartile | Maximum |
|---|---|---|---|---|
| 9 | 15 | 19 | 31 | 43 |
a.[2]
Draw a box plot for this information.
b.[2]
The box plot below shows the distribution of the maths scores of students in class B.
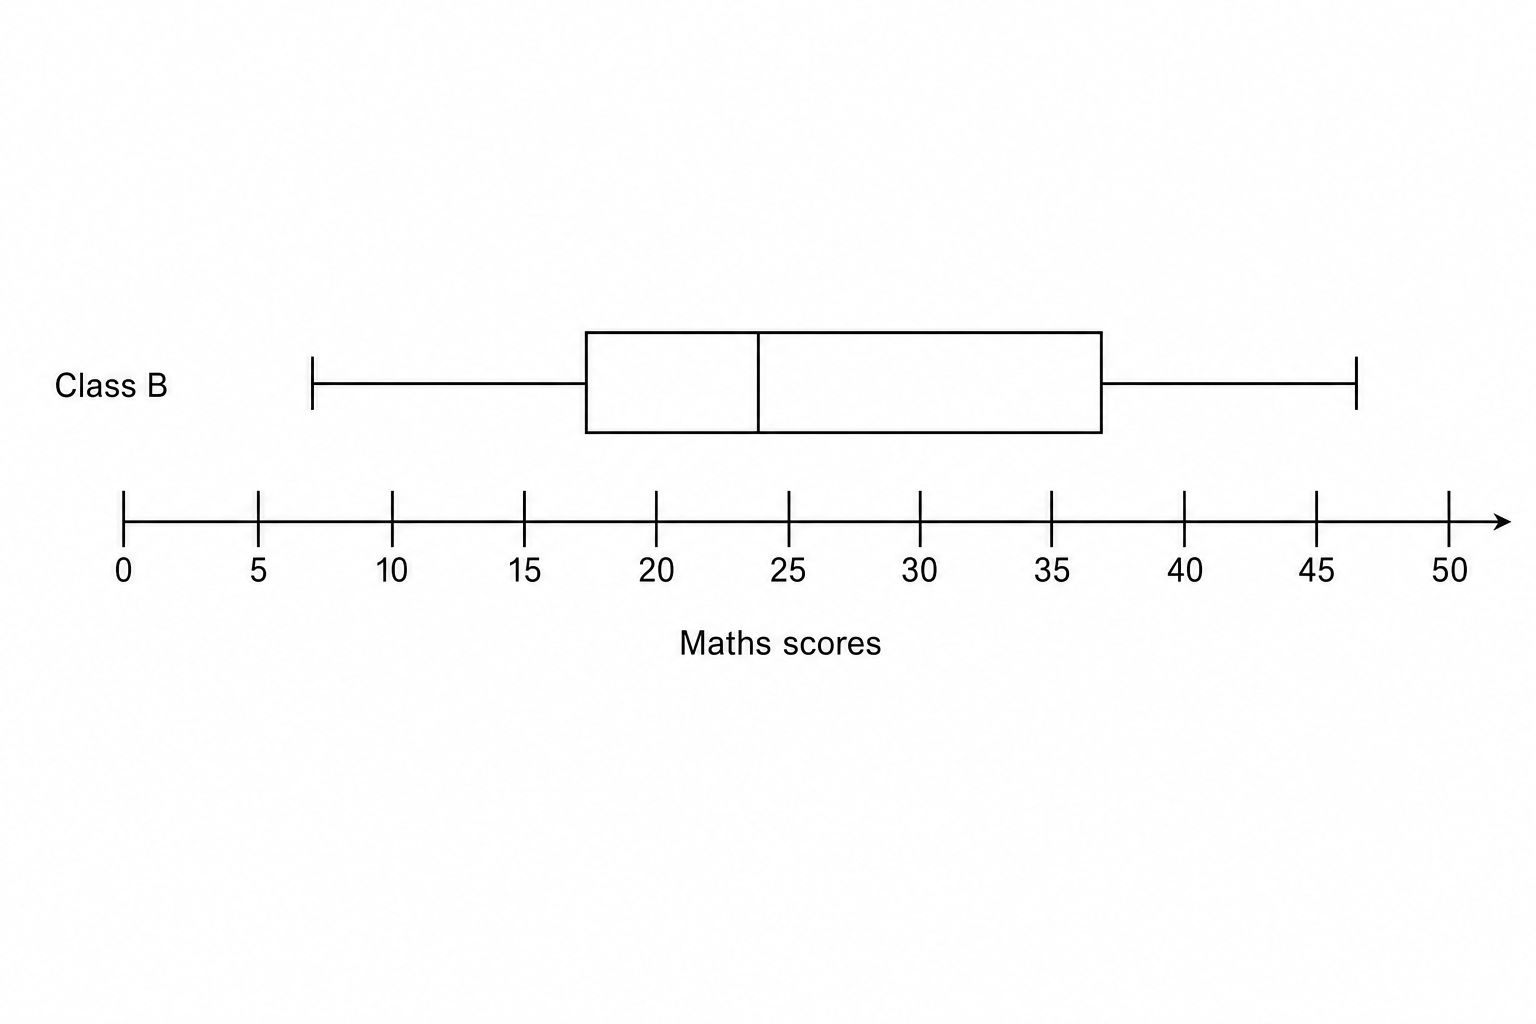
Compare the distribution of the maths scores of students in class A and class B.
Box Plots Questions
Practise OCR GCSE Maths Box Plots with exam-style questions for Foundation and Higher tier. 36 questions, matched to the OCR GCSE Maths (J560) specification and written in the written papers style. Every question includes a full worked solution and mark scheme, so you can see where marks are awarded rather than just whether you got the answer right.