What a histogram shows
What a histogram shows
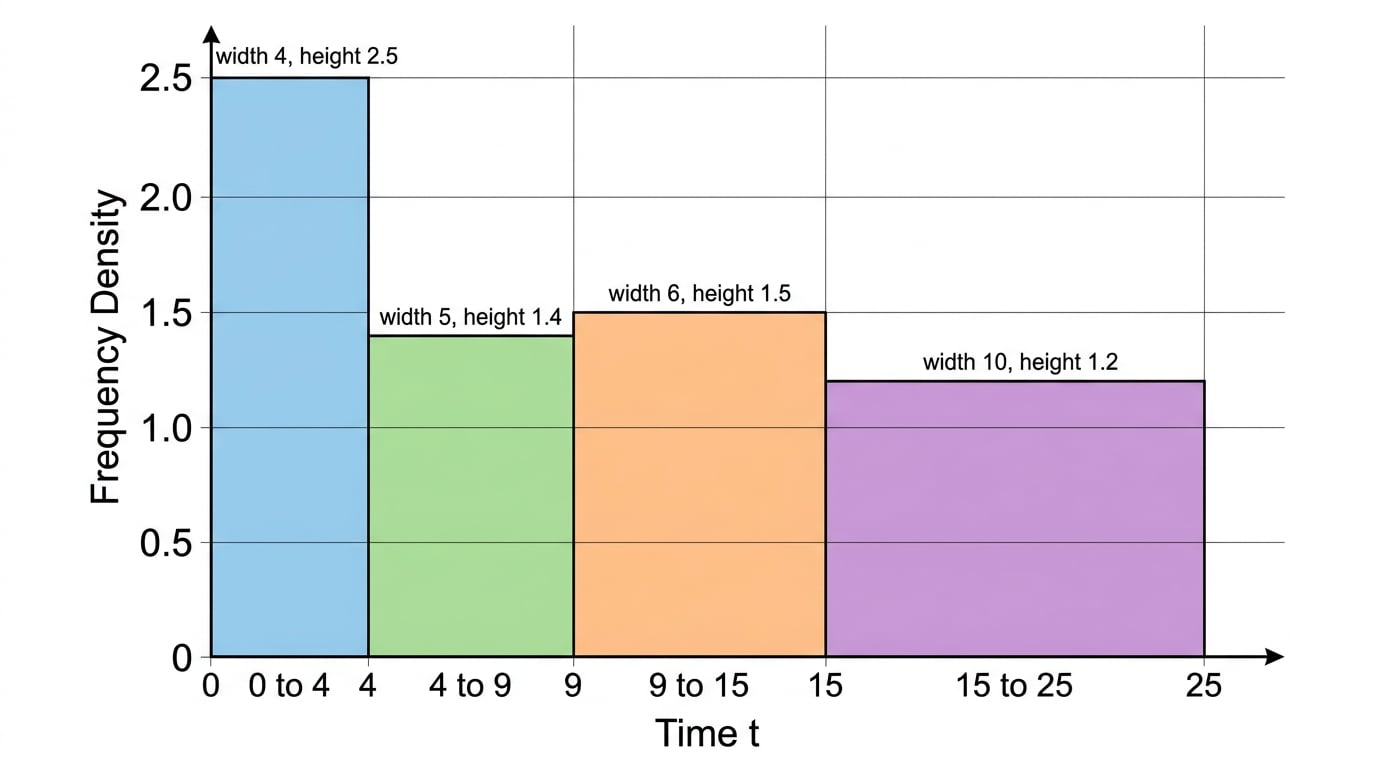 A histogram is used for grouped continuous data such as time, length, or mass. Unlike an ordinary bar chart, the class intervals can have different widths, so the width of each bar matters.
Histograms Lesson
Step-by-step lessons on Eduqas GCSE Maths Histograms. Each one builds up to exam-style questions. Build fluency with number, ratio and algebra first, since geometry, probability and statistics topics rely on them, and leave extra time nearer the exam for Higher-tier problem-solving and multi-step reasoning questions.