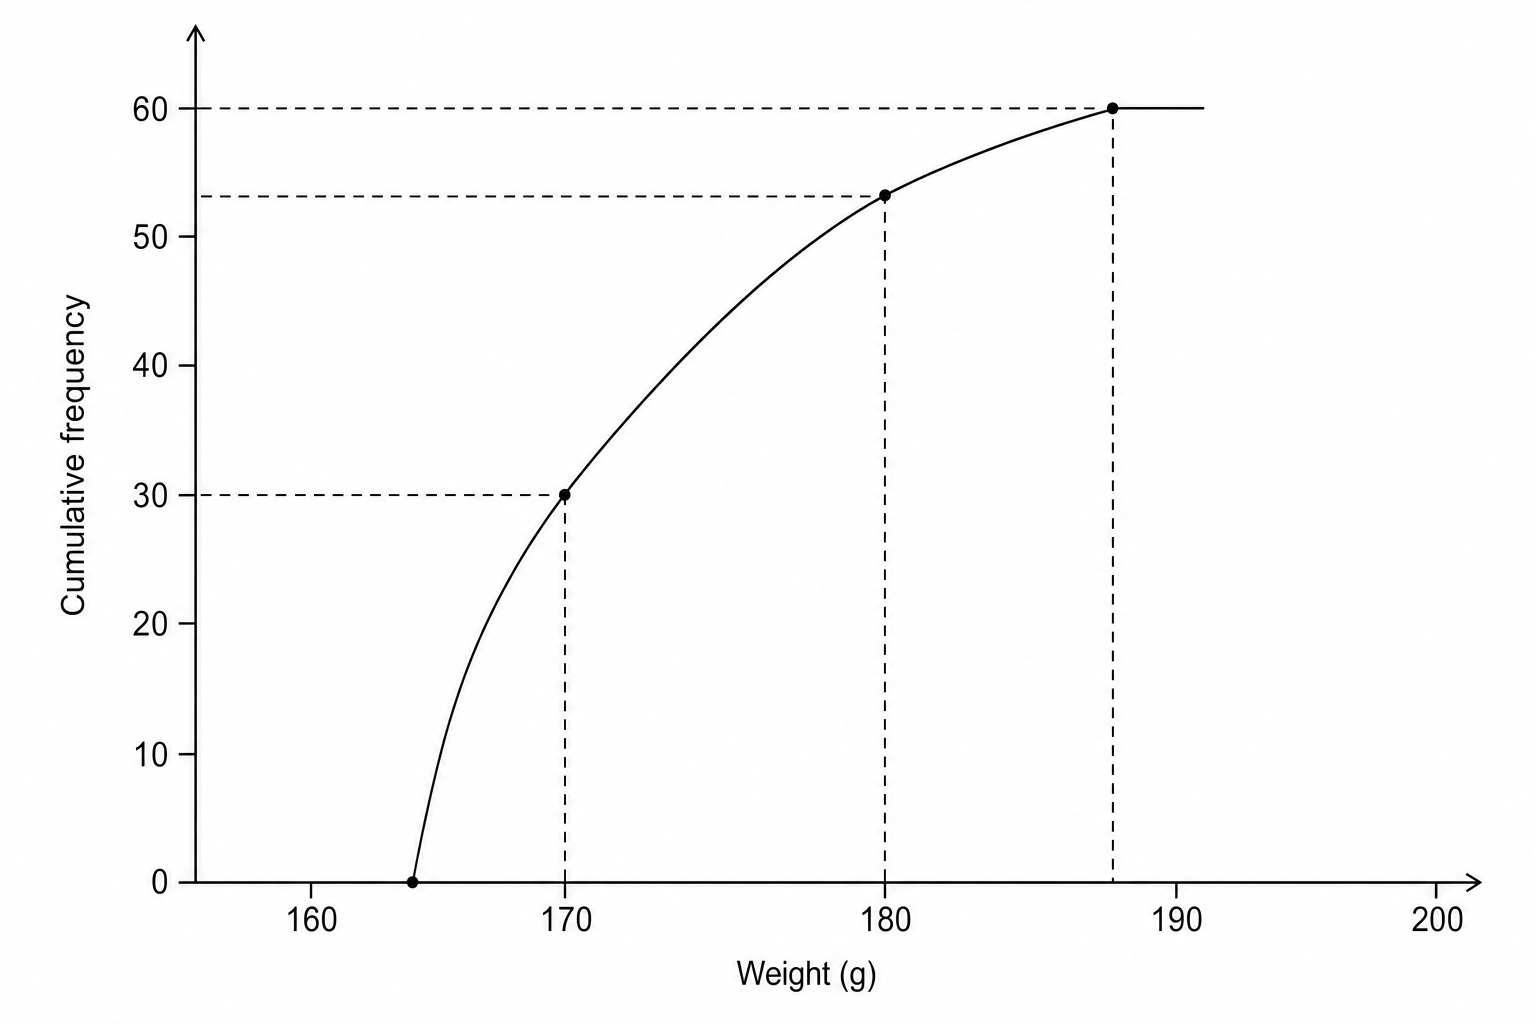
The cumulative frequency graph shows the weight, in grams, of 60 apples.
| Weight (g) | Cumulative frequency |
|---|---|
| 160 | 6 |
| 170 | 30 |
| 180 | 53 |
| 190 | 60 |
The apples had a minimum weight of 163 grams and a maximum weight of 188 grams.
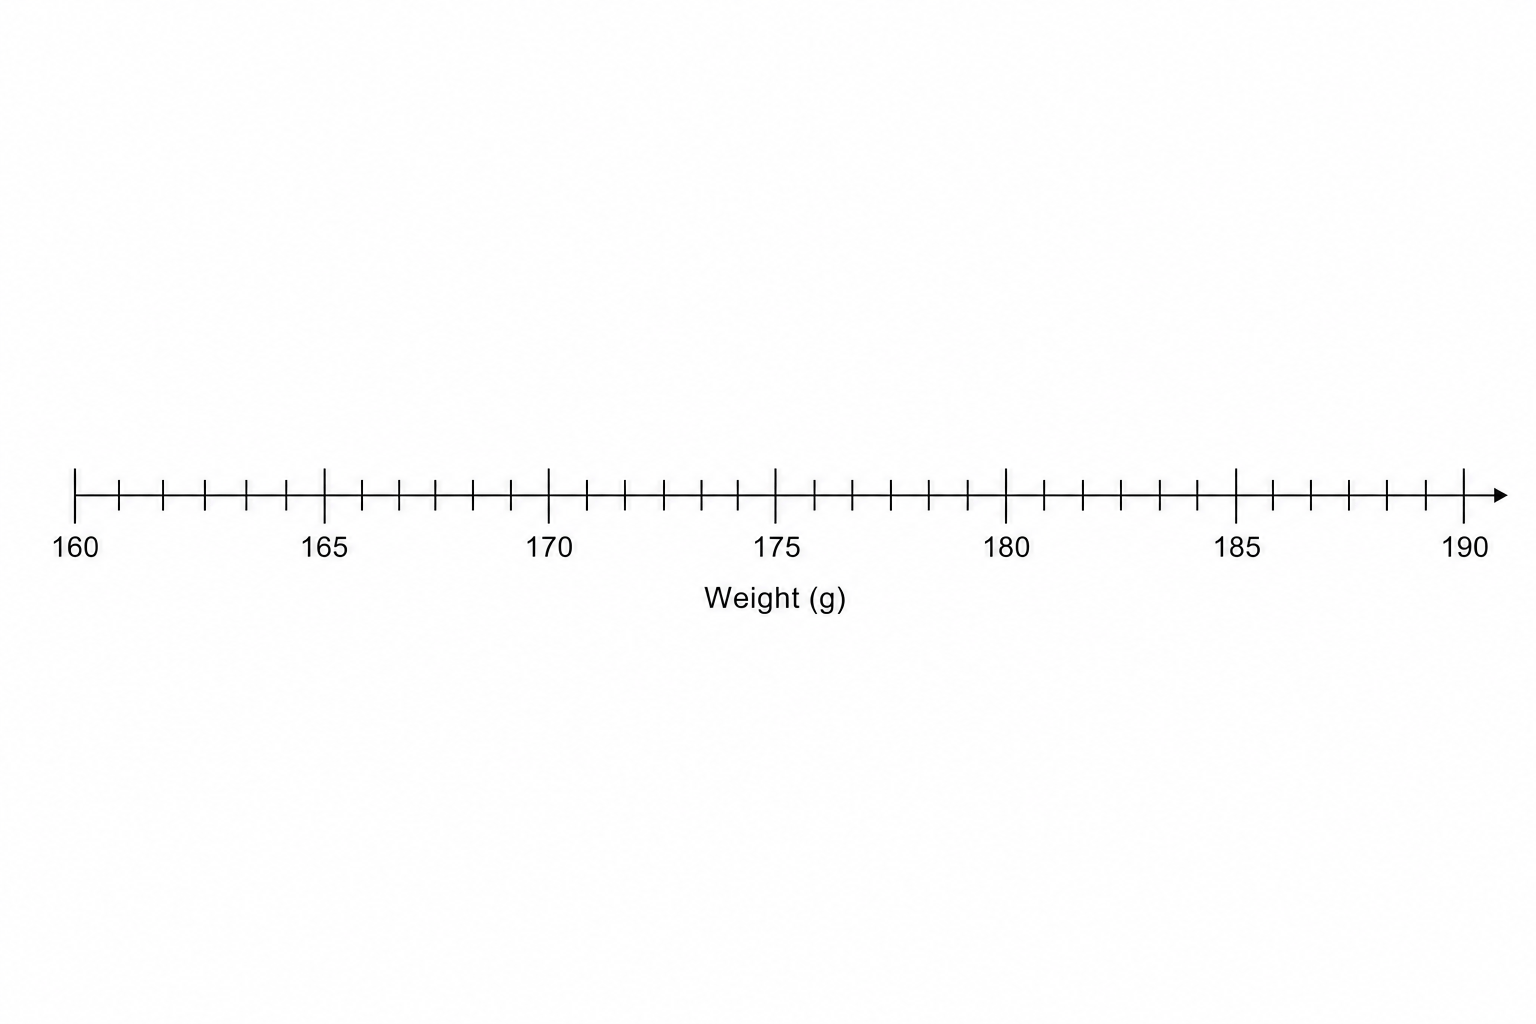
Draw a box plot to show the distribution of the weights of the apples.
Box Plots Questions
Practise Eduqas GCSE Maths Box Plots with exam-style questions for Foundation and Higher tier. 36 questions, matched to the Eduqas GCSE Maths (C300QS) specification and written in Component 1 and Component 2 style. Every question includes a full worked solution and mark scheme, so you can see where marks are awarded rather than just whether you got the answer right.