The cumulative frequency graph shows the scores of 200 participants in a logic competition.
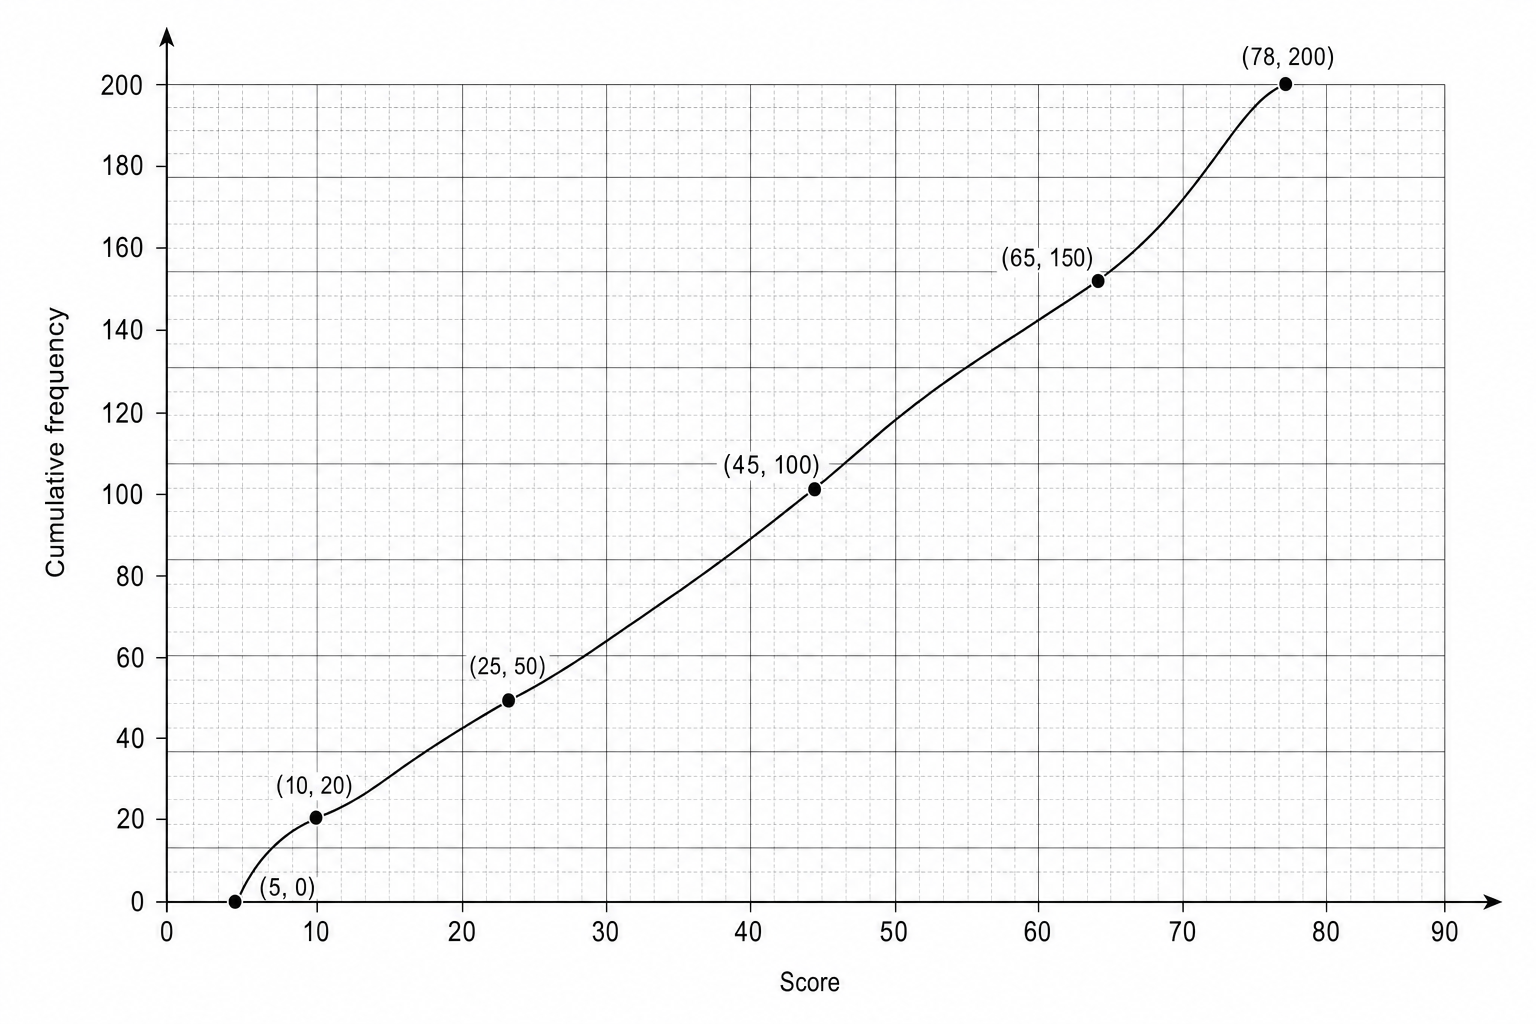
| Score | Cumulative frequency |
|---|---|
| 10 | 20 |
| 25 | 50 |
| 45 | 100 |
| 65 | 150 |
| 80 | 200 |
The participants had a minimum score of 5 and a maximum score of 78.
Draw a box plot to show the distribution of the puzzle scores.
Box Plots Questions
Practise Eduqas GCSE Maths Box Plots with exam-style questions for Foundation and Higher tier. 36 questions, matched to the Eduqas GCSE Maths (C300QS) specification and written in Component 1 and Component 2 style. Every question includes a full worked solution and mark scheme, so you can see where marks are awarded rather than just whether you got the answer right.