Pie charts show parts of a whole
Pie charts show parts of a whole
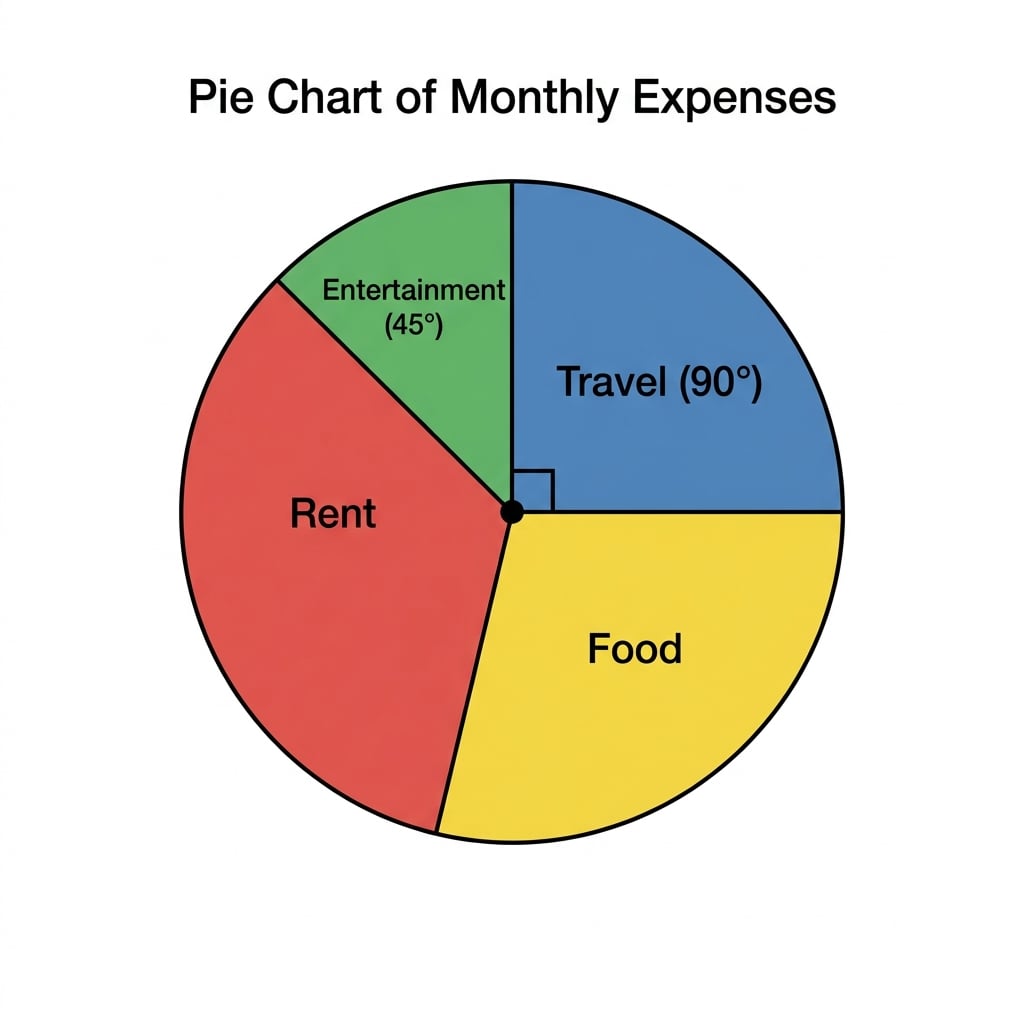
A pie chart is a circle split into sectors to show how a whole group is shared between categories. Each sector represents one category, and its size shows the frequency or amount.
Pie Charts Lesson
Step-by-step lessons on Eduqas GCSE Maths Pie Charts. Each one builds up to exam-style questions. Build fluency with number, ratio and algebra first, since geometry, probability and statistics topics rely on them, and leave extra time nearer the exam for Higher-tier problem-solving and multi-step reasoning questions.