Venn Diagrams
x

Revision notes for Edexcel GCSE Maths Venn Diagrams. Open the guide for explanations and worked examples. Written against the Edexcel GCSE Maths (1MA1) specification, so the content matches what's examinable rather than general Maths background.

Venn Diagrams

What you'll learn

  • Read the main symbols used in two-circle and three-circle diagrams.
  • Decide what to shade for “and”, “or”, and “not”.
  • Complete diagrams from survey counts.
  • Use diagrams to find probabilities.

1. The basic picture and symbols

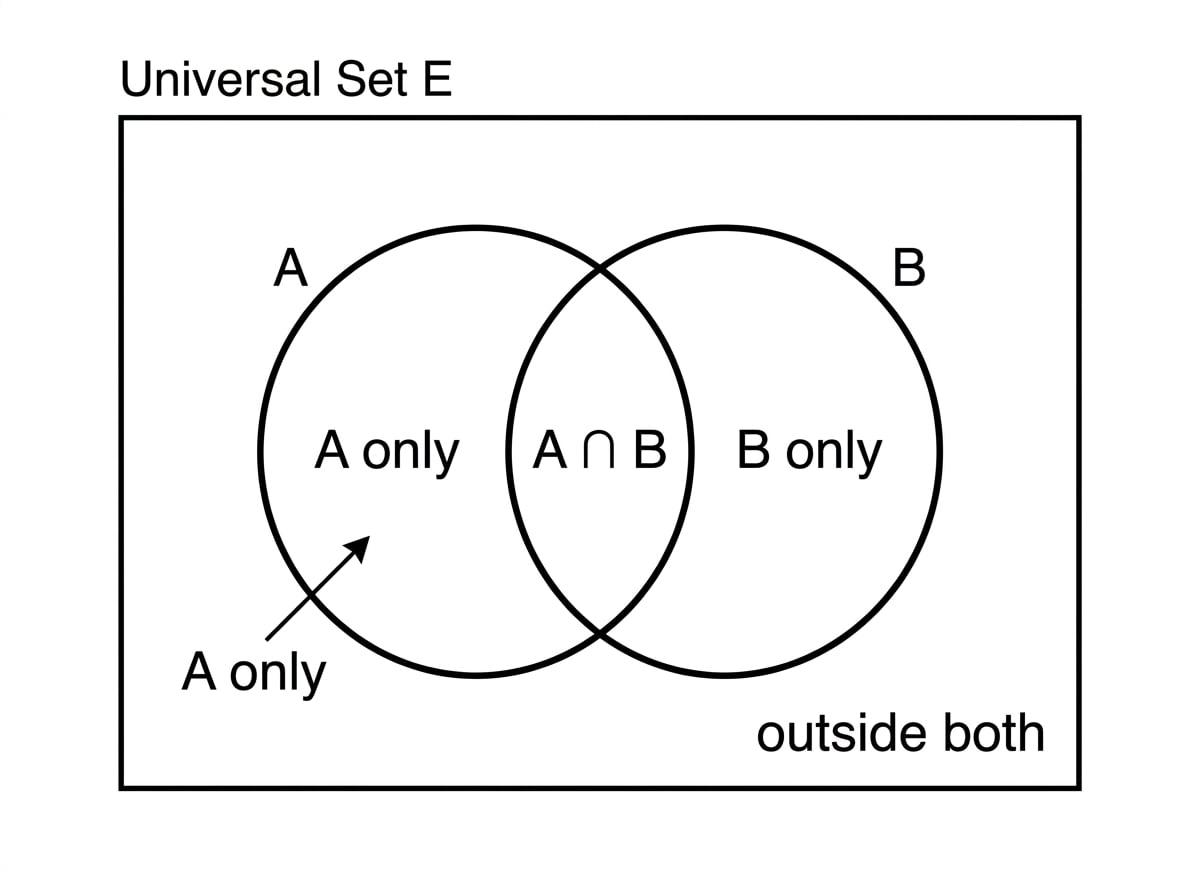
A Venn diagram shows groups inside a rectangle. Each separate part of the diagram is called a region. For example, in a two-circle diagram there is an A-only region, a B-only region, an overlap, and the outside region.

A basic two-circle Venn diagram showing the universal set rectangle and the four regions: A-only, B-only, overlap, and outside both.

Definition

Venn diagram language

  • A set is a collection of items, such as people who like tea.
  • An element or member is one item in a set.
  • The universal set, often written E\mathcal{E}E, is everything being considered. It is shown by the rectangle.
  • The complement of AAA, written A′A'A′, means everything in E\mathcal{E}E that is not in AAA.
  • The intersection A∩BA \cap BA∩B means items in both AAA and BBB.
  • The union A∪BA \cup BA∪B means items in AAA or BBB or both.

A probability is a number from 0 to 1 showing how likely something is. If something is either in AAA or not in AAA, the two probabilities add to 1.

Example

Finding a complement probability

Given P(A)=0.85P(A)=0.85P(A)=0.85, find P(A′)P(A')P(A′).

The complement A′ is everything in the universal set outside circle A, so its probability is the remaining part after P(A).

  1. Recognise that A′A'A′ means “not in AAA”.

  2. Use the complement rule:

    P(A′)=1−P(A)P(A')=1-P(A)P(A′)=1−P(A)
  3. Substitute the given value:

    P(A′)=1−0.85=0.15P(A')=1-0.85=0.15P(A′)=1−0.85=0.15
  4. The probability of not being in AAA is 0.15.

2. Shading regions

When you are asked to shade a region, translate each symbol carefully.

  • A∩BA \cap BA∩B means the overlap only.
  • A∪BA \cup BA∪B means all of circle A and all of circle B.
  • A′∩B′A' \cap B'A′∩B′ means outside both circles.
  • A∩B′A \cap B'A∩B′ means in A but not in B, so A-only.
Key Idea

And means overlap, or means join

The symbol ∩\cap∩ means “and”, so look for the common part. The symbol ∪\cup∪ means “or”, so join together all regions that fit at least one condition.

Example

Shading a mixed region

Describe the region represented by A′∪BA' \cup BA′∪B.

For A′ ∪ B, every region is included except the part that is in A only.

  1. Start with A′A'A′. This means everything not in A: the B-only region and the outside region.

  2. The union symbol ∪\cup∪ means add everything in B.

  3. Adding B includes the B-only region and the overlap.

  4. So the shaded part is everything except the A-only region.

Common Mistake

Union does not mean just the overlap

For A∪BA \cup BA∪B, do not shade only the middle. The overlap is included, but the A-only and B-only regions are included as well.

The union A ∪ B means all parts inside A or B, including both single-circle regions and the overlap.

3. Completing a two-circle Venn diagram

In survey questions, each number in a region is a frequency, meaning a count. The word neither means outside both circles, but still inside the rectangle.

Definition

Counting notation

n(A)n(A)n(A) means the number of elements in set AAA. For example, n(A∩B)n(A \cap B)n(A∩B) means the number in both AAA and BBB.

Key Idea

Fill the overlap first

If the number who are in both groups is given, put it in the overlap first. Then subtract it from each circle total to get the “only” regions.

Example

Two places visited

48 pupils were asked whether they had visited Wales or Ireland. 26 had visited Wales, 21 had visited Ireland, and 9 had visited both. Complete the Venn diagram.

The completed Wales and Ireland Venn diagram has 9 in the overlap, then 17 Wales only, 12 Ireland only, and 10 outside both.

  1. Put 9 in the overlap because 9 pupils visited both places.

  2. Wales only is 26 - 9 = 17.

  3. Ireland only is 21 - 9 = 12.

  4. The number in at least one circle is 17 + 9 + 12 = 38.

  5. The number outside both circles is 48 - 38 = 10.

Sometimes the “neither” value is given instead of the overlap. Then first find how many are in at least one circle.

Example

Finding the missing overlap

50 people were asked whether they have a dog or a cat. 31 have a dog, 27 have a cat, and 8 have neither. Find the number who have both.

The dog and cat diagram shows the given neither value outside the circles and the unknown overlap to be found.

  1. The number in at least one circle is 50 - 8 = 42.

  2. Adding the dog total and cat total gives 31 + 27 = 58. This counts the overlap twice.

  3. Subtract the true “at least one” total to find the overlap:

    n(D∩C)=58−42=16n(D \cap C)=58-42=16n(D∩C)=58−42=16
  4. So 16 people have both a dog and a cat.

Tip

Check the total

At the end, add every region, including the outside. The total should match the number of people or items in the question.

4. Three-circle Venn diagrams

With three sets, the centre is the region in all three circles. Work from the middle outwards.

The usual order is:

  1. Fill the centre.
  2. Fill the pair-only overlaps.
  3. Fill the single-only regions.
  4. Find the outside region if needed.
Common Mistake

Read pair totals carefully

A statement like “18 like rugby and football” usually includes people who also like cricket. But “rugby and football but not cricket” means the pair-only part.

Example

Three sports survey

60 students were asked about rugby, football, and cricket. 7 like all three, 18 like rugby and football, 14 like football and cricket, 16 like rugby and cricket, 30 like rugby, 34 like football, and 28 like cricket. How many like none of the three?

The completed three-circle Venn diagram shows all seven inside regions for rugby, football, and cricket, with 9 students outside all three.

  1. Put 7 in the centre because 7 students like all three.

  2. Find the pair-only regions by subtracting the centre: rugby and football only is 11, football and cricket only is 7, and rugby and cricket only is 9.

  3. Find the single-only regions: rugby only is 3, football only is 9, and cricket only is 5.

  4. Add all the regions inside the circles:

    3+9+5+11+7+9+7=513+9+5+11+7+9+7=513+9+5+11+7+9+7=51
  5. Subtract from the total:

    60−51=960-51=960−51=9
  6. So 9 students like none of the three sports.

5. Listed sets and probabilities

Sometimes you are given the universal set and the sets as lists. Place each element into exactly one region.

Definition

Probability from equally likely choices

If one element is chosen at random from E\mathcal{E}E, and each element has the same chance, the probability is the number of favourable elements divided by the number of elements in E\mathcal{E}E.

Example

Completing from listed sets

Let E={even numbers from 2 to 18}\mathcal{E}=\{\text{even numbers from 2 to 18}\}E={even numbers from 2 to 18}, A={2,4,8,12,18}A=\{2,4,8,12,18\}A={2,4,8,12,18}, and B={4,6,12,14}B=\{4,6,12,14\}B={4,6,12,14}. Find P(A∪B)P(A \cup B)P(A∪B).

Each even number from 2 to 18 is placed in exactly one region before counting the union A ∪ B.

  1. List the universal set: 2, 4, 6, 8, 10, 12, 14, 16, 18. There are 9 elements.

  2. The overlap is the numbers in both sets: 4 and 12.

  3. A-only contains 2, 8, and 18.

  4. B-only contains 6 and 14.

  5. Outside both circles are the remaining universal-set elements: 10 and 16.

  6. A∪BA \cup BA∪B contains 7 elements, so:

    P(A∪B)=79P(A \cup B)=\frac{7}{9}P(A∪B)=97​
Tip

Reading a completed diagram

For A∩BA \cap BA∩B in a three-circle diagram, include every number inside both A and B, including any number in the centre.

Exam technique

In the exam

  1. Fill the most specific information first: the overlap in two-circle diagrams, or the centre in three-circle diagrams.

  2. Watch for “but not” because it tells you a region is pair-only or single-only.

  3. For probability, count the required region carefully and use the whole universal set as the denominator.

Self review

Check yourself

  • If P(A)=0.64P(A)=0.64P(A)=0.64, what is P(A′)P(A')P(A′)?
  • Which regions would you shade for A∩B′A \cap B'A∩B′?
  • In a three-circle diagram, why do you subtract the centre from a pair total?

Recap questions

Test yourself with 5 quick questions on this guide. Answer them all correctly to complete it.

You've reached the end

Test yourself on this topic, or move on to the next guide.

Practice questionsTake a quick quiz on this topicFlashcardsSelf-test with active recall
Recurring Decimals to FractionsUp next

How was this guide?

Venn Diagrams Revision Guide

  1. GCSE
  2. /Maths
  3. /Venn Diagrams