Skip to content
MathsGenie logo
Open app

Course home

  1. GCSE
  2. Maths Edexcel
  3. Revision guides

Conversions and Units


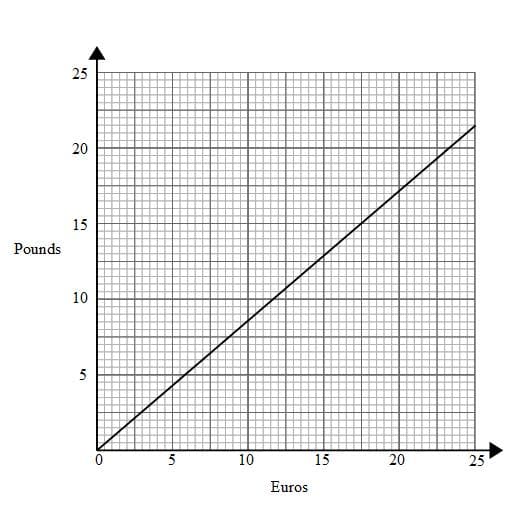
Here is a conversion graph that can be used to change between Euros and Pounds.
conversion graphs1


We can use the conversion graph to convert Euros into Pounds or Pounds into Euros.


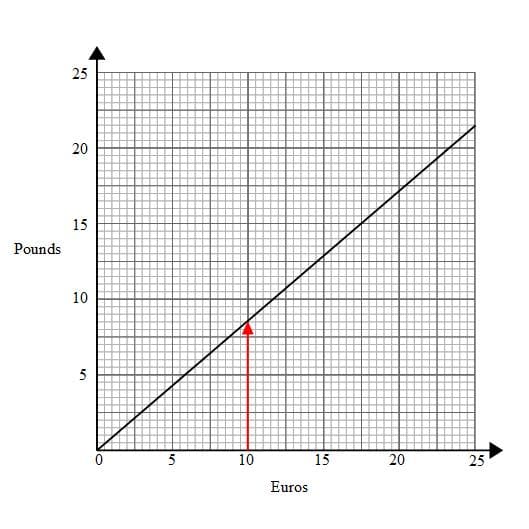
Example: Use the conversion graph to convert €10 into Pounds.

We need to draw a straight line up (vertical) from €10 to the line on the conversion graph.
conversion graphs1a

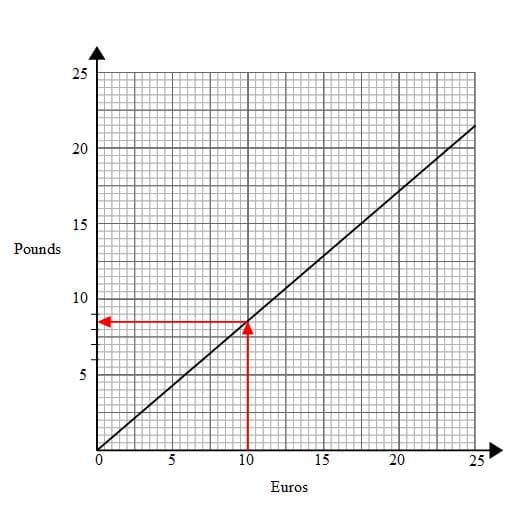
We then draw a horizontal line (across) from this point to the Pounds axis.
conversion graphs1b

We now read off the scale. Half way between £8 and £9 is £8.50

€10 = £8.50


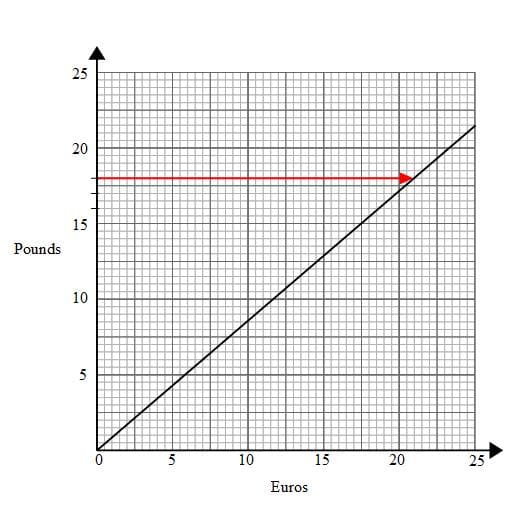
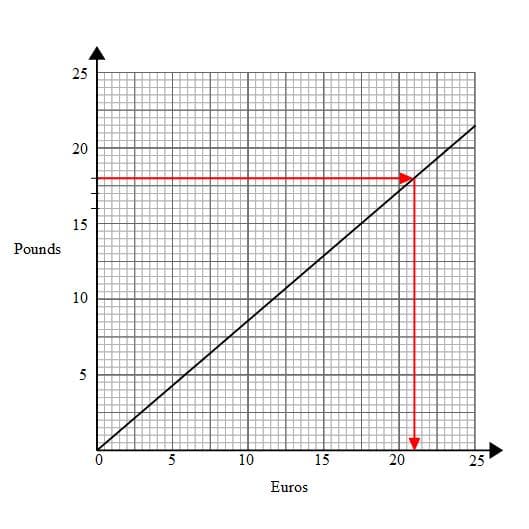
Example: Use the conversion graph to convert £18 into Euros.

We need to draw a straight line across (horizontal) from £18 to the line on the conversion graph.
conversion graphs1c

From this point we draw a vertical line down to the Euros axis
conversion graphs1d

We can now read off the Euros axis.
£18 = €21


We can also be asked to use a conversion graph to convert numbers that are off the chart

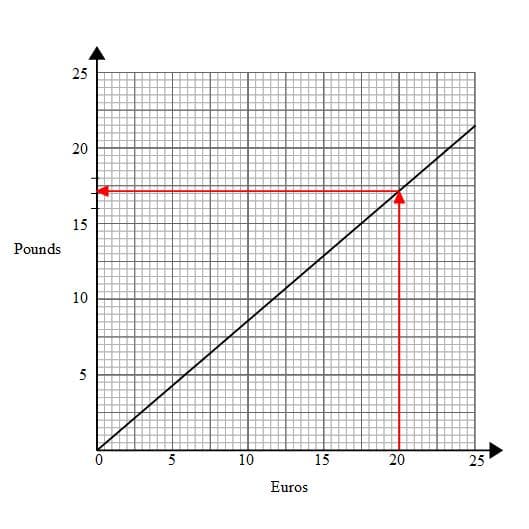
Example: Use the conversion graph to convert €80 into Pounds.

The first step would be to use the conversion graph to convert something in Euros into Pounds

If we convert €20 into pounds we could multiply the answer by 4 to get €80
conversion graphs1e

€20 is just over £17
In an exam question there will be a range of answers, anything between £17 and £17.25 should be acceptable.
I will say €20 = £17.10

We can now multiply by 4
4 × €20 = 4 × £17.10
€80 = £68.40

PreviousNext

How was this guide?

Teach Genie

Review Conversions and Units by teaching Genie

Teach it back in your own words, spot gaps, and remember it better.

Start teaching
Genie and Baby Genie

Lesson

Recap your knowledge with an interactive lesson

8 minute activity

Start lesson

A unit tells you what a measurement is counted in, such as mm, cm, m, km, litres or seconds. A conversion rewrites the same amount in a different unit, so 1 m1 \, \text{m}1m and 100 cm100 \, \text{cm}100cm describe the same length.

A conversion factor is the number you multiply or divide by to change units. Useful facts are 1 cm=10 mm1 \, \text{cm} = 10 \, \text{mm}1cm=10mm, 1 m=100 cm1 \, \text{m} = 100 \, \text{cm}1m=100cm, 1 km=1000 m1 \, \text{km} = 1000 \, \text{m}1km=1000m, and 1 hour=3600 s1 \, \text{hour} = 3600 \, \text{s}1hour=3600s.

If you change to a smaller unit, the number usually gets bigger, so you multiply. If you change to a larger unit, the number usually gets smaller, so you divide.

Questions

Put it into practice with exam-style questions

31 exam-style questions

Practice questions

Question 1

3 marks

You can use this graph to change between inches and centimetres.

InchesCentimetres (cm)
00
12.54
25.08
37.62
410.16
512.70
615.24
717.78
820.32
922.86
1025.40

Flashcards

Remember key concepts with flashcards

20 flashcards

Practice flashcards

1 cm = [     ] and 1 m = [     ].

Conversions and Units Revision Guide

  1. GCSE
  2. /Maths
  3. /Conversions and Units

Revision notes for Edexcel GCSE Maths Conversions and Units. Open the guide for explanations and worked examples. Written against the Edexcel GCSE Maths (1MA1) specification, so the content matches what's examinable rather than general Maths background.

Revision guides

Error IntervalsFractionsEstimatingWriting and Simplifying RatioRatioProportionPercentagesPercentage ChangeExchange RatesConversions and UnitsScale DrawingsBest Buy QuestionsSubstitutionSolving EquationsDrawing Linear GraphsArea and Circumference of CirclesTransformationsArea of Compound ShapesFrequency Trees

Practise questions

1 of 3

A conversion graph shows that €10 is equal to £8.50. Using the same graph, approximately how many pounds is €30?

Practise questions

1 of 2

The conversion graph gives €20 as approximately £17.10. Using this conversion, approximately how many pounds is €100?