Skip to content
MathsGenie logo
Open app

Course home

  1. GCSE
  2. Maths CCEA
  3. Revision guides

Histograms

What you'll learn

  • Why frequency, meaning how many data values are in a group, is shown by bar area.
  • How to calculate frequency density, the height of a histogram bar.
  • How to complete missing frequencies, densities and bars.
  • How to estimate a frequency from part of a bar.

1. Class intervals and class widths

Histograms are used when numerical data has been grouped into ranges. This is common for measurement data, such as time, length or mass, where values can be decimals.

The class interval 0≤t<50 \le t < 50≤t<5 means values from 0 up to, but not including, 5. A value of exactly 5 would go into the next class.

Definition

Key histogram words

  • A histogram is a graph for grouped continuous data where bar area represents frequency.

  • Continuous data is measurement data that can take any value in a range, such as 3.7 hours.

  • The frequency is how many values are in a group.

  • A class interval is one group, such as 10≤t<1510 \le t < 1510≤t<15.

  • The class width is the length of the interval: upper boundary minus lower boundary.

Example

Finding class widths

A survey records time ttt in hours using the groups 0≤t<30 \le t < 30≤t<3, 3≤t<83 \le t < 83≤t<8, 8≤t<148 \le t < 148≤t<14 and 14≤t<2414 \le t < 2414≤t<24. Find the class widths.

The class widths are the horizontal distances between consecutive class boundaries on the time axis.

  1. The class width is found by subtracting the lower boundary from the upper boundary.

  2. Calculate each width:

    0≤t<3:3−0=33≤t<8:8−3=58≤t<14:14−8=614≤t<24:24−14=10\begin{aligned} 0 \le t < 3 &: 3-0=3\\ 3 \le t < 8 &: 8-3=5\\ 8 \le t < 14 &: 14-8=6\\ 14 \le t < 24 &: 24-14=10 \end{aligned}0≤t<33≤t<88≤t<1414≤t<24​:3−0=3:8−3=5:14−8=6:24−14=10​
  3. The class widths are 3 hours, 5 hours, 6 hours and 10 hours.

Key Idea

Width matters

In a histogram, the horizontal width of each bar is part of the calculation, not just decoration.

2. Frequency density is the bar height

In a bar chart, the height usually shows the frequency. In a histogram, that is not usually true.

The vertical axis is normally labelled frequency density, often shortened to f.d. This is the height of the bar.

Definition

Frequency density

Frequency density is frequency per unit of class width.

frequency density=frequencyclass width\text{frequency density}=\frac{\text{frequency}}{\text{class width}}frequency density=class widthfrequency​
Example

Finding the height of a histogram bar

In one class interval, 2≤t<82 \le t < 82≤t<8, the frequency is 18. Find the frequency density.

For a histogram bar, the frequency density is the height found by dividing frequency by class width.

  1. Find the class width. From 2 to 8 is a width of 6.

  2. Divide the frequency by the class width:

    frequency density=186=3\text{frequency density}=\frac{18}{6}=3frequency density=618​=3
  3. The histogram bar should have height 3 on the frequency density axis.

Common Mistake

Using frequency as the height

Do not draw a bar of height 18 just because the frequency is 18. First divide by the class width to get the frequency density.

3. Frequency is the area of the bar

A histogram bar is a rectangle. The area of a rectangle is its width times its height.

In a histogram:

frequency=class width×frequency density\text{frequency}=\text{class width}\times\text{frequency density}frequency=class width×frequency density
Key Idea

Area gives frequency

In histograms, frequency is shown by the area of the bar, not just by the height.

Example

Finding frequency from a bar

On a histogram of waiting times, the bar for 8≤t<168 \le t < 168≤t<16 has frequency density 1.75. Find the frequency.

The frequency is represented by the area of the rectangle, so multiply width by height.

  1. Find the class width. From 8 to 16 is a width of 8.

  2. Multiply the width by the frequency density:

    frequency=8×1.75=14\text{frequency}=8 \times 1.75=14frequency=8×1.75=14
  3. The frequency is 14.

4. Completing missing values and drawing bars

Many exam questions give you a partially completed histogram or table. Use whichever formula fits the missing value:

  • To find frequency density, divide frequency by class width.
  • To find frequency, multiply class width by frequency density.
Example

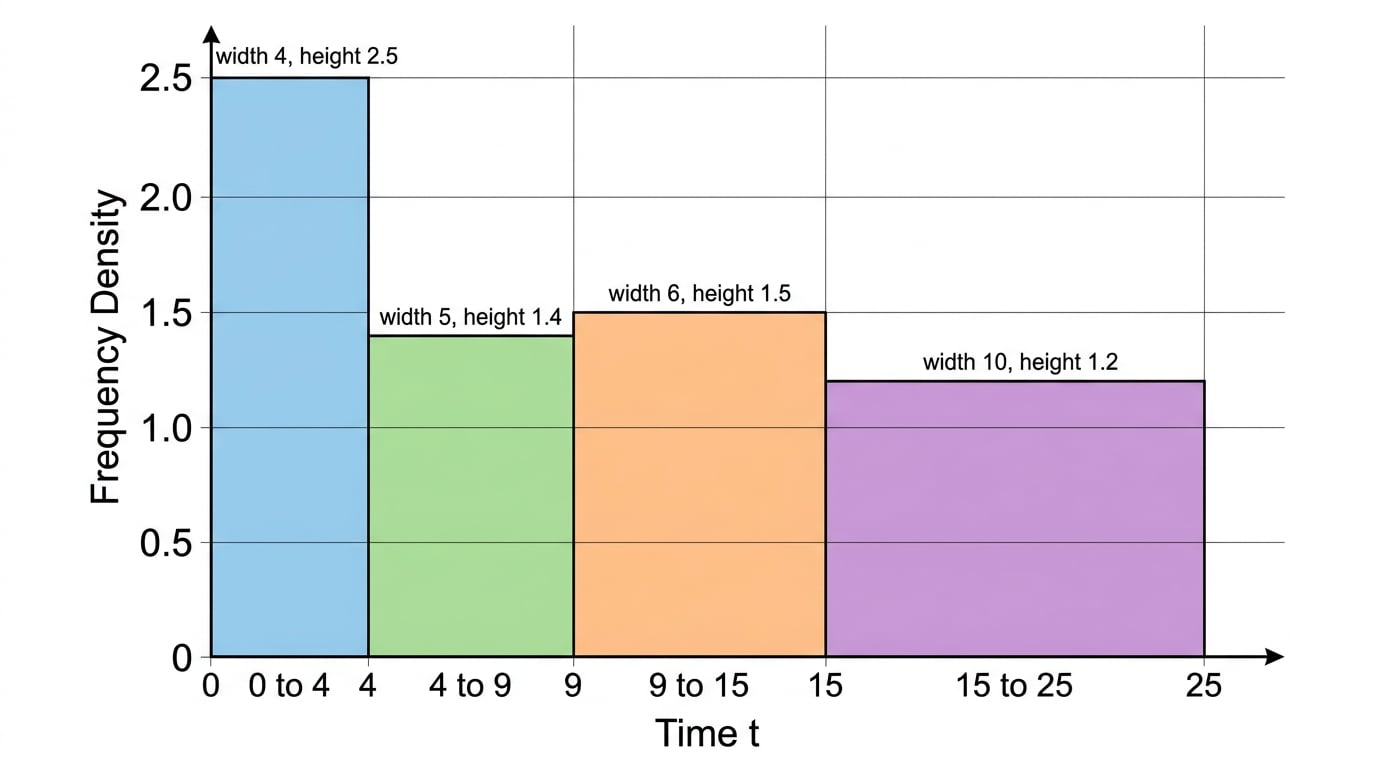
Completing a histogram-style table

A histogram records time ttt in hours. The information is:

  • 0≤t<40 \le t < 40≤t<4: frequency 10

  • 4≤t<94 \le t < 94≤t<9: frequency density 1.4

  • 9≤t<159 \le t < 159≤t<15: frequency density 1.5

  • 15≤t<2515 \le t < 2515≤t<25: frequency 12

Complete the missing values and describe how to draw the bars.

The completed histogram uses touching bars with different widths and heights equal to frequency density.

  1. Find all the class widths:

    0≤t<4:44≤t<9:59≤t<15:615≤t<25:10\begin{aligned} 0 \le t < 4 &: 4\\ 4 \le t < 9 &: 5\\ 9 \le t < 15 &: 6\\ 15 \le t < 25 &: 10 \end{aligned}0≤t<44≤t<99≤t<1515≤t<25​:4:5:6:10​
  2. For rows where the frequency is known, divide by the width:

    f.d. for 0≤t<4=104=2.5f.d. for 15≤t<25=1210=1.2\begin{aligned} \text{f.d. for }0 \le t < 4 &= \frac{10}{4}=2.5\\ \text{f.d. for }15 \le t < 25 &= \frac{12}{10}=1.2 \end{aligned}f.d. for 0≤t<4f.d. for 15≤t<25​=410​=2.5=1012​=1.2​
  3. For rows where the frequency density is known, multiply by the width:

    frequency for 4≤t<9=5×1.4=7frequency for 9≤t<15=6×1.5=9\begin{aligned} \text{frequency for }4 \le t < 9 &= 5 \times 1.4=7\\ \text{frequency for }9 \le t < 15 &= 6 \times 1.5=9 \end{aligned}frequency for 4≤t<9frequency for 9≤t<15​=5×1.4=7=6×1.5=9​
  4. The completed values are:

    • 0≤t<40 \le t < 40≤t<4: frequency 10, frequency density 2.5.

    • 4≤t<94 \le t < 94≤t<9: frequency 7, frequency density 1.4.

    • 9≤t<159 \le t < 159≤t<15: frequency 9, frequency density 1.5.

    • 15≤t<2515 \le t < 2515≤t<25: frequency 12, frequency density 1.2.

  5. To draw the histogram, draw touching rectangles over the correct intervals, with heights 2.5, 1.4, 1.5 and 1.2.

Common Mistake

Drawing equal-width bars

Do not draw every bar the same width. A class from 15 to 25 must be wider than a class from 4 to 9.

Histogram bars must use the actual class widths, so wider intervals take up more horizontal space.

5. Estimating part of a bar

Sometimes you need only part of a class interval, such as estimating how many values are between 12 and 18 when the bar covers 10 to 20.

Definition

Estimate

An estimate is an approximate answer. When using part of a histogram bar, you assume the data is evenly spread within that class interval.

Example

Estimating from part of a histogram bar

A bar covers 10≤t<2010 \le t < 2010≤t<20 and has frequency density 2.5. Estimate the frequency for 12≤t<1812 \le t < 1812≤t<18.

The part from 12 to 18 is estimated using the area of that slice of the original bar.

  1. The smaller interval from 12 to 18 has width 6.

  2. This interval is inside the same bar, so use the same frequency density, 2.5.

  3. Multiply width by frequency density:

    frequency=6×2.5=15\text{frequency}=6 \times 2.5=15frequency=6×2.5=15
  4. The estimated frequency is 15.

Common Mistake

Only an estimate

Partial-bar answers assume the data is evenly spread inside the class. Real data may not be, so these answers are estimates.

Exam technique

In the exam

  1. Read the vertical axis carefully: if it says frequency density, height is not frequency.

  2. Write the class width beside every interval before calculating.

  3. Use area: frequency=width×frequency density\text{frequency}=\text{width}\times\text{frequency density}frequency=width×frequency density.

  4. When drawing, make bars touch and give each bar the correct horizontal width.

Self review

Check yourself

  • Can you explain why a histogram bar with height 2 and width 10 has frequency 20?

  • If a class interval is 7≤t<157 \le t < 157≤t<15, what is its class width?

  • When would you divide frequency by class width, and when would you multiply?

Recap questions

1 of 5

A histogram uses the class interval 7≤t<157 \le t < 157≤t<15. What is the class width?

How was this guide?

Teach Genie

Review Histograms by teaching Genie

Teach it back in your own words, spot gaps, and remember it better.

Start teaching
Genie and Baby Genie

Lesson

Recap your knowledge with an interactive lesson

7 minute activity

Start lesson

Histogram with four touching bars of unequal widths over 0 to 4, 4 to 9, 9 to 15 and 15 to 25, with frequency density heights labelled A histogram is used for grouped continuous data such as time, length, or mass. Unlike an ordinary bar chart, the class intervals can have different widths, so the width of each bar matters.

In a histogram, frequency is shown by the area of a bar, not by height alone. That is why the vertical axis is usually frequency density rather than frequency.

The bars touch because the intervals join up with no gaps. For example, 0≤t<50 \le t < 50≤t<5 includes 0 up to but not including 5, so a value of exactly 5 goes in the next class.

Flashcards

Remember key concepts with flashcards

22 flashcards

Practice flashcards

In a histogram, what does the area of a bar represent?

Histograms Revision Guide

  1. GCSE
  2. /Maths
  3. /Histograms