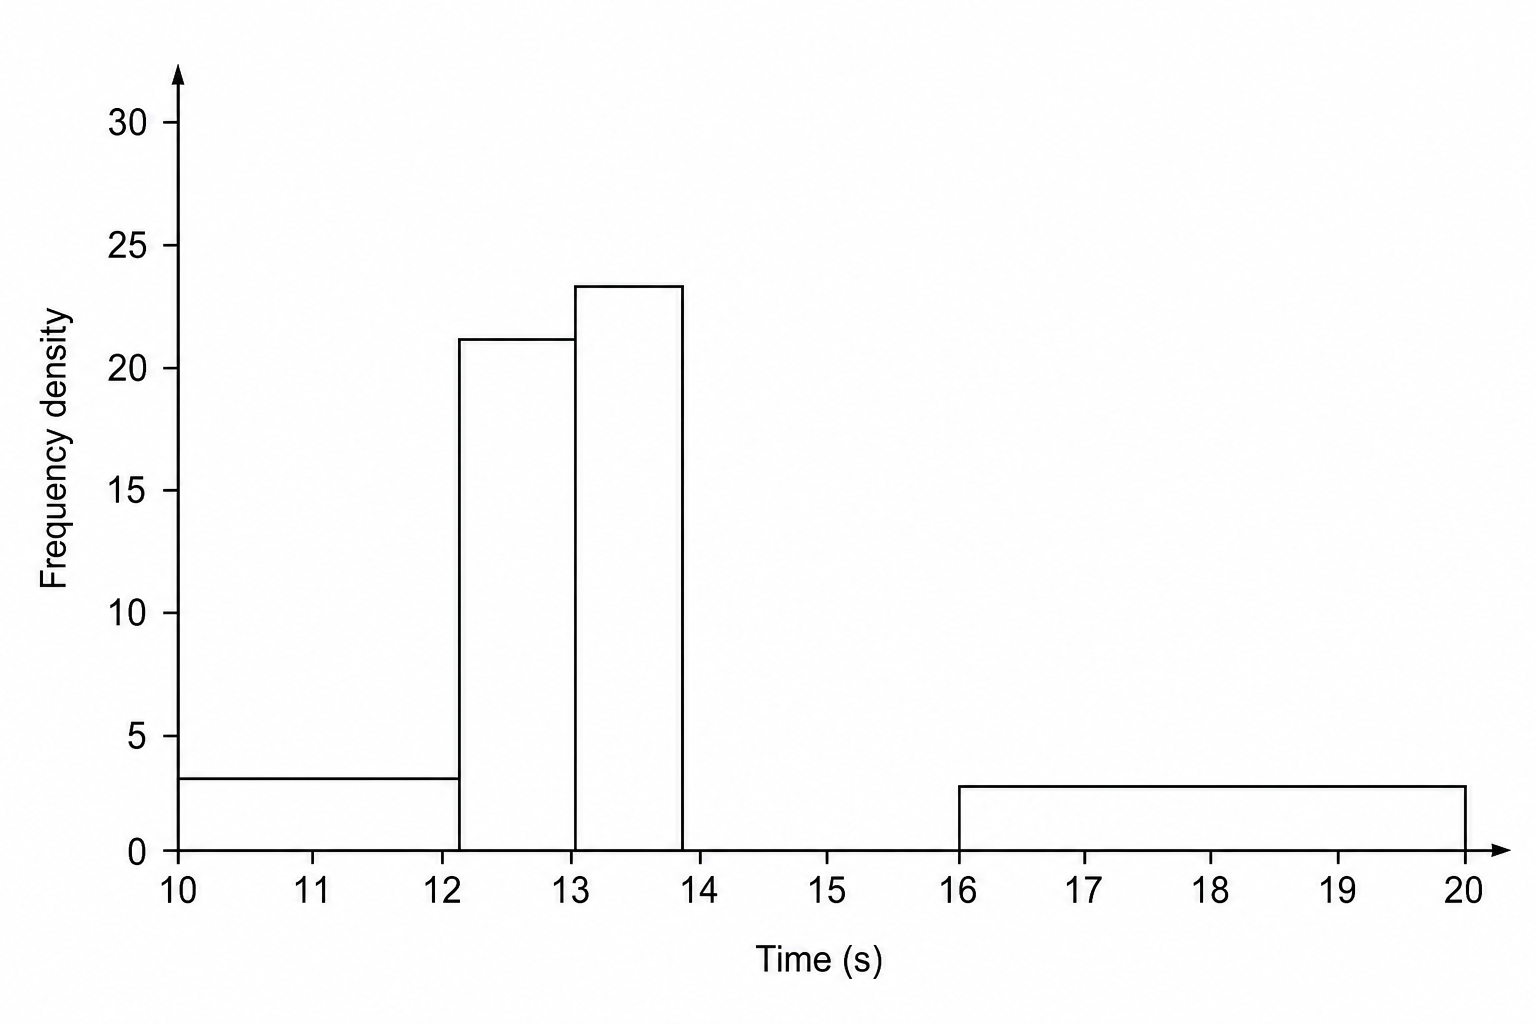
The table shows information about the time, in seconds, taken for some people to run a 100m race.
| Time (s) | Frequency |
|---|---|
| 10<t≤1210 < t \leq 1210<t≤12 | 6 |
| 12<t≤1312 < t \leq 1312<t≤13 | 21 |
| 13<t≤1413 < t \leq 1413<t≤14 | 23 |
| 14<t≤1614 < t \leq 1614<t≤16 | |
| 16<t≤2016 < t \leq 2016<t≤20 | 8 |
a.[2]
Use the information on the table to complete the histogram.
b.[2]
Use the histogram to complete the table.
Histograms Questions
Practise AQA GCSE Maths Histograms with exam-style questions for Foundation and Higher tier. 28 questions, matched to the AQA GCSE Maths (8300) specification and written in Paper 1, Paper 2 and Paper 3 style. Every question includes a full worked solution and mark scheme, so you can see where marks are awarded rather than just whether you got the answer right.