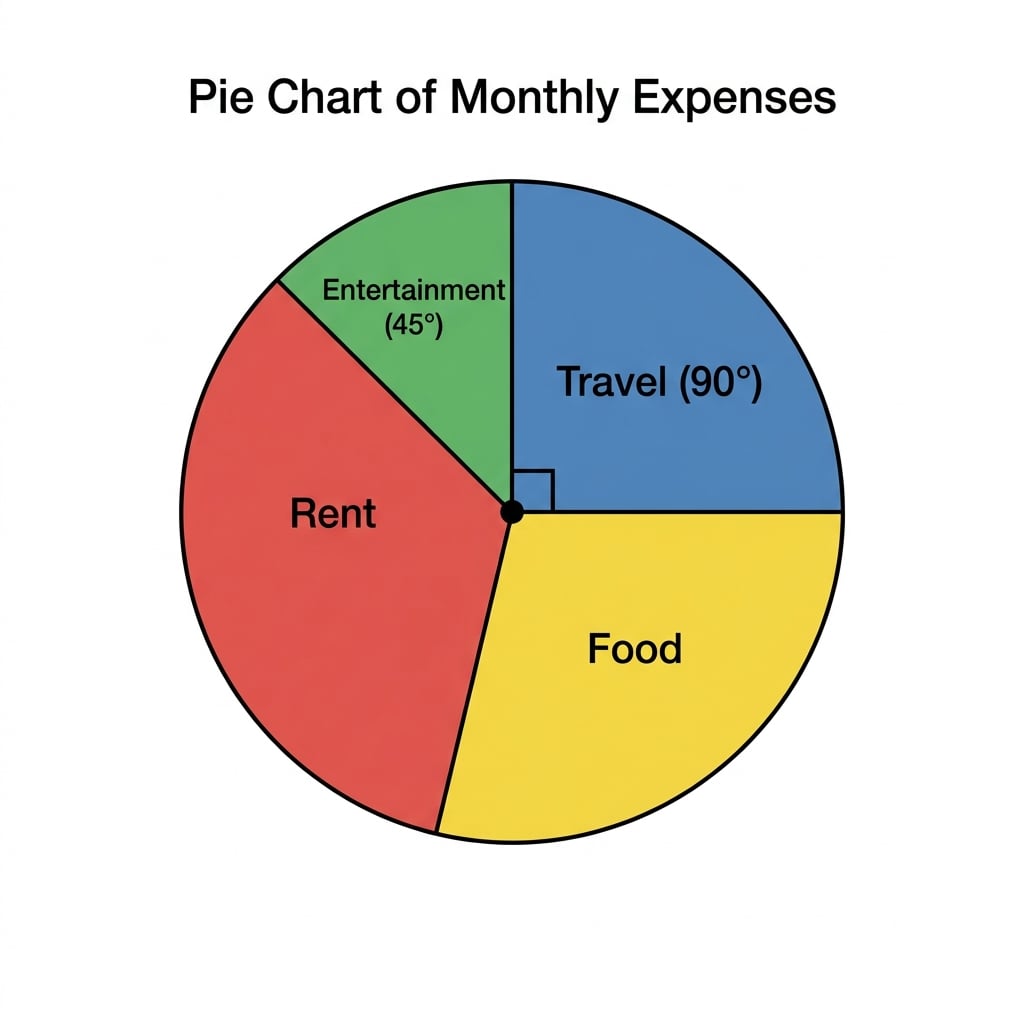
A pie chart is a way to display data. A circle is split up to show the proportion of each different group.
Here is a pie chart showing how some students traveled to school:
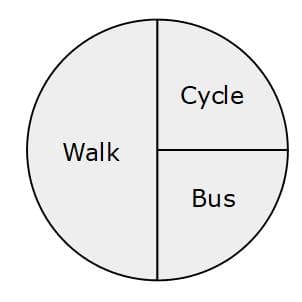
We can see from the pie chart the half of the students walked to school, one quarter cycled and one quarter got the bus.
The pie chart does not tell us how many students are in each group, just the proportion.
Drawing Pie Charts
There are 360° in a circle. To draw a pie chart we split up the 360° between the different groups, how many degrees each group gets depends on the size of the group.
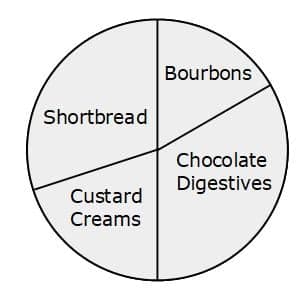
Example 1: Here is a frequency table showing the favourite biscuit of some students
| Biscuit | Frequency | |
|
| | Bourbons | 5 | | Chocolate Digestives | 10 | | Custard Creams | 6 | | Shortbread | 9 |
Draw an accurate pie chart for this information
5 + 10 + 6 + 9 = 30
There are 30 students in total.
There are 360° which need to be shared out between the 30 students
360° ÷ 30 = 12°
Each student is worth 12° on the pie chart.
Bourbons will have an angle of 5 × 12° = 60°
Chocolate Digestives will have an angle of 10 × 12° = 120°
Custard Creams will have an angle of 6 × 12° = 72°
Shortbread will have an angle of 9 × 12° = 108°
We can check that all the angles add up to 360° before drawing the pie chart:
60 + 120 + 72 + 108 = 360
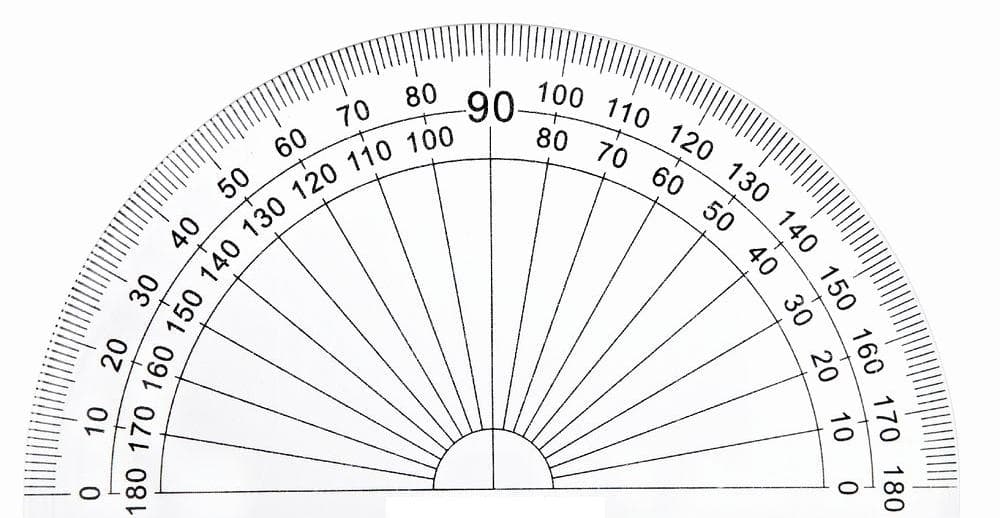
We can now start to draw the pie chart, to measure the angles we use a protractor:
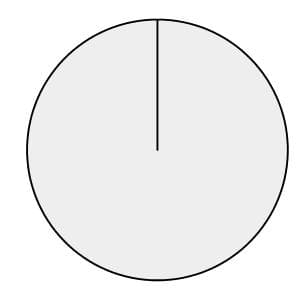
We start with a circle with a radius drawn (a line from the centre of the circle to the circumference of the circle)
From this line we measure the first angle, we place the protractor at the centre of the circle lining up 0° with the radius we have drawn. We we measure around 60° from here and draw a line.
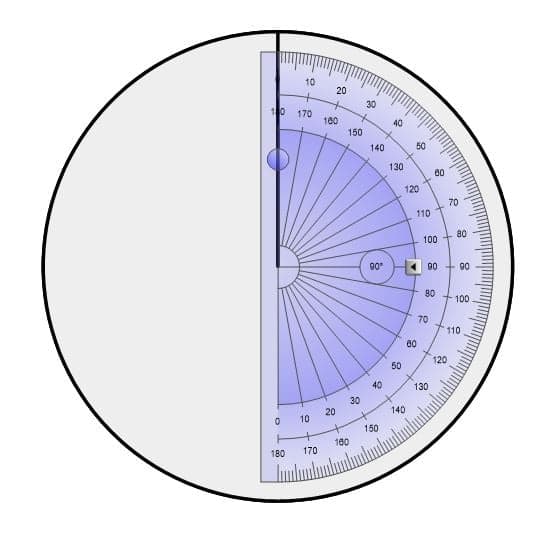
We label this first sector Bourbons.
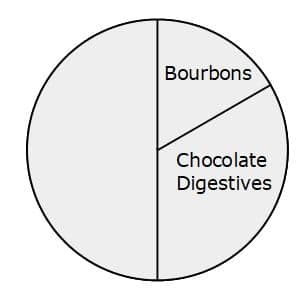
To measure the next angle we rotate the protractor to line up 0° with the line we have just drawn. We measure 120° and draw a line.
We label this sector Chocolate Digestives.
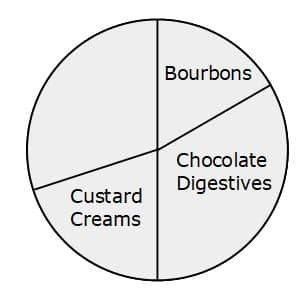
We rotate the protractor again, lining 0° up with the line we have just drawn and measure the next angle of 72°. We label this sector Custard Creams.
We can check that the angle left is equal to 108° for the final sector. We label the final sector Shortbread and the Pie Chart is complete.
Try this: