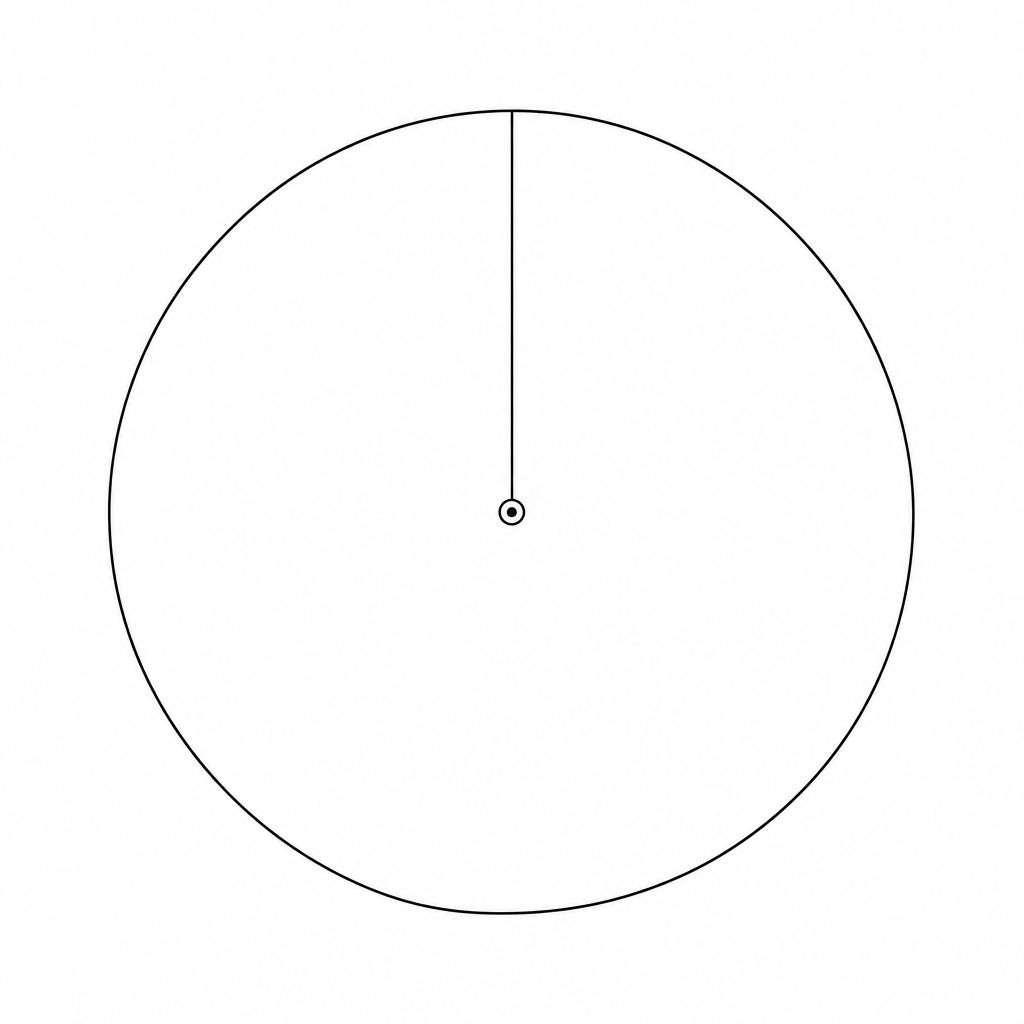
The table shows some information about the favourite television channel of some people.
| Colour | Frequency | Angle of Sector |
|---|---|---|
| BBC 1 | 90∘90^\circ90∘ | |
| BBC 2 | 144 | |
| ITV | ||
| Channel 4 | 228 | |
| Total | 720 |
Draw an accurate pie chart to show this information.
Pie Charts Questions
Practise AQA GCSE Maths Pie Charts with exam-style questions for Foundation and Higher tier. 32 questions, matched to the AQA GCSE Maths (8300) specification and written in Paper 1, Paper 2 and Paper 3 style. Every question includes a full worked solution and mark scheme, so you can see where marks are awarded rather than just whether you got the answer right.