Skip to content

Course home

Frequency Polygons

Frequency Polygons


A frequency polygon is used to display grouped data

To draw a frequency polygon we plot the midpoint of the group against the frequency and then join the points with straight lines


Here is a frequency table showing the time, in minutes, it took for 25 students to get to school one day

TimeFrequency
0 ≤ t ≤ 107
10 ≤ t ≤ 209
20 ≤ t ≤ 306
30 ≤ t ≤ 403

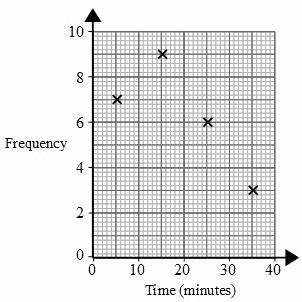
To draw a frequency polygon we plot the midpoint with each group against the frequency

The midpoint of 0 and 10 is 5
We could work this out by adding 0 and 10, and then dividing by 2: (0 + 10)⁄2 = 5

For the first point we plot (5, 7)
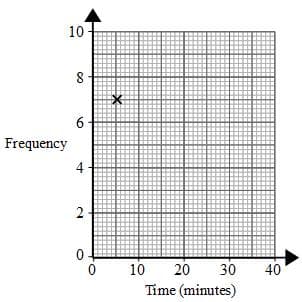
frequency polygon 2


The midpoint of 10 and 20 is 15
(10 + 20)⁄2 = 15

The second point is (15,9)
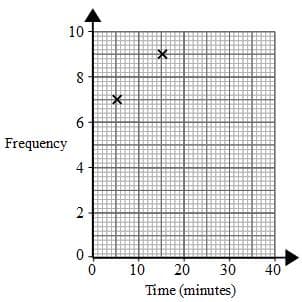
frequency polygon 3


The midpoint of 20 and 30 is 25
(20 + 30)⁄2 = 25

The next point is (25,6)
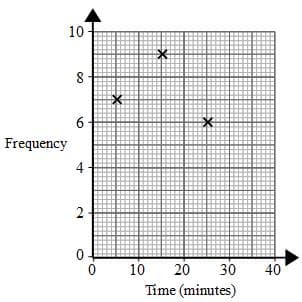
frequency polygon 4


The midpoint of 30 and 40 is 35
(30 + 40)⁄2 = 35

The next point is (35,3)
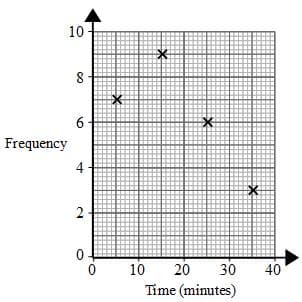
frequency polygon 5


And finally we join the points with straight lines
frequency polygon

PreviousNext

How was this guide?

Teach Genie

Review Frequency Polygons by teaching Genie

Teach it back in your own words, spot gaps, and remember it better.

Start teaching
Genie and Baby Genie

Questions

Put it into practice with exam-style questions

28 exam-style questions

Practice questions

Question 1

2 marks

The table below gives information about the time taken for 20 people to run 5 km.

Time (minutes)Frequency
15<t≤2015 < t \leq 2015<t≤203
20<t≤2520 < t \leq 2520<t≤256
25<t≤3025 < t \leq 3025<t≤307
30<t≤3530 < t \leq 3530<t≤354

Flashcards

Remember key concepts with flashcards

25 flashcards

Practice flashcards

What does frequency represent in a grouped data table?

Frequency Polygons Revision Guide

  1. GCSE
  2. /Maths
  3. /Frequency Polygons

Revision notes for AQA GCSE Maths Frequency Polygons. Open the guide for explanations and worked examples. Written against the AQA GCSE Maths (8300) specification, so the content matches what's examinable rather than general Maths background.

Practise questions

1 of 2

A group is 40≤t≤5040 \leq t \leq 5040≤t≤50 with frequency 888. What point should be plotted?

Practise questions

1 of 2

What is the midpoint of the group 20≤t≤3020 \leq t \leq 3020≤t≤30?

Practise questions

1 of 2

Once all the midpoint-frequency points have been plotted, what should you do?
