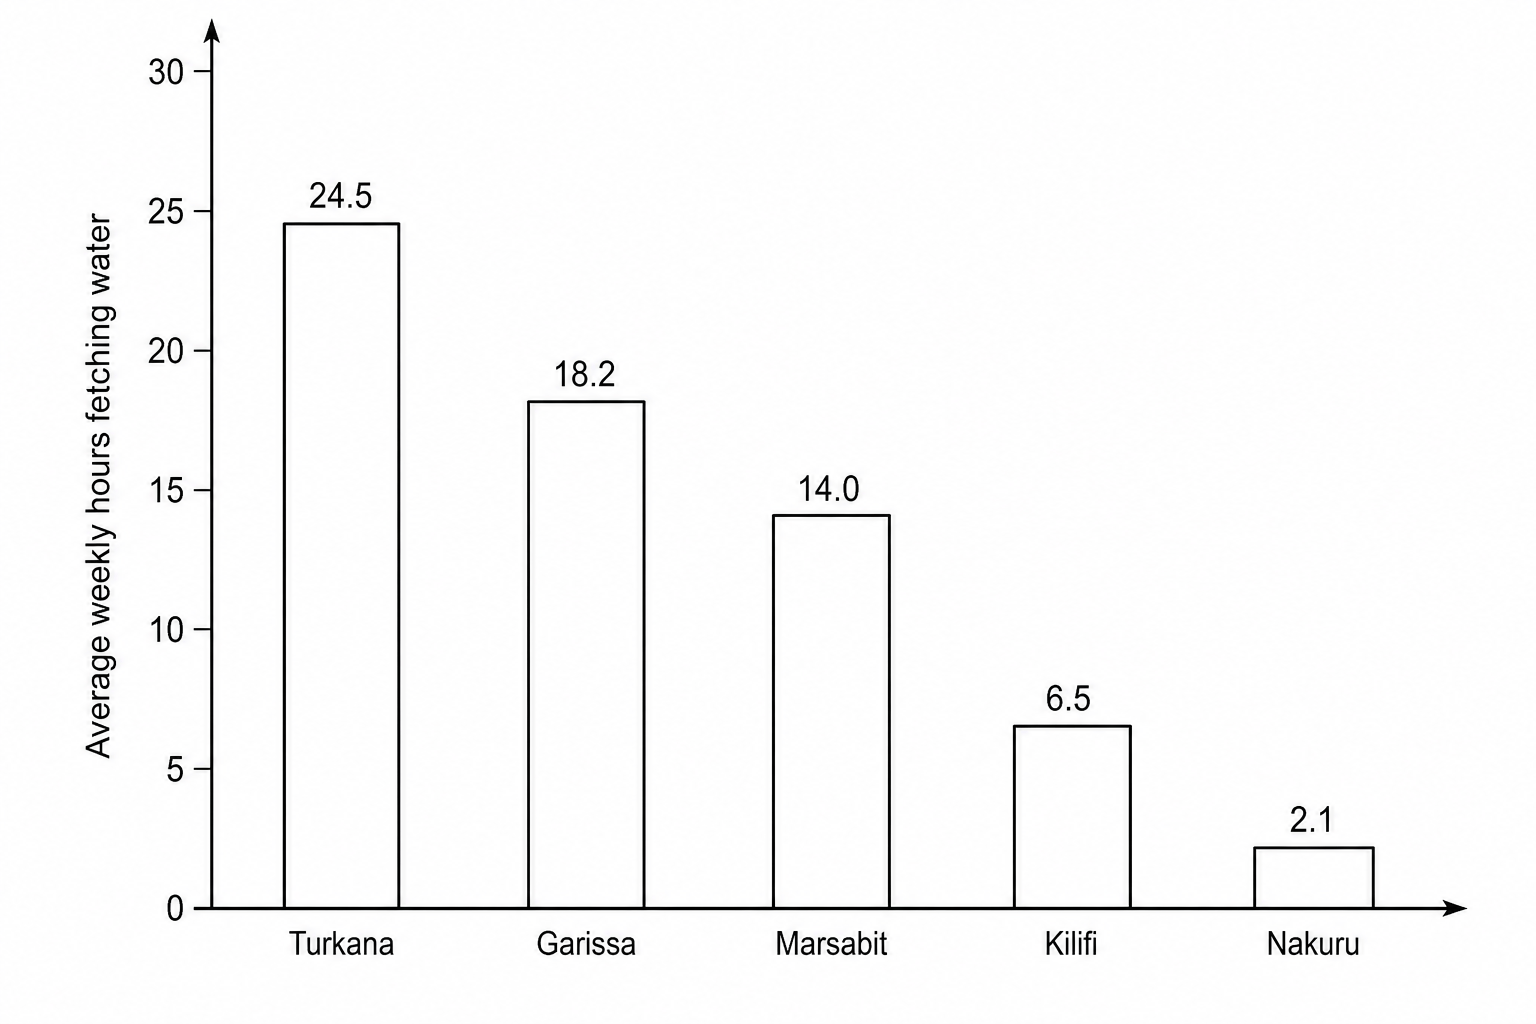
Study Figure 11, a bar chart showing the average weekly hours spent by households fetching water in selected districts of Kenya in 2023.
Using Figure 11, suggest how the time spent fetching water may influence human well-being.