Skip to content
MathsGenie logo
Open app

Course home

  1. GCSE
  2. Geography AQA
  3. Question bank

Water

EasyMediumHard
123456789101112131415161718192021222324252627282930
Question 23

Study Figure 1, a map showing the percent of the population with access to safely managed drinking water in Africa in 2022.
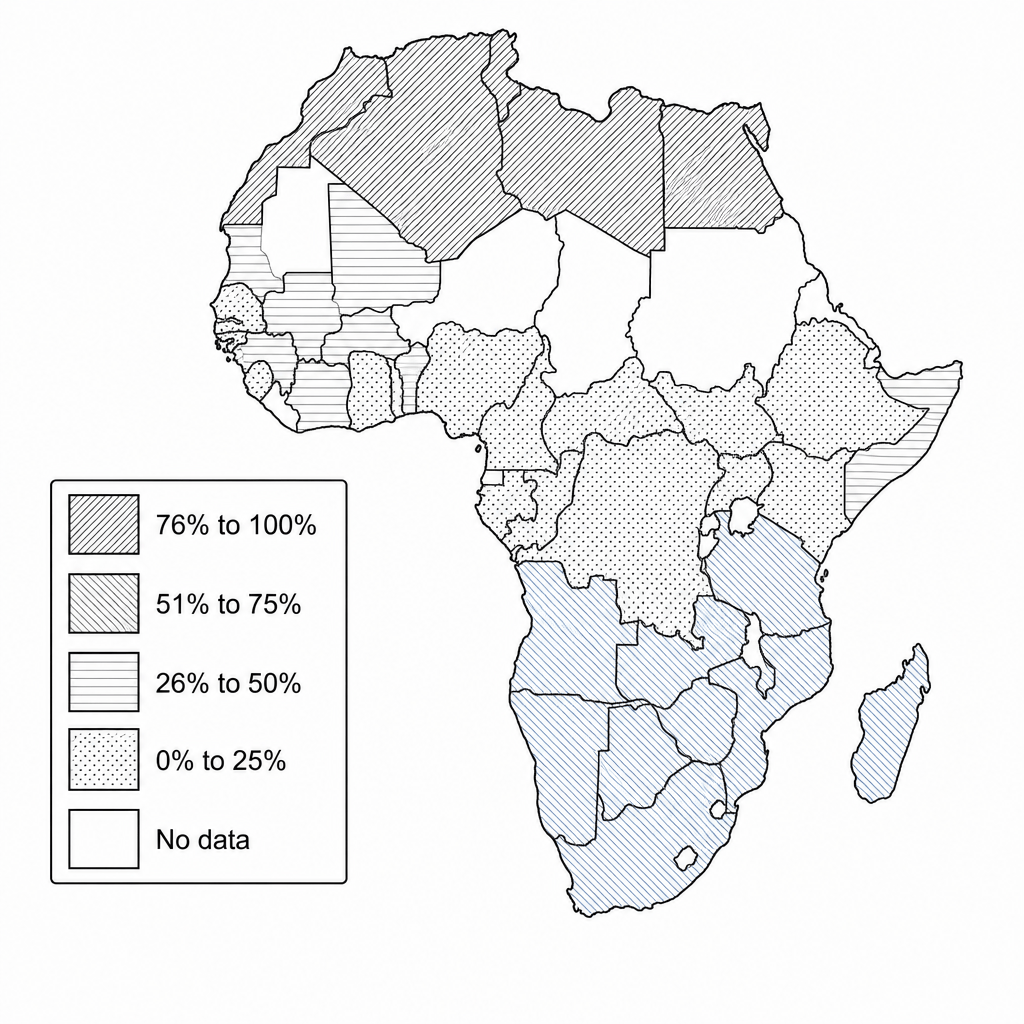
Figure 1: A choropleth map of Africa showing the percentage of the population with access to safely managed drinking water in 2022. Key: Dark Blue = 76% to 100%; Blue = 51% to 75%; Light Blue = 26% to 50%; Orange = 0% to 25%; White = No data. On the map, North African countries (e.g., Egypt, Algeria, Morocco) are painted Dark Blue. Southern African countries (e.g., South Africa, Botswana) are mostly Blue. A continuous horizontal band across Central Africa (including Chad, Central African Republic, and Democratic Republic of the Congo) stretching into parts of East Africa (e.g., South Sudan, Somalia, and Ethiopia) is colored Orange. West Africa is a mixture of Light Blue and Orange.

Describe the distribution of countries in Africa where 0–25% of the population had access to safely managed drinking water in 2022.


[3]

Water Questions

  1. GCSE
  2. /Geography
  3. /Water