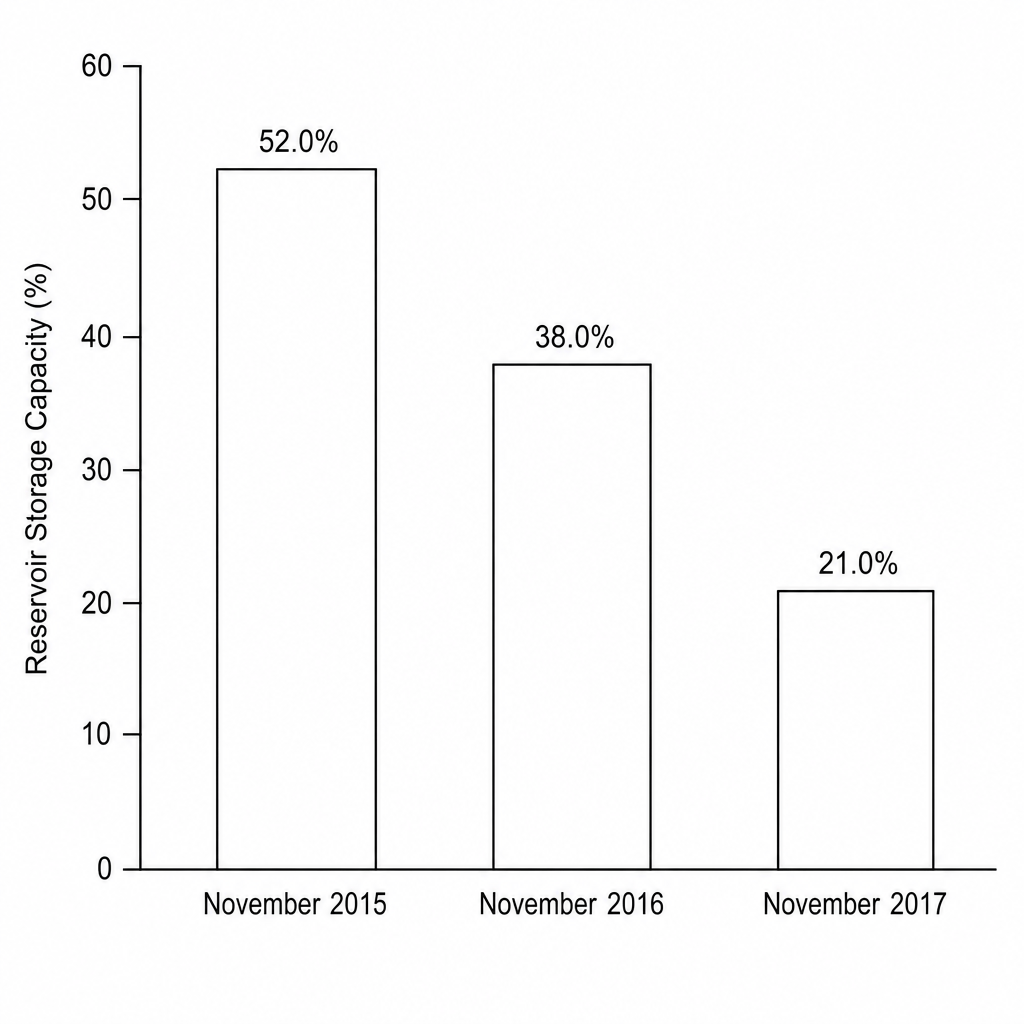
Study Figure 13, a bar chart showing the reservoir storage capacity of the Theewaterskloof Dam in Cape Town, South Africa, on three dates during a multi-year drought.
Describe the trend in reservoir storage capacity shown in Figure 13.