Skip to content
MathsGenie logo
Open app

Course home

  1. GCSE
  2. Geography AQA
  3. Question bank

Water

EasyMediumHard
12345678910111213141516171819202122232425262728293031323334353637383940414243444546
Question 33

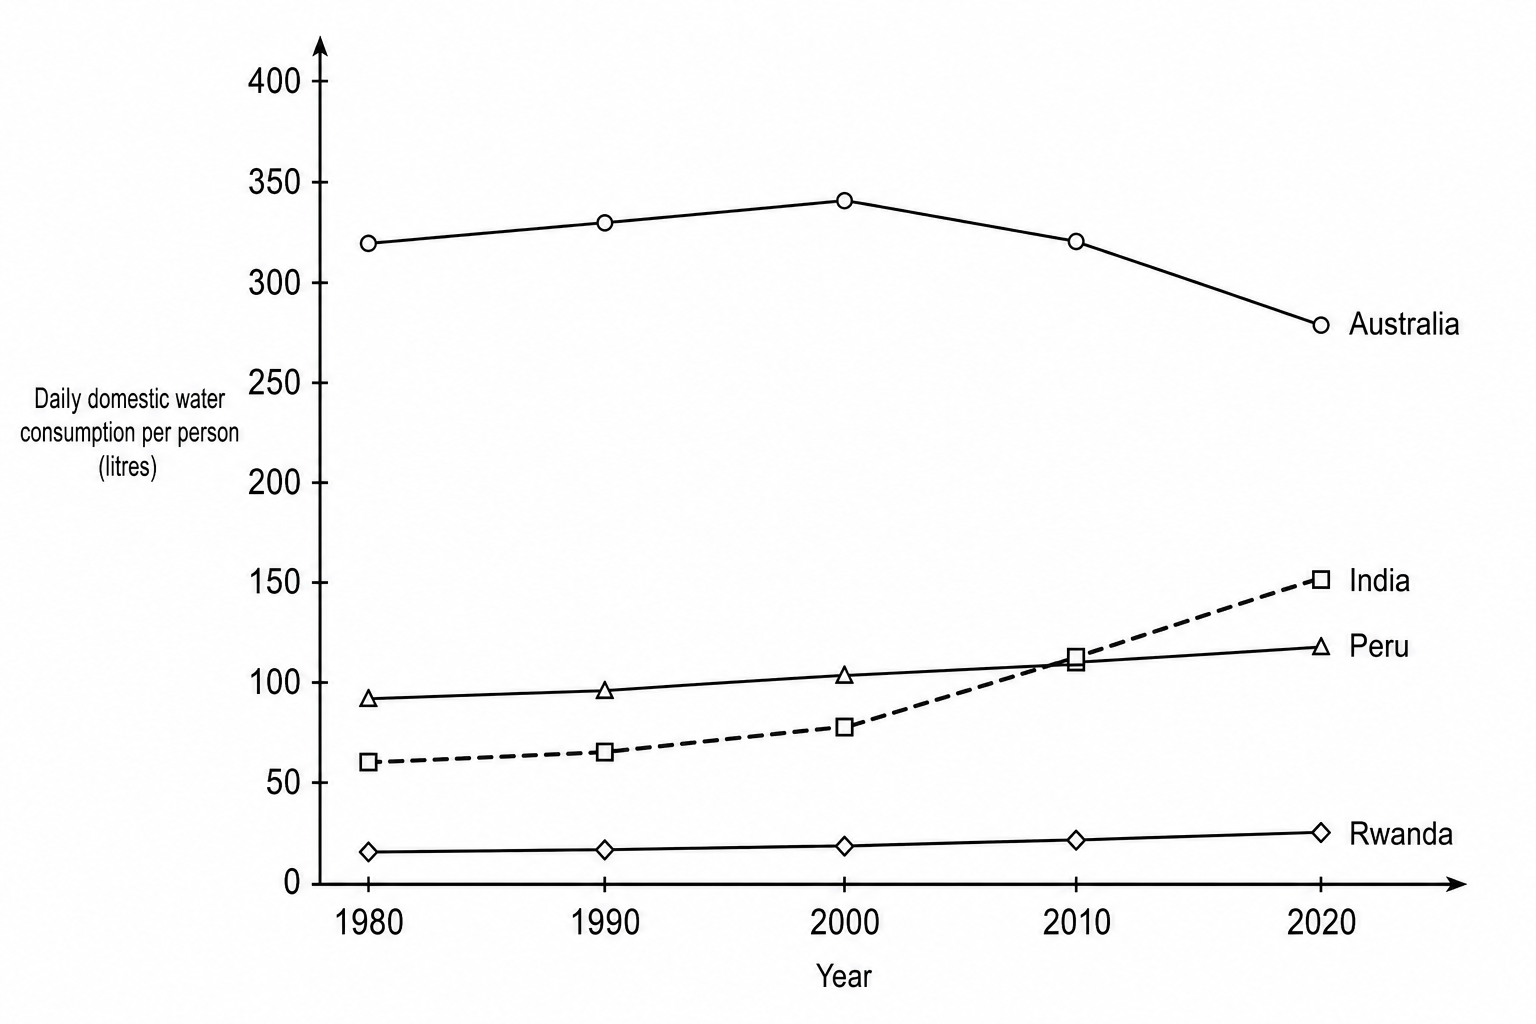
Study Figure 8, a line graph showing changes in daily domestic water consumption per person in four countries between 1980 and 2020.

Figure 8: Line graph showing daily domestic water consumption per person (in litres) for Australia, India, Peru, and Rwanda from 1980 to 2020. The line for India starts at 60 litres in 1980, rises slowly to 80 litres by 2000, and then rises more steeply to 150 litres by 2020.

Describe the trend for India shown in Figure 8.
[2]

Water Questions

  1. GCSE
  2. /Geography
  3. /Water

