Skip to content
MathsGenie logo
Open app

Course home

  1. GCSE
  2. Geography AQA
  3. Question bank

Water

EasyMediumHard
12345678910111213141516171819202122232425262728293031323334353637383940414243444546
Question 24

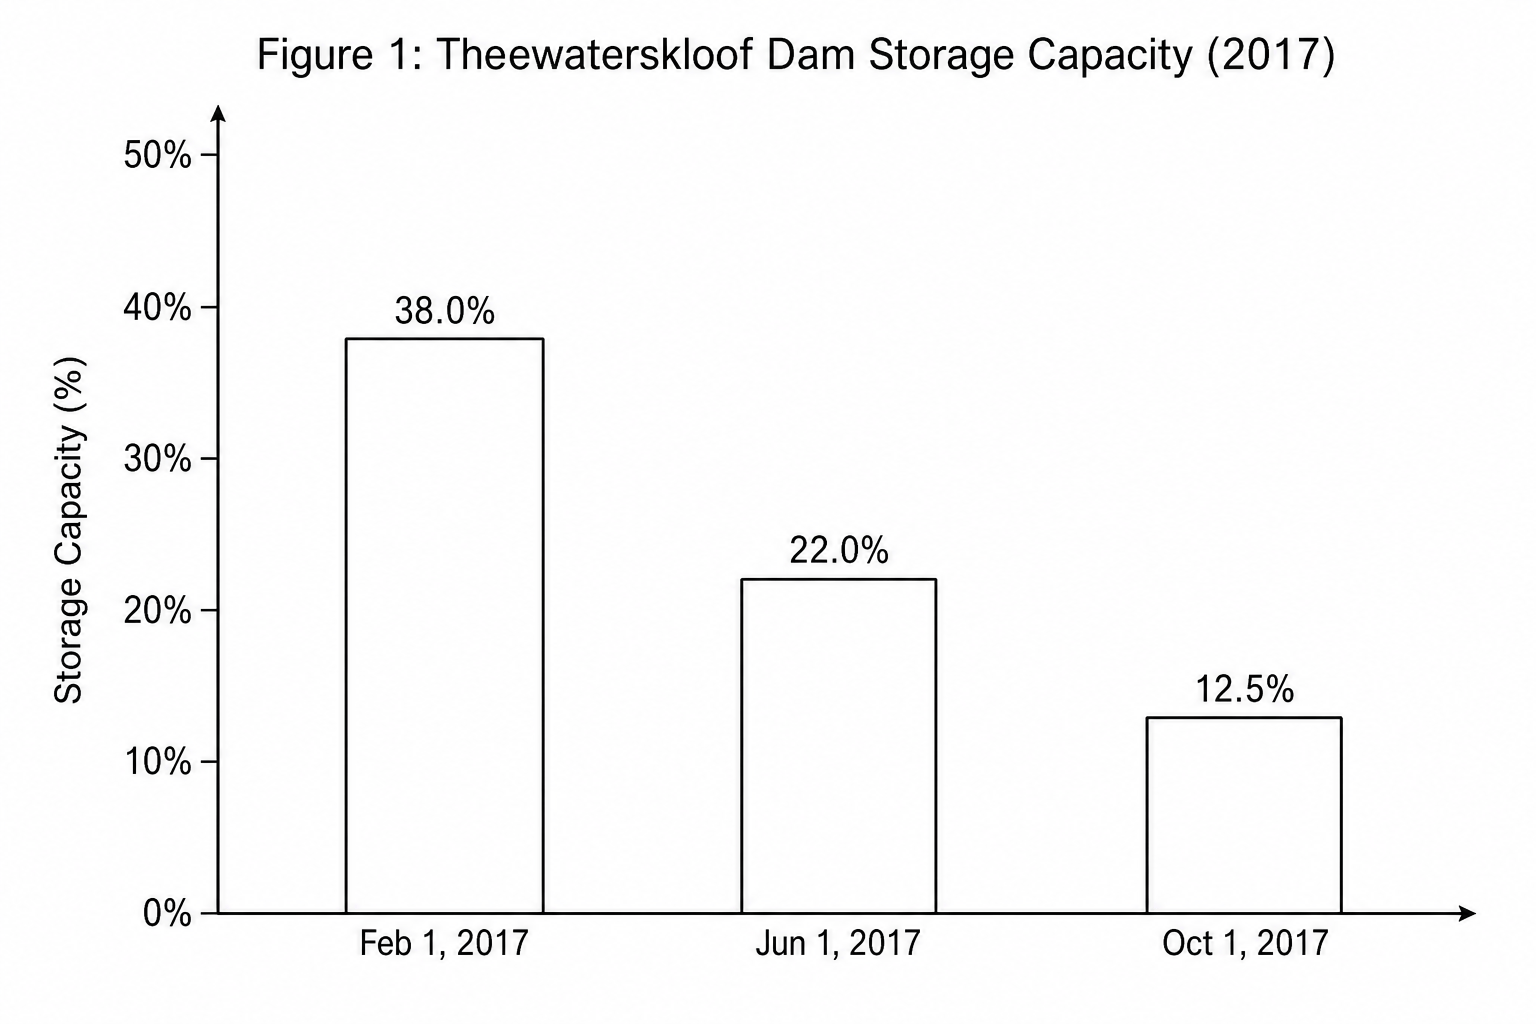
Study Figure 1, a bar chart showing the water storage capacity of the Theewaterskloof Dam in Cape Town, South Africa, across three dates in 2017.

Figure 1: Theewaterskloof Dam Storage Capacity (2017)

Describe the trend in dam storage capacity shown in Figure 1.
[2]

Water Questions

  1. GCSE
  2. /Geography
  3. /Water

