Skip to content
MathsGenie logo
Open app

Course home

  1. GCSE
  2. Geography AQA
  3. Question bank

Water

EasyMediumHard
12345678910111213141516171819202122232425262728293031323334353637383940414243444546
Question 17

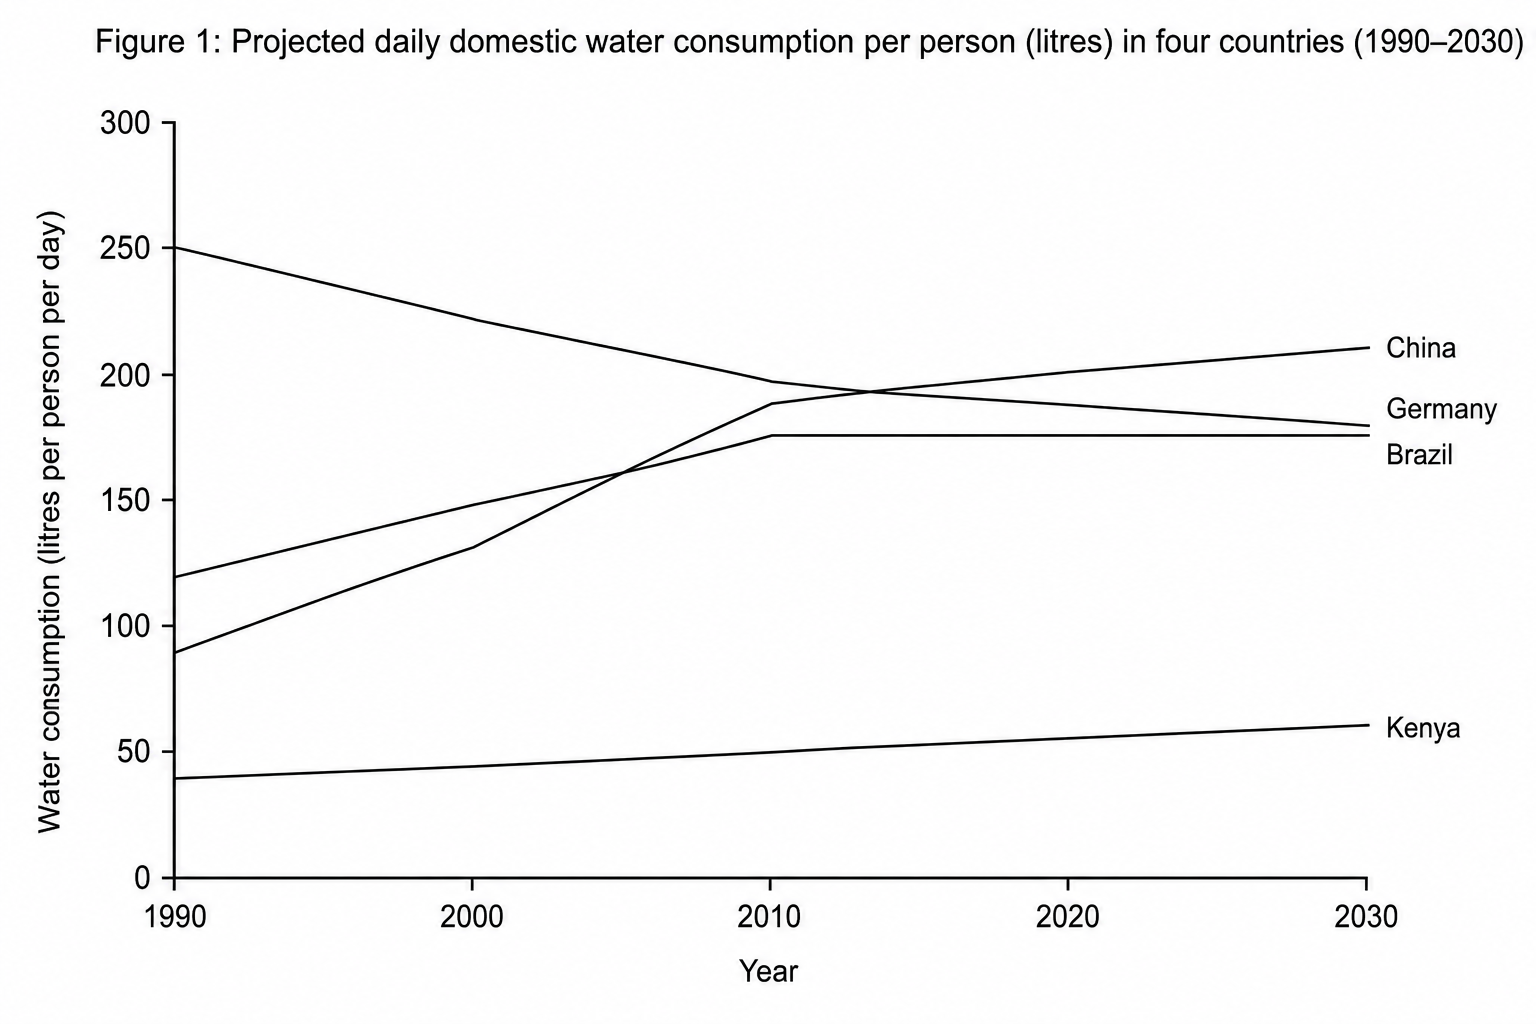
Study Figure 1, a line graph showing actual and projected changes in daily domestic water consumption per person in four countries between 1990 and 2030.

Figure 1: Projected daily domestic water consumption per person (litres) in four countries (1990–2030)

Describe the trend for China shown in Figure 1.
[2]

Water Questions

  1. GCSE
  2. /Geography
  3. /Water

