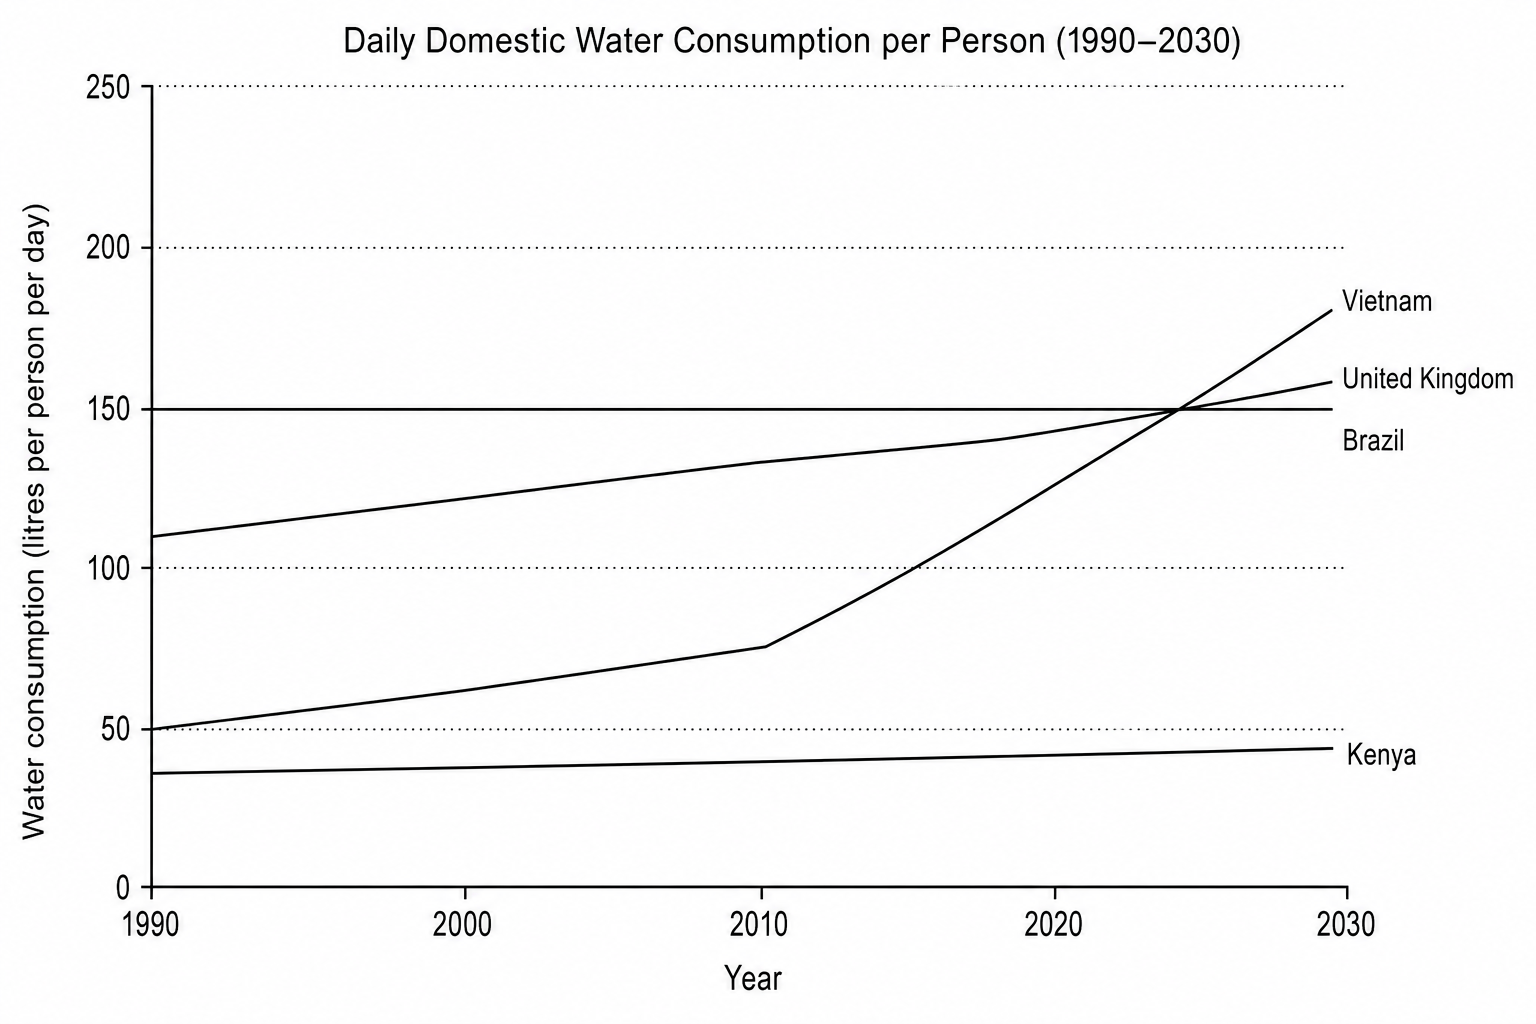
Study Figure 8, a line graph showing changes in daily domestic water consumption per person in four countries between 1990 and 2030 (including projected trends).
Describe the trend for Vietnam shown in Figure 8.