Skip to content
MathsGenie logo
Open app

Course home

  1. GCSE
  2. Geography AQA
  3. Question bank

The challenge of resource management

EasyMediumHard
12345678910111213141516171819202122232425262728293031323334353637383940414243444546474849
Question 1

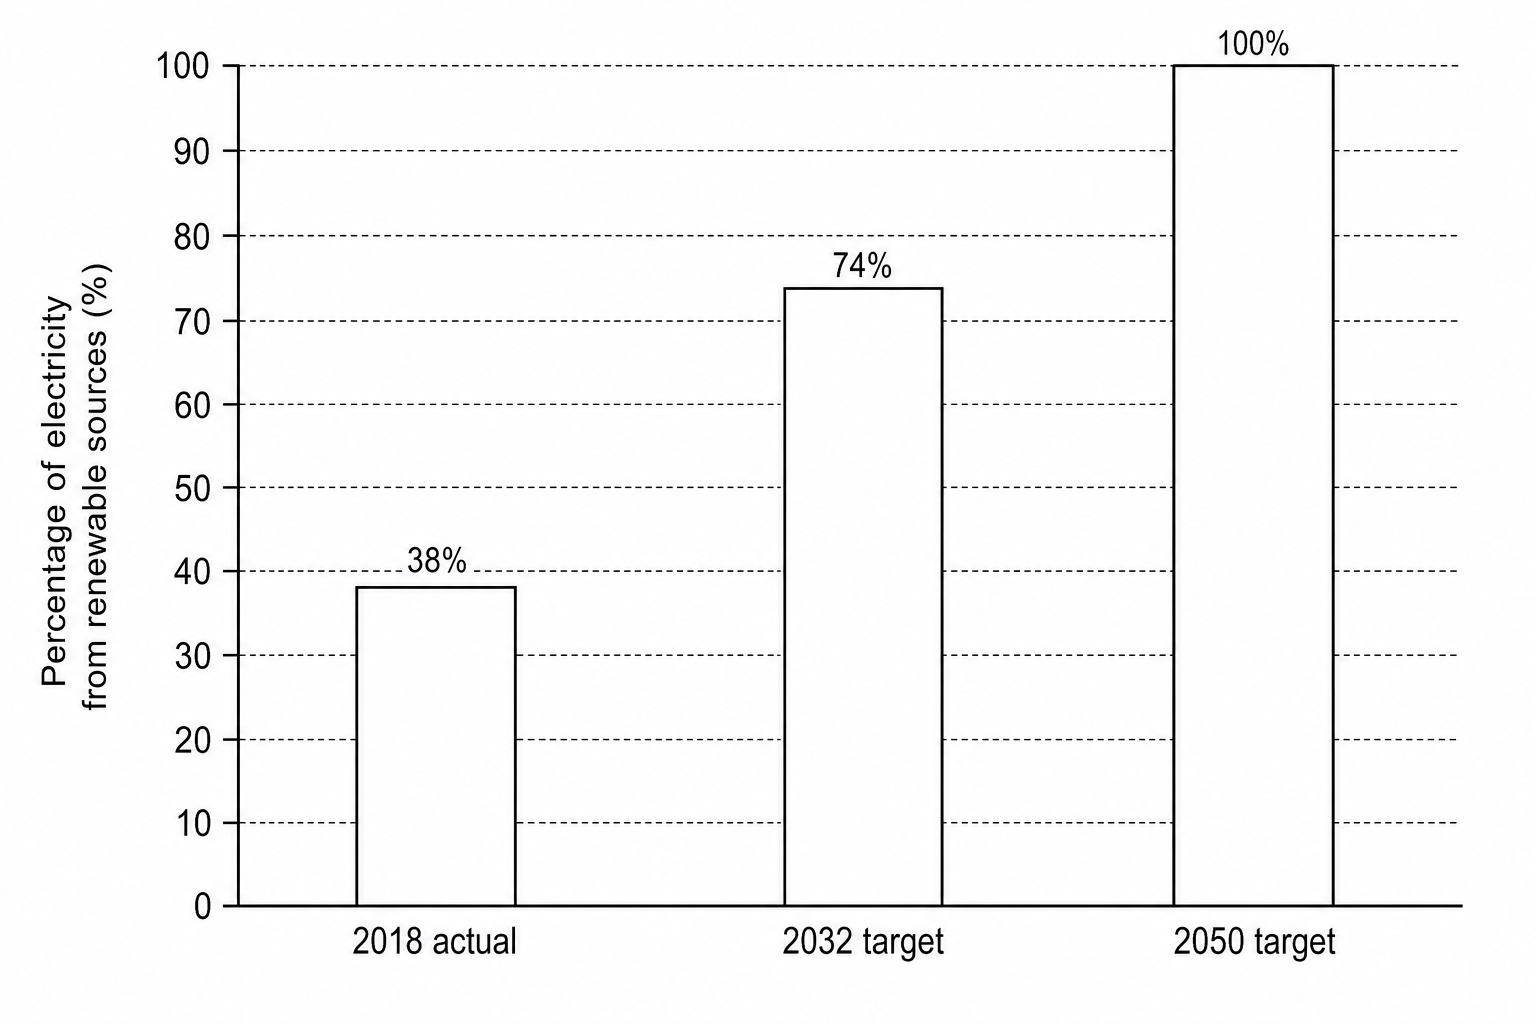
Study Figure 8, which shows the renewable energy generation share and targets for the Isle of Wight.

Figure 8: A bar chart showing the percentage of electricity generated from renewable sources in the Isle of Wight. The y-axis is labeled 'Percentage of electricity from renewable sources (%)' and ranges from 0 to 100 with grid lines at intervals of 10. The bars represent three distinct timeframes: '2018 actual' which shows a bar at 38%, '2032 target' which shows a bar at 74%, and '2050 target' which shows a bar at 100%.

Calculate the difference between the 2018 actual percentage and the 2032 target.
[1]

The challenge of resource management Questions

  1. GCSE
  2. /Geography
  3. /The challenge of resource management

