Skip to content
MathsGenie logo
Open app

Course home

  1. GCSE
  2. Geography AQA
  3. Question bank

The challenge of natural hazards

EasyMediumHard
12345678910111213141516171819202122232425262728293031323334353637383940414243444546474849505152535455565758
Question 1
95%

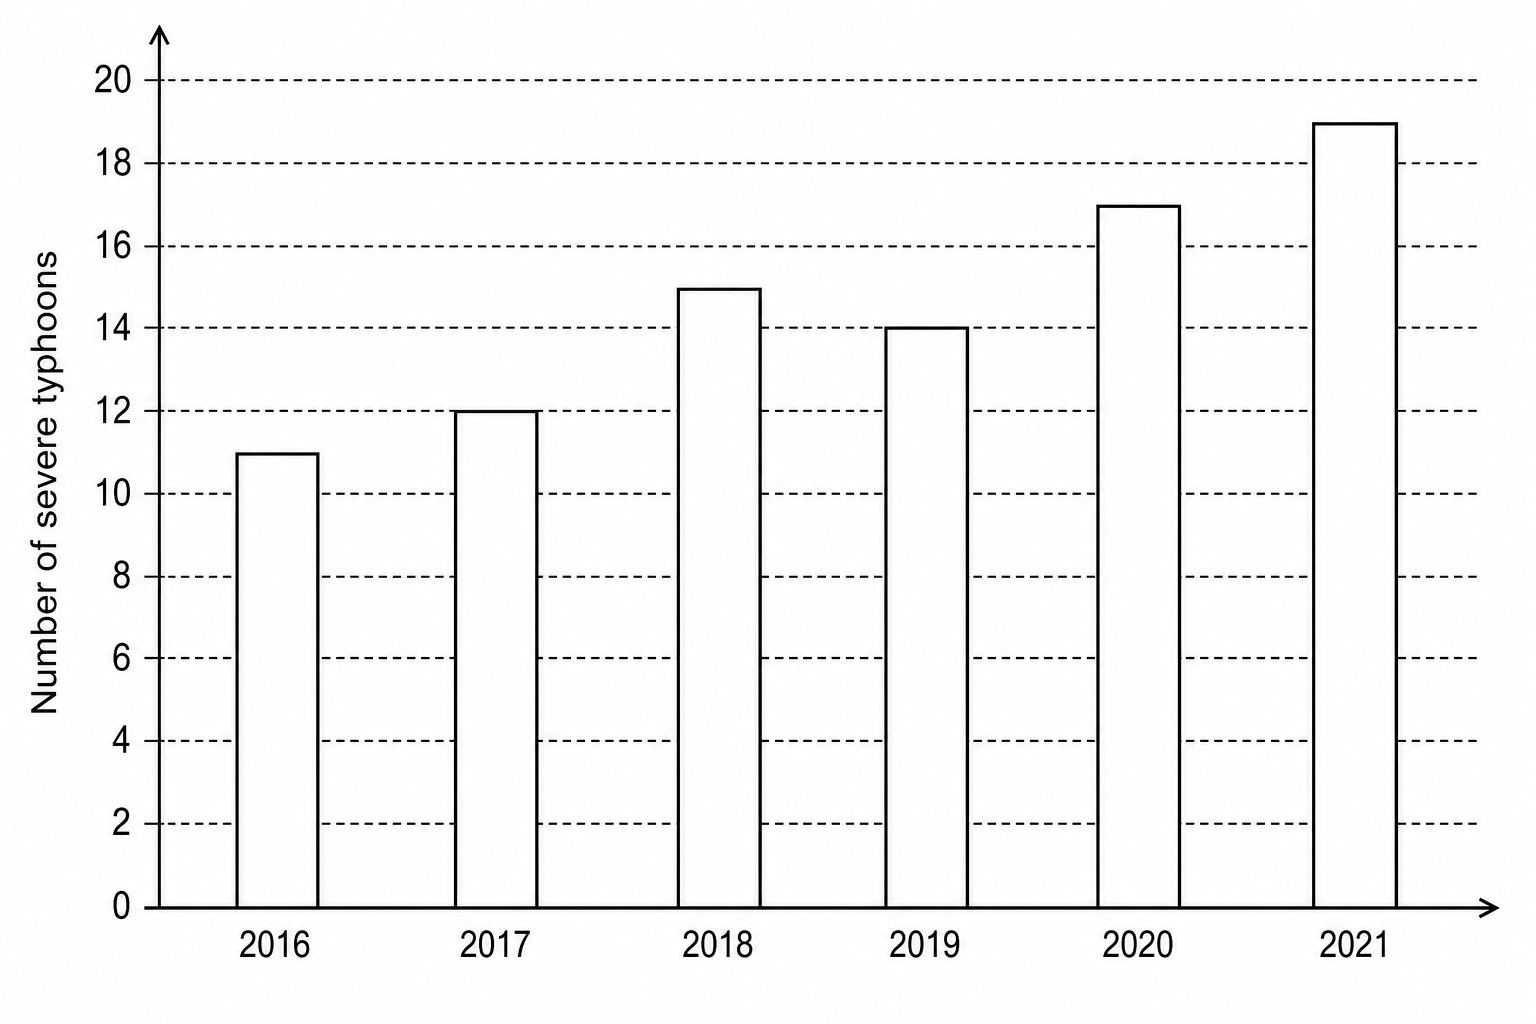
Figure 3 is a bar graph showing the total annual number of severe typhoons recorded in the Northwest Pacific Ocean between 2016 and 2021.

Bar graph showing the total annual number of severe typhoons in the Northwest Pacific from 2016 to 2021.

Suggest one reason for the overall increase in the number of severe typhoons shown in Figure 3.
[1]

The challenge of natural hazards Questions

  1. GCSE
  2. /Geography
  3. /The challenge of natural hazards

