Using Figure 7:
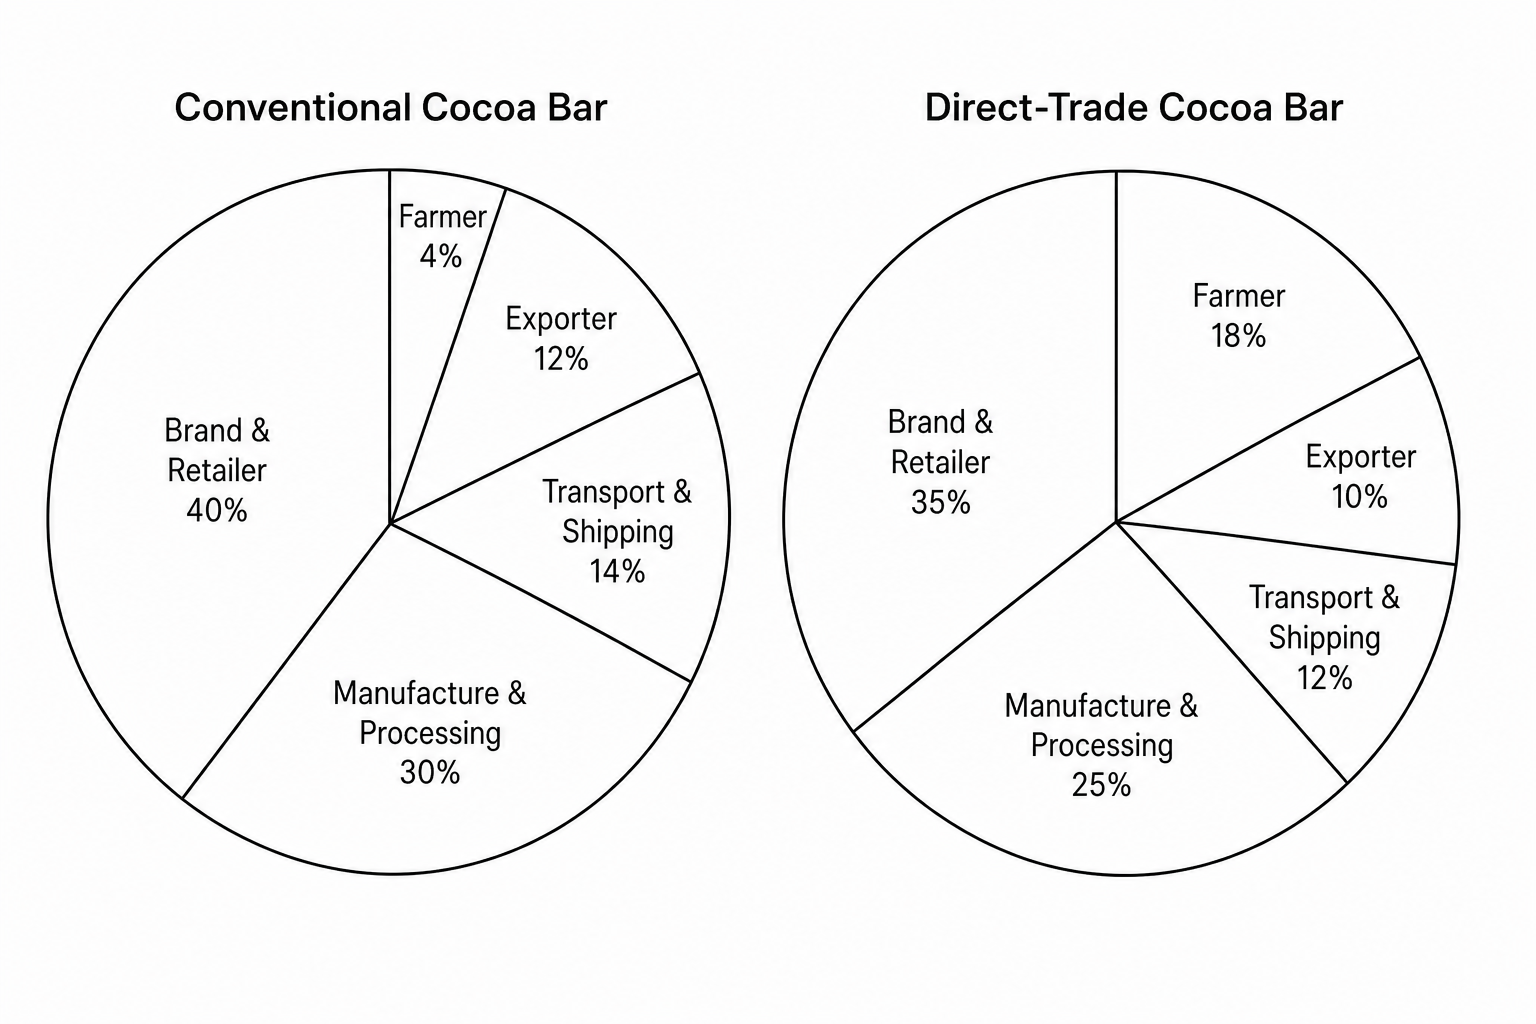
| Component | Percentage |
|---|---|
| Farmer | 4% |
| Exporter | 12% |
| Transport & Shipping | 14% |
| Manufacture & Processing | 30% |
| Brand & Retailer | 40% |
| Component | Percentage |
|---|---|
| Farmer | 18% |
| Exporter | 10% |
| Transport & Shipping | 12% |
| Manufacture & Processing | 25% |
| Brand & Retailer | 35% |
| Year | 2005 | 2009 | 2013 | 2017 | 2021 |
|---|---|---|---|---|---|
| Retail sales value (£ millions) | 12.8 | 41.5 | 98.2 | 185.4 | 284.1 |
Compare the percentage of the retail price received by a Direct-Trade cocoa farmer with that of a conventional cocoa farmer.
Calculate the increase in retail sales value of Direct-Trade cocoa in the UK between 2005 and 2021.

