Using Figure 7:
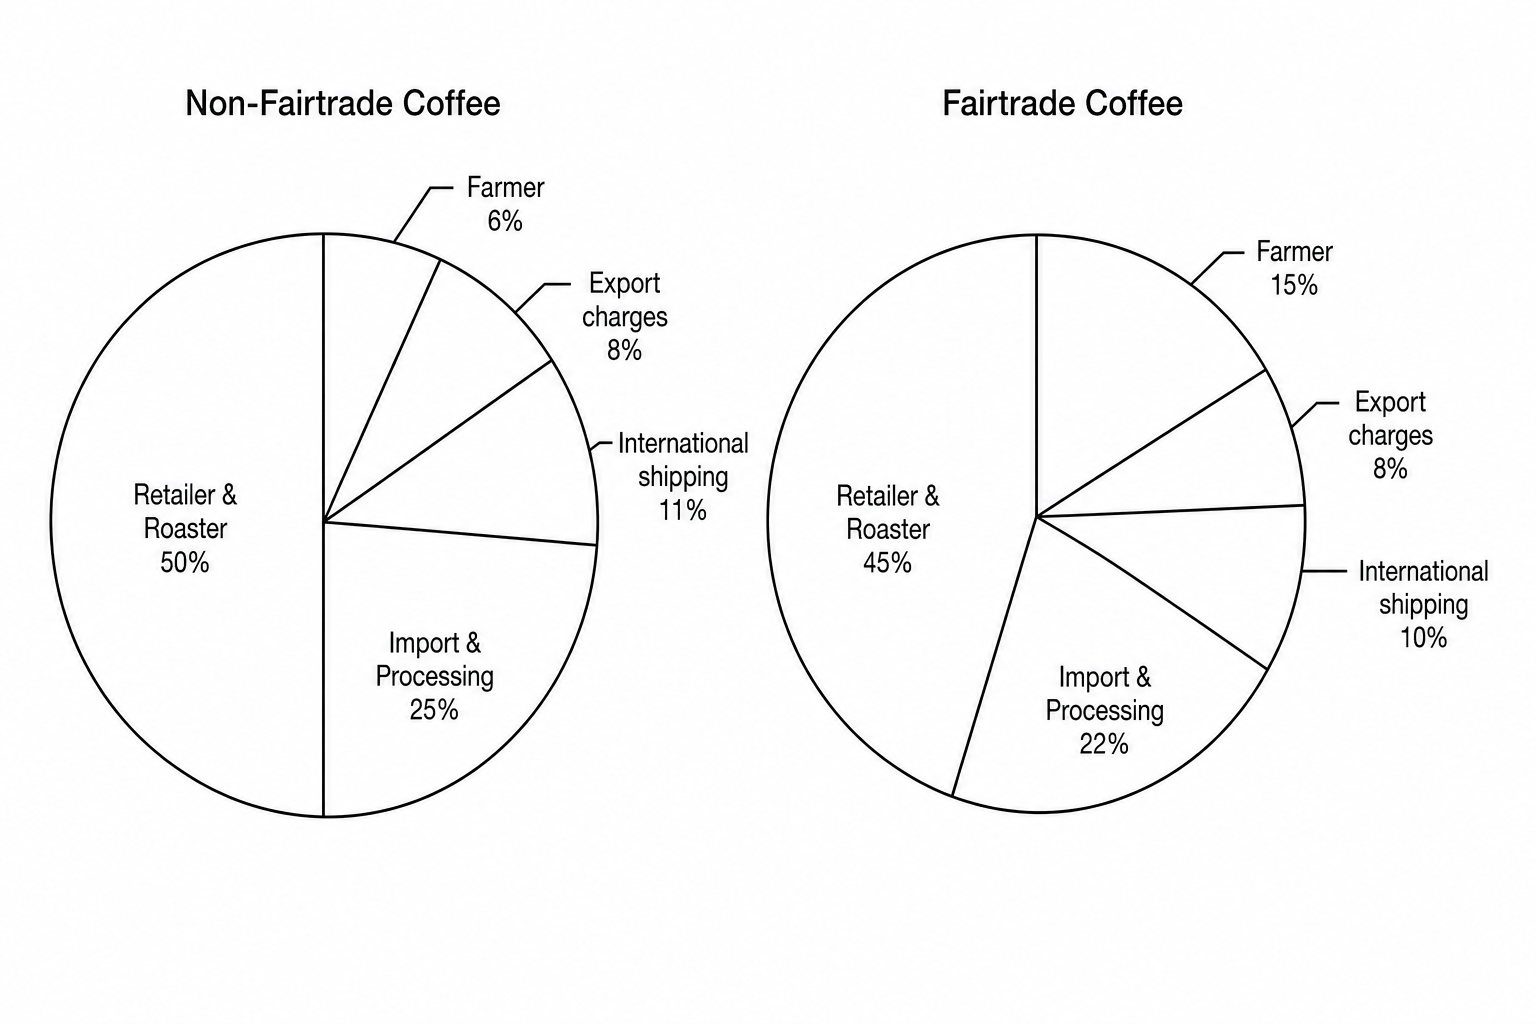
| Component | Percentage |
|---|---|
| Coffee farmer | 6% |
| Export charges | 8% |
| International shipping | 11% |
| Import & Processing | 25% |
| Retailer & Roaster | 50% |
| Component | Percentage |
|---|---|
| Coffee farmer | 15% |
| Export charges | 8% |
| International shipping | 10% |
| Import & Processing | 22% |
| Retailer & Roaster | 45% |
| Year | 2002 | 2006 | 2010 | 2014 | 2018 |
|---|---|---|---|---|---|
| Retail sales value (£ millions) | 15.4 | 34.2 | 112.5 | 198.8 | 312.6 |
Compare the percentage of the retail price received by the Fairtrade coffee farmer with that of a non-Fairtrade coffee farmer .
Calculate the increase in retail sales value of Fairtrade coffee in the UK between 2002 and 2018 .

