Using Figure 1:
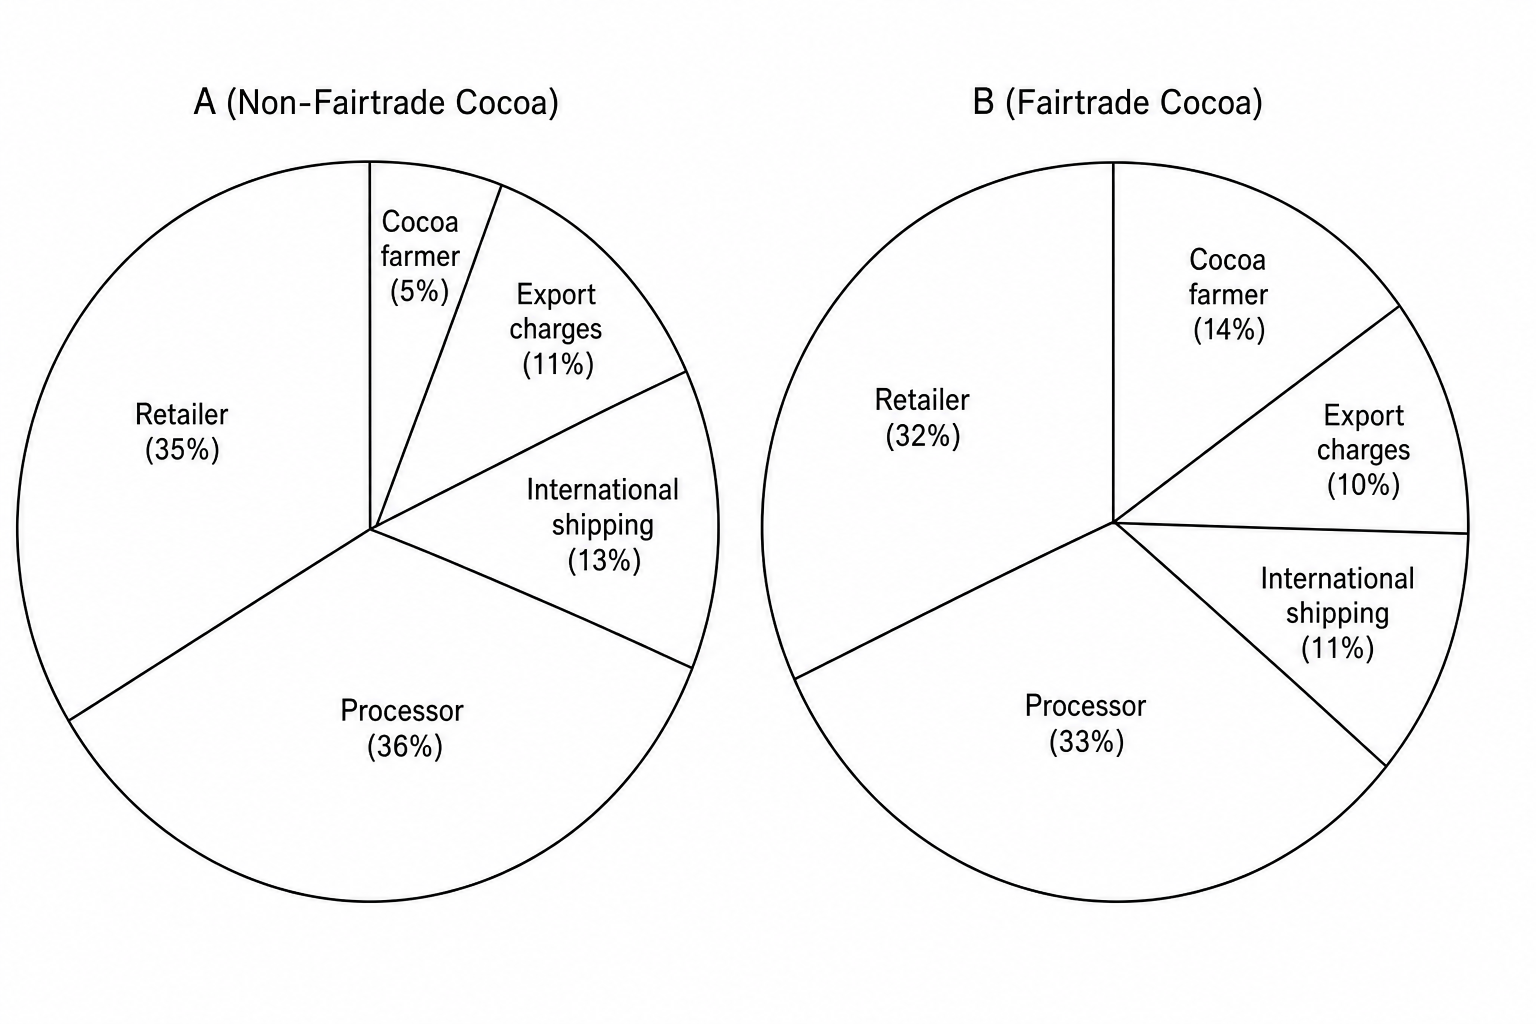
| Component | Percentage |
|---|---|
| Cocoa farmer | 5% |
| Export charges | 11% |
| International shipping | 13% |
| Processor | 36% |
| Retailer | 35% |
| Component | Percentage |
|---|---|
| Cocoa farmer | 14% |
| Export charges | 10% |
| International shipping | 11% |
| Processor | 33% |
| Retailer | 32% |
| Year | 2004 | 2008 | 2012 | 2016 | 2020 |
|---|---|---|---|---|---|
| Retail sales value (£ millions) | 22.8 | 58.4 | 142.1 | 224.5 | 385.9 |
Compare the percentage of the retail price received by the Fairtrade cocoa farmer with that of a non-Fairtrade cocoa farmer .
Calculate the increase in retail sales value of Fairtrade cocoa in the UK between 2004 and 2020 .

