Read the graph before you interpret it
Read the graph before you interpret it
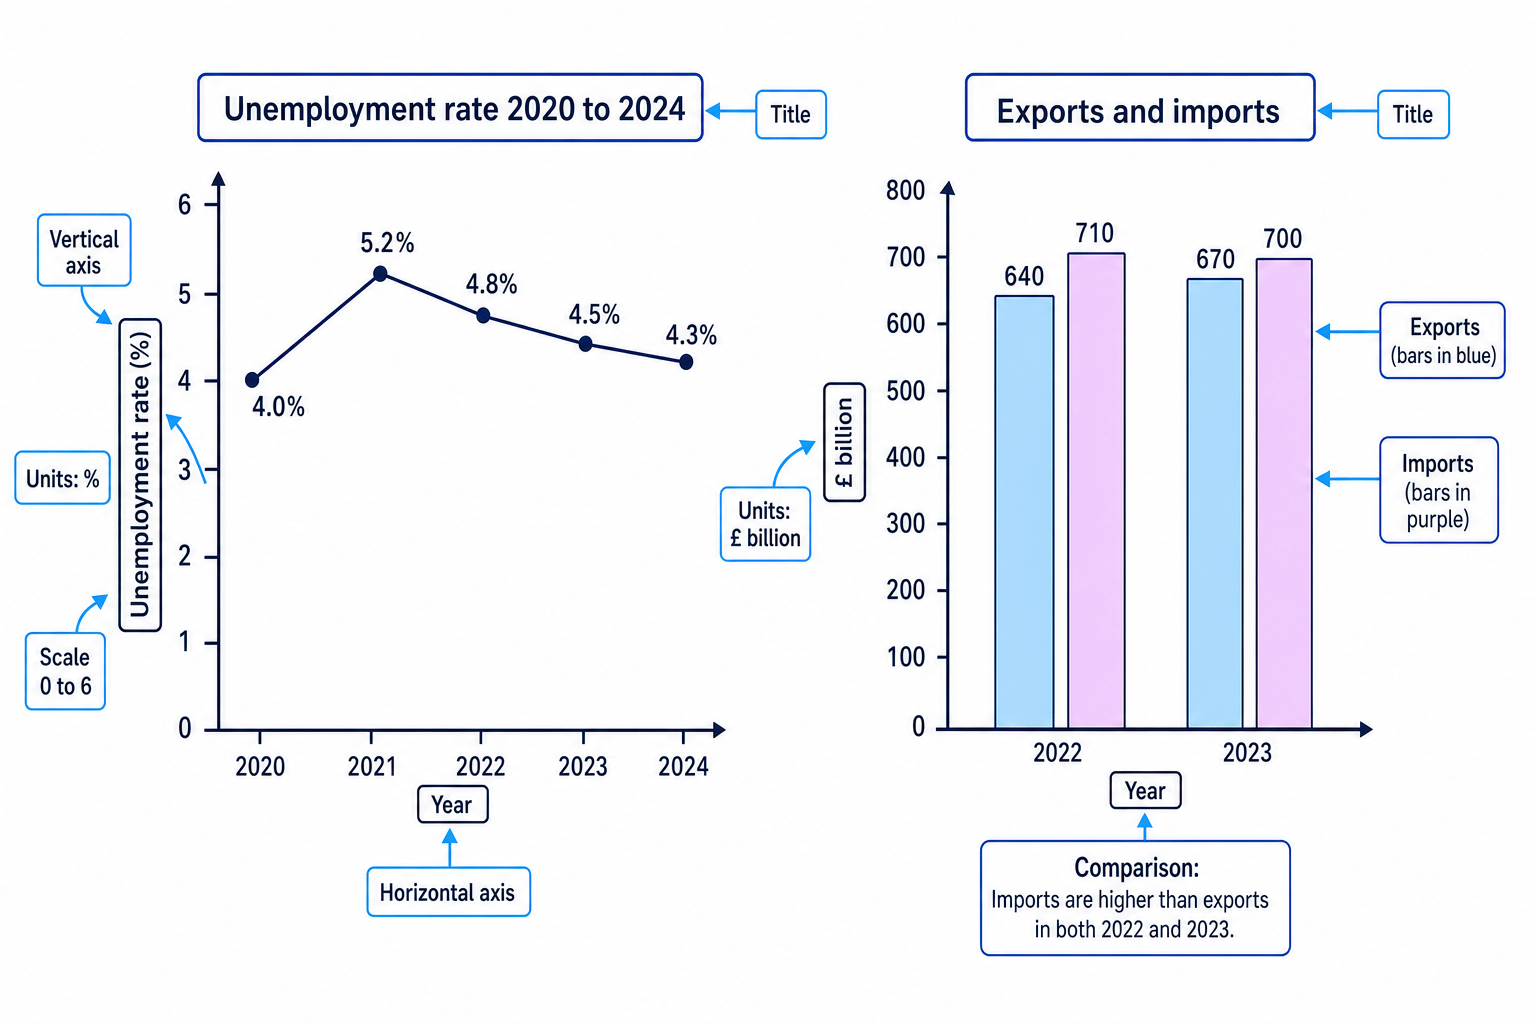 Quantitative data is numerical information such as unemployment rates, export values, or CPI inflation. In economics, you use these figures as evidence to support a judgment or justify a policy decision.
Interpretation and use of quantitative data to support and justify economic decisions Lesson
Step-by-step lessons on OCR GCSE Economics Interpretation and use of quantitative data to support and justify economic decisions. Each one builds up to exam-style questions. Build a solid grasp of supply and demand and cost/revenue calculations before tackling the evaluation-heavy policy topics.