Start by describing the overall trend
Definition
Recession: a period in which real GDP falls for two quarters in a row, so the economy is shrinking rather than growing.
- The first move with any GDP series is to say whether real GDP is rising, falling or flat across the whole period, before picking out any single year.
- Then compare the growth rate between periods, because a positive but falling rate still means output is rising, only more slowly.
- Quote the figures and the periods you are using, so each point can be traced back to the data rather than to an impression of it.
- Finish the description by naming the turning points, since a period where growth changes direction usually has a cause worth explaining.
Read a growth chart quarter by quarter
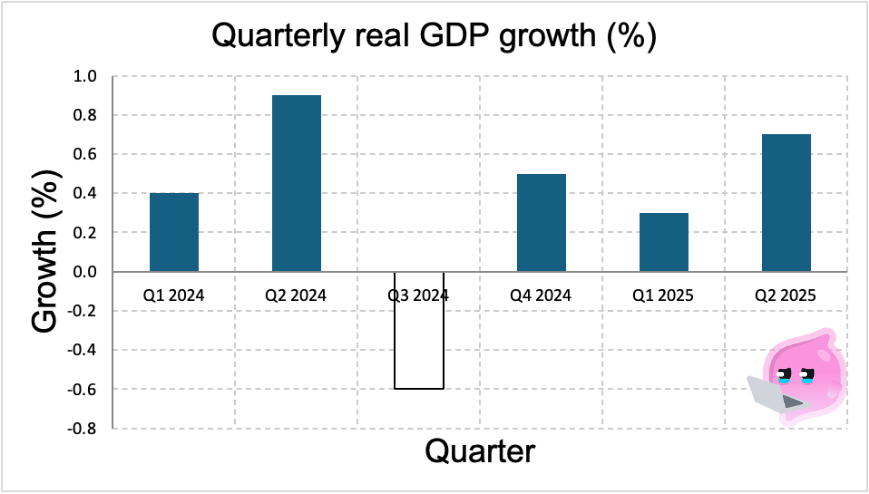
- The vertical axis is a growth rate, not a level, so every bar above zero means real GDP grew that quarter and a shorter bar means it grew by less.
- Across the six quarters growth runs 0.4%, 0.9%, -0.6%, 0.5%, 0.3% and 0.7%, so output rose in five of them and fell in one.
- Q3 2024 is the only bar below zero, at -0.6%, and one falling quarter is not a recession because Q4 2024 grew by 0.5% and the run stopped at one.
- Between Q4 2024 and Q1 2025 the bar shortens from 0.5% to 0.3%, which is growth slowing while output is still rising, not output falling.
Note
- A quarterly figure and an annual figure answer different questions, so always say which one you are quoting.
- A quarter is three months, so the four quarterly rises above do not simply add up to the annual rate.
Index numbers make comparisons easier
Definition
Index number: a value expressed as a comparison with a base year, which is set equal to 100.
- An index of 105 means output is 5% above the base year, and an index of 98 means it is 2% below it.
- An index is useful because it shows the size of a change without needing the level of GDP in pounds.
- Comparing two countries' indices shows only how fast each has grown from its own base, not which of them produces more.
Common Mistake
- Do not read index numbers as levels of output, because each index starts from its own base year and its own starting size.
- Do not read a growth-rate chart as a level chart either, since a bar that shrinks still sits above zero and still means output grew.
Historical data shows the shocks too
- A long series shows that growth is not steady, because output falls in a recession and then usually recovers.
- The two deepest recent falls in UK output came with the financial crisis of 2008 and 2009 and the coronavirus pandemic in 2020.
- Reading a recovery correctly matters, because a very large rise straight after a very large fall is output returning rather than output newly created.
Case study
- Lockdowns in 2020 closed shops, restaurants, building sites and much of transport, and UK real GDP fell more steeply than in any other year in the modern series.
- The lesson for reading data is to ask what the level was before the fall, because the 2021 figure measures recovery rather than expansion.
Say what the data shows and hides
- A strong reading states the trend, quotes the figures behind it and names the turning points, in that order.
- It then adds what the series cannot tell you, because a GDP figure carries no information about how the output was shared out.
- One sentence of caveat is enough, and it stops a confident conclusion resting on more than the numbers can support.
Self review
- What is a recession?
- Growth is 0.5% one quarter and 0.3% the next. What has happened to output?
- Real GDP growth is -0.6% in one quarter and 0.5% in the next. Is that a recession, and why?
- What does an index value of 110 tell you about output compared with the base year?
- Why must a recovery year be read against the level of output before the fall?
