1.4.1a Business objectives
Objectives guide a firm's price and output choices
Profit maximisation: making the gap between a firm's total revenue and its total costs as wide as possible.
Sales growth: raising the quantity or the value of what the firm sells, year after year.
Increasing market share: raising the firm's own sales as a share of all the sales made in its market.
- Two firms facing the same costs and the same customers will name different prices if they want different things.
- Market share is a share, so a firm can sell more units than last year and still lose share when the whole market has grown faster than it has.
- Sales growth asks how big the firm is getting, while market share asks how big it is getting compared with its rivals.
- A firm can hold several objectives at once and rank them, chasing share in a city it has just entered while taking profit from the towns where it is already established.
- Shareholders who own a large company want a return on their money, while the salaried managers who run it are judged on how large the business has become.
- That split is why a firm's stated aim and the aim its decisions reveal are not always the same one.
- Every objective is limited by the revenue and cost figures behind it, because the firm still has to cover its costs from somewhere.
Each objective suits a different kind of firm
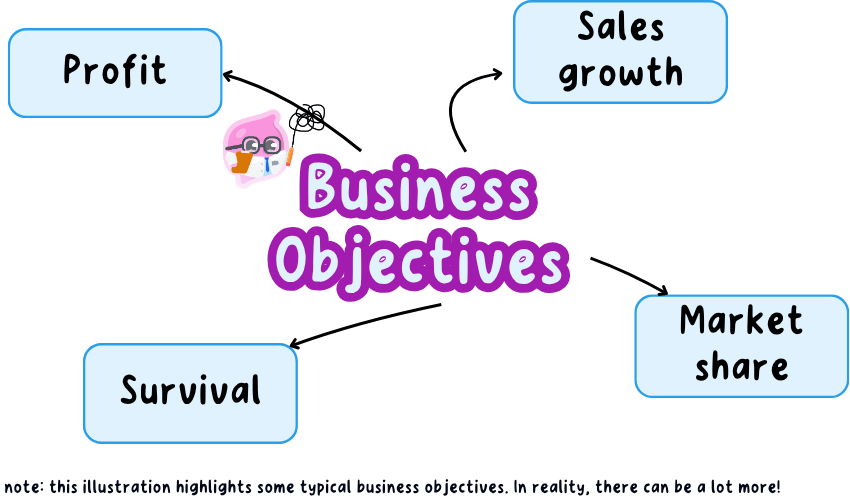
- Profit suits a firm that answers to outside owners, because Tesco has to hand its shareholders a return, and profit is also what pays for new stores and new machinery.
- Sales growth suits a firm whose product travels well, because Greggs has grown by opening more shops rather than by charging more in the shops it already had.
- Selling more units also spreads the rent and the bakery equipment over a larger output, which brings the cost of each item down.
- Increasing market share suits a firm in a crowded market, because a bigger share gives ASOS more weight when it negotiates with the brands that supply it.
- A larger share also makes it harder for a new rival to get a foothold, since customers who already have somewhere they shop rarely go looking for another.
- Survival comes first for a new or struggling firm, so it holds its price low enough to keep money coming through the till, which is why so many independent shops cut prices rather than shut in a bad year.
- Grocery price matching: Tesco has spent years matching the prices of cheaper rivals and offering lower prices to shoppers who use its loyalty card.
- The target is market share rather than the price of any one item, because a shopper who moves to a cheaper chain takes a whole weekly basket with them.
- Every price matched narrows the gap between what Tesco charges and what the goods cost it, and only a large established firm can carry that long enough for the share to arrive.
Chasing one objective means giving up another
- Cutting the price to win market share sacrifices profit now, because every unit sold brings in less money while costing exactly the same to make.
- Growing sales quickly raises costs before the extra sales pay for themselves, since the new shop, the extra staff and the longer delivery round are all paid for in the year they are added.
- Survival gives up profit and investment together, so a firm that holds its price down for too long has nothing left to modernise with and slips further behind its rivals.
- Market share bought with discounts is easily lost, while share won by a better product or a more convenient location is far harder for a rival to take back.
- The conflict is a matter of degree rather than a straight choice, since a firm can accept less profit this year to hold the share that earns its profit next year.
- Sales growth is not profit: a firm can double its sales and earn less than before.
- Market share is a percentage of the whole market, not a number of items sold.
- Profit maximisation is the usual starting assumption, not a fact about every firm.
Whether profit dominates depends on the firm's position
- It depends on who owns the firm, because a company answering to outside shareholders is judged on the return it hands back each year, while an owner run corner shop can settle for a comfortable living.
- It depends on how long the firm has been trading, because a firm in its first year has to survive before it can maximise anything.
- It depends on the time period you look at, because the share bought with this year's discounts is what makes next year's profit possible.
- It depends on how crowded the market is, because a firm with many close rivals that pushes its price up to the profit maximising level simply sends its customers to the shop next door.
- It depends on who actually takes the decisions, since managers rewarded for the size of the business lean towards growth even where the owners would rather have the profit paid out.
Judgement: profit is the objective firms keep coming back to, because survival needs cash, growth needs funds and market share bought with discounts has to be paid for out of profit earned somewhere else.
Judge an objective by actions, not statements
- A firm cutting prices and opening branches while earning very little is pursuing growth or market share, whatever its annual report claims.
- A firm raising prices and closing its weakest branches is pursuing profit, trading customers away for a wider gap on the ones it keeps.
- A firm holding a price that barely covers what each unit costs to make is surviving, picking the smaller of two losses rather than the larger one.
- Look at what the firm did with the money it earned, because profit paid out to owners points one way and profit spent on new outlets points another.
- Use AQA's own terms: profit, sales growth, market share; bring in survival only where relevant.
- Tie every objective you name to a decision on price, output or spending, taken from the source.
- Asked whether a firm should pursue an objective, say what it gives up before you judge.
- Name the three business objectives AQA lists.
- How can a firm raise its sales and still lose market share?
- Why might a new firm put survival ahead of profit?
- Name a UK firm that has grown by opening more outlets, and say what that growth costs it in the short run.
- Why do the managers who run a large company not always want what its owners want?
1.4.1b Types of costs and revenue
Fixed costs stay constant; variable costs rise with output
Fixed costs: the costs that stay the same however much the firm produces, such as rent, business rates and insurance.
Variable costs: the costs that rise and fall with output, such as ingredients, packaging and the wages of staff paid by the hour.
- Fixed costs are fixed in total and not per unit, so the same £600 of weekly rent is 60p on each of 1,000 items and 15p on each of 4,000.
- Which of the two a cost belongs to depends on the time period, since that shop cannot walk away from its lease this month but can choose not to renew it in three years.
- Keep the periods matching too, so weekly fixed costs go with weekly output, or the average means nothing.
Add costs for total, divide for average
Total cost: the fixed costs and the variable costs added together at a given level of output.
Average cost: the total cost of an output divided by the number of units produced, which is what one unit costs on average.
- A variable cost is nearly always handed to you per unit, so turn it into a total first: variable cost=cost per unit×output\text{variable cost} = \text{cost per unit} \times \text{output}variable cost=cost per unit×output.
- The other two lines then follow:
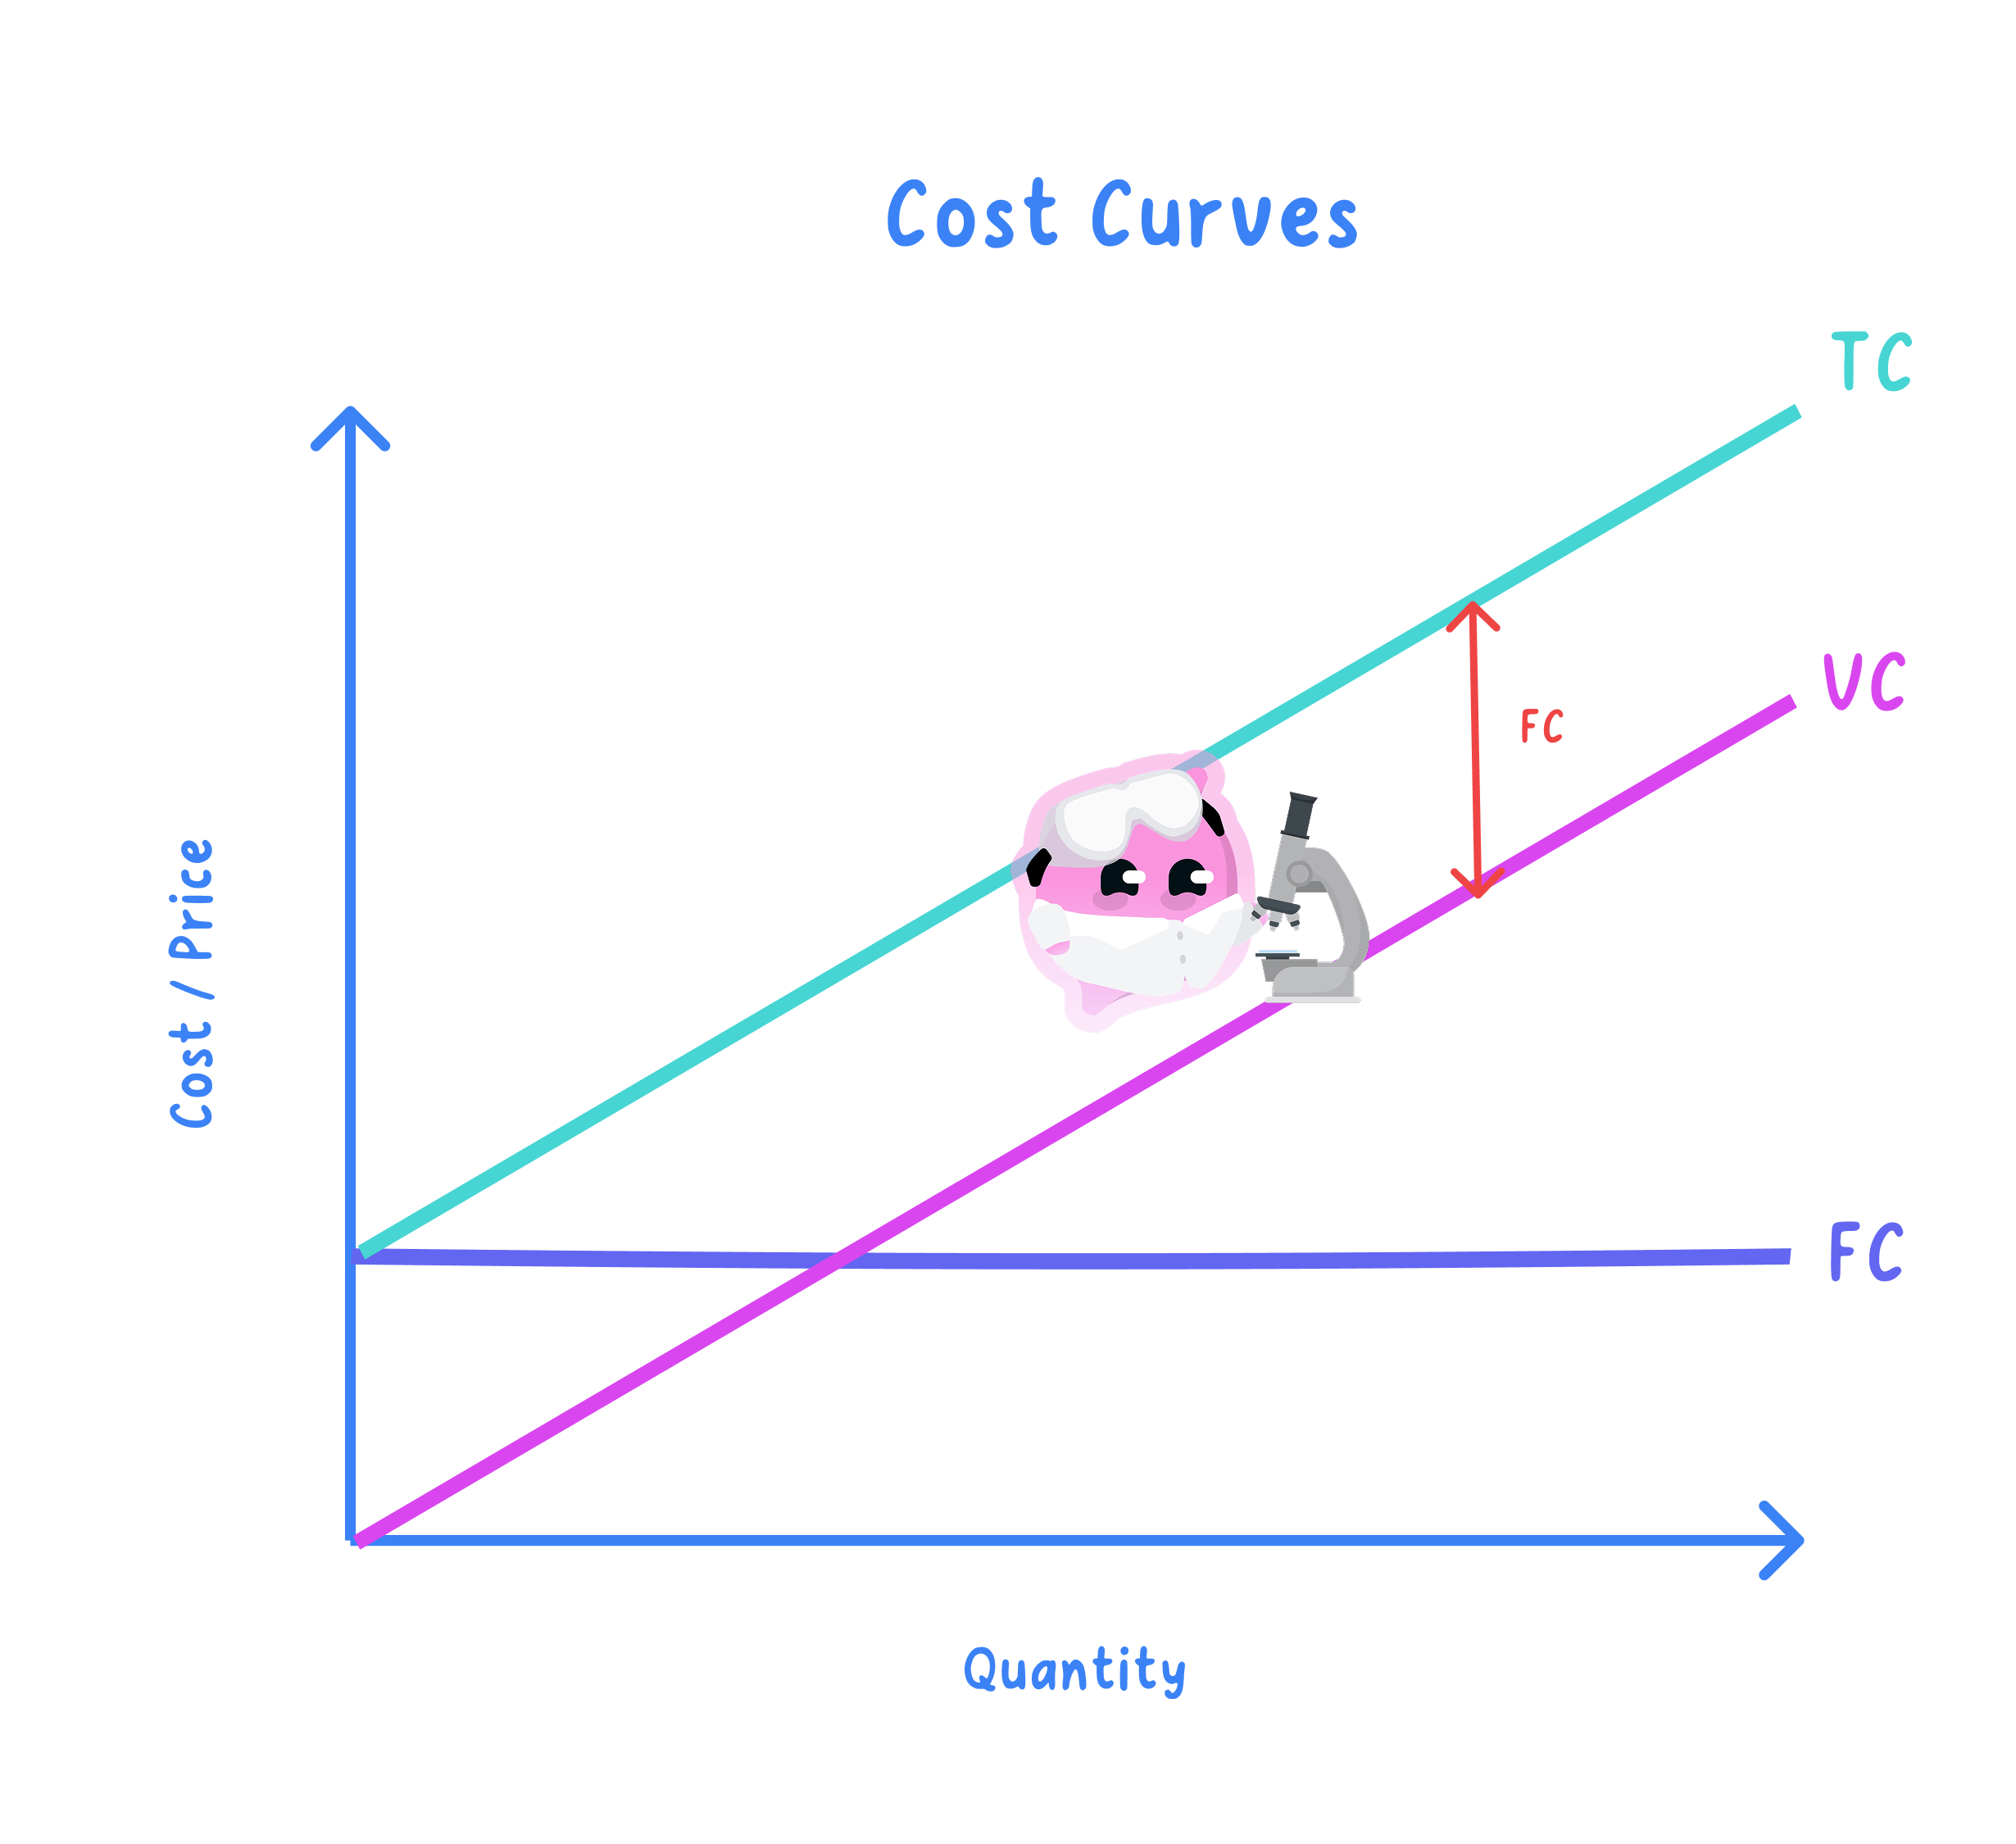
One bakery's costs, worked at one output
- A high street bakery has fixed costs of £600 a week covering its rent, business rates, insurance and the lease on its oven.
- Each sausage roll it bakes adds 40p of variable cost in pastry, filling, packaging and staff hours.
- Work one output level right through before touching the others, because the same three lines then repeat at every level.
- Three thousand rolls a week: fixed costs are £600 and the variable cost is 40p on each of the 3,000 rolls.
- So a roll costs the bakery 60p to make at that output, and the same three lines fill in every other row of the table.
| Rolls a week | Fixed cost | Variable cost | Total cost | Average cost |
|---|---|---|---|---|
| 1,000 | £600 | £400 | £1,000 | £1.00 |
| 2,000 | £600 | £800 | £1,400 | £0.70 |
| 3,000 | £600 | £1,200 | £1,800 | £0.60 |
| 4,000 | £600 | £1,600 | £2,200 | £0.55 |
Average cost falls as fixed costs spread thinner
- The £600 is spread over more rolls at every step, so the fixed cost carried by each roll falls from 60p at 1,000 rolls to 15p at 4,000.
- The variable cost carried by each roll stays at 40p throughout, because every extra roll needs the same pastry and filling as the one before it.
- Average cost is those two figures added, which is why it falls from £1.00 to 55p while total cost climbs from £1,000 to £2,200.
- The bakery is spending more money in total and less money on each roll, and those are two different quantities.
- Each fall is smaller than the one before, since sharing £600 over 3,000 rolls rather than 2,000 saves 10p a roll while sharing it over 4,000 rather than 3,000 saves only 5p, so a drawn average cost curve slopes down and flattens as it goes.
- Average cost stops falling once the bakery has to pay overtime or fire up a second oven, because the variable cost on each roll then starts to climb.
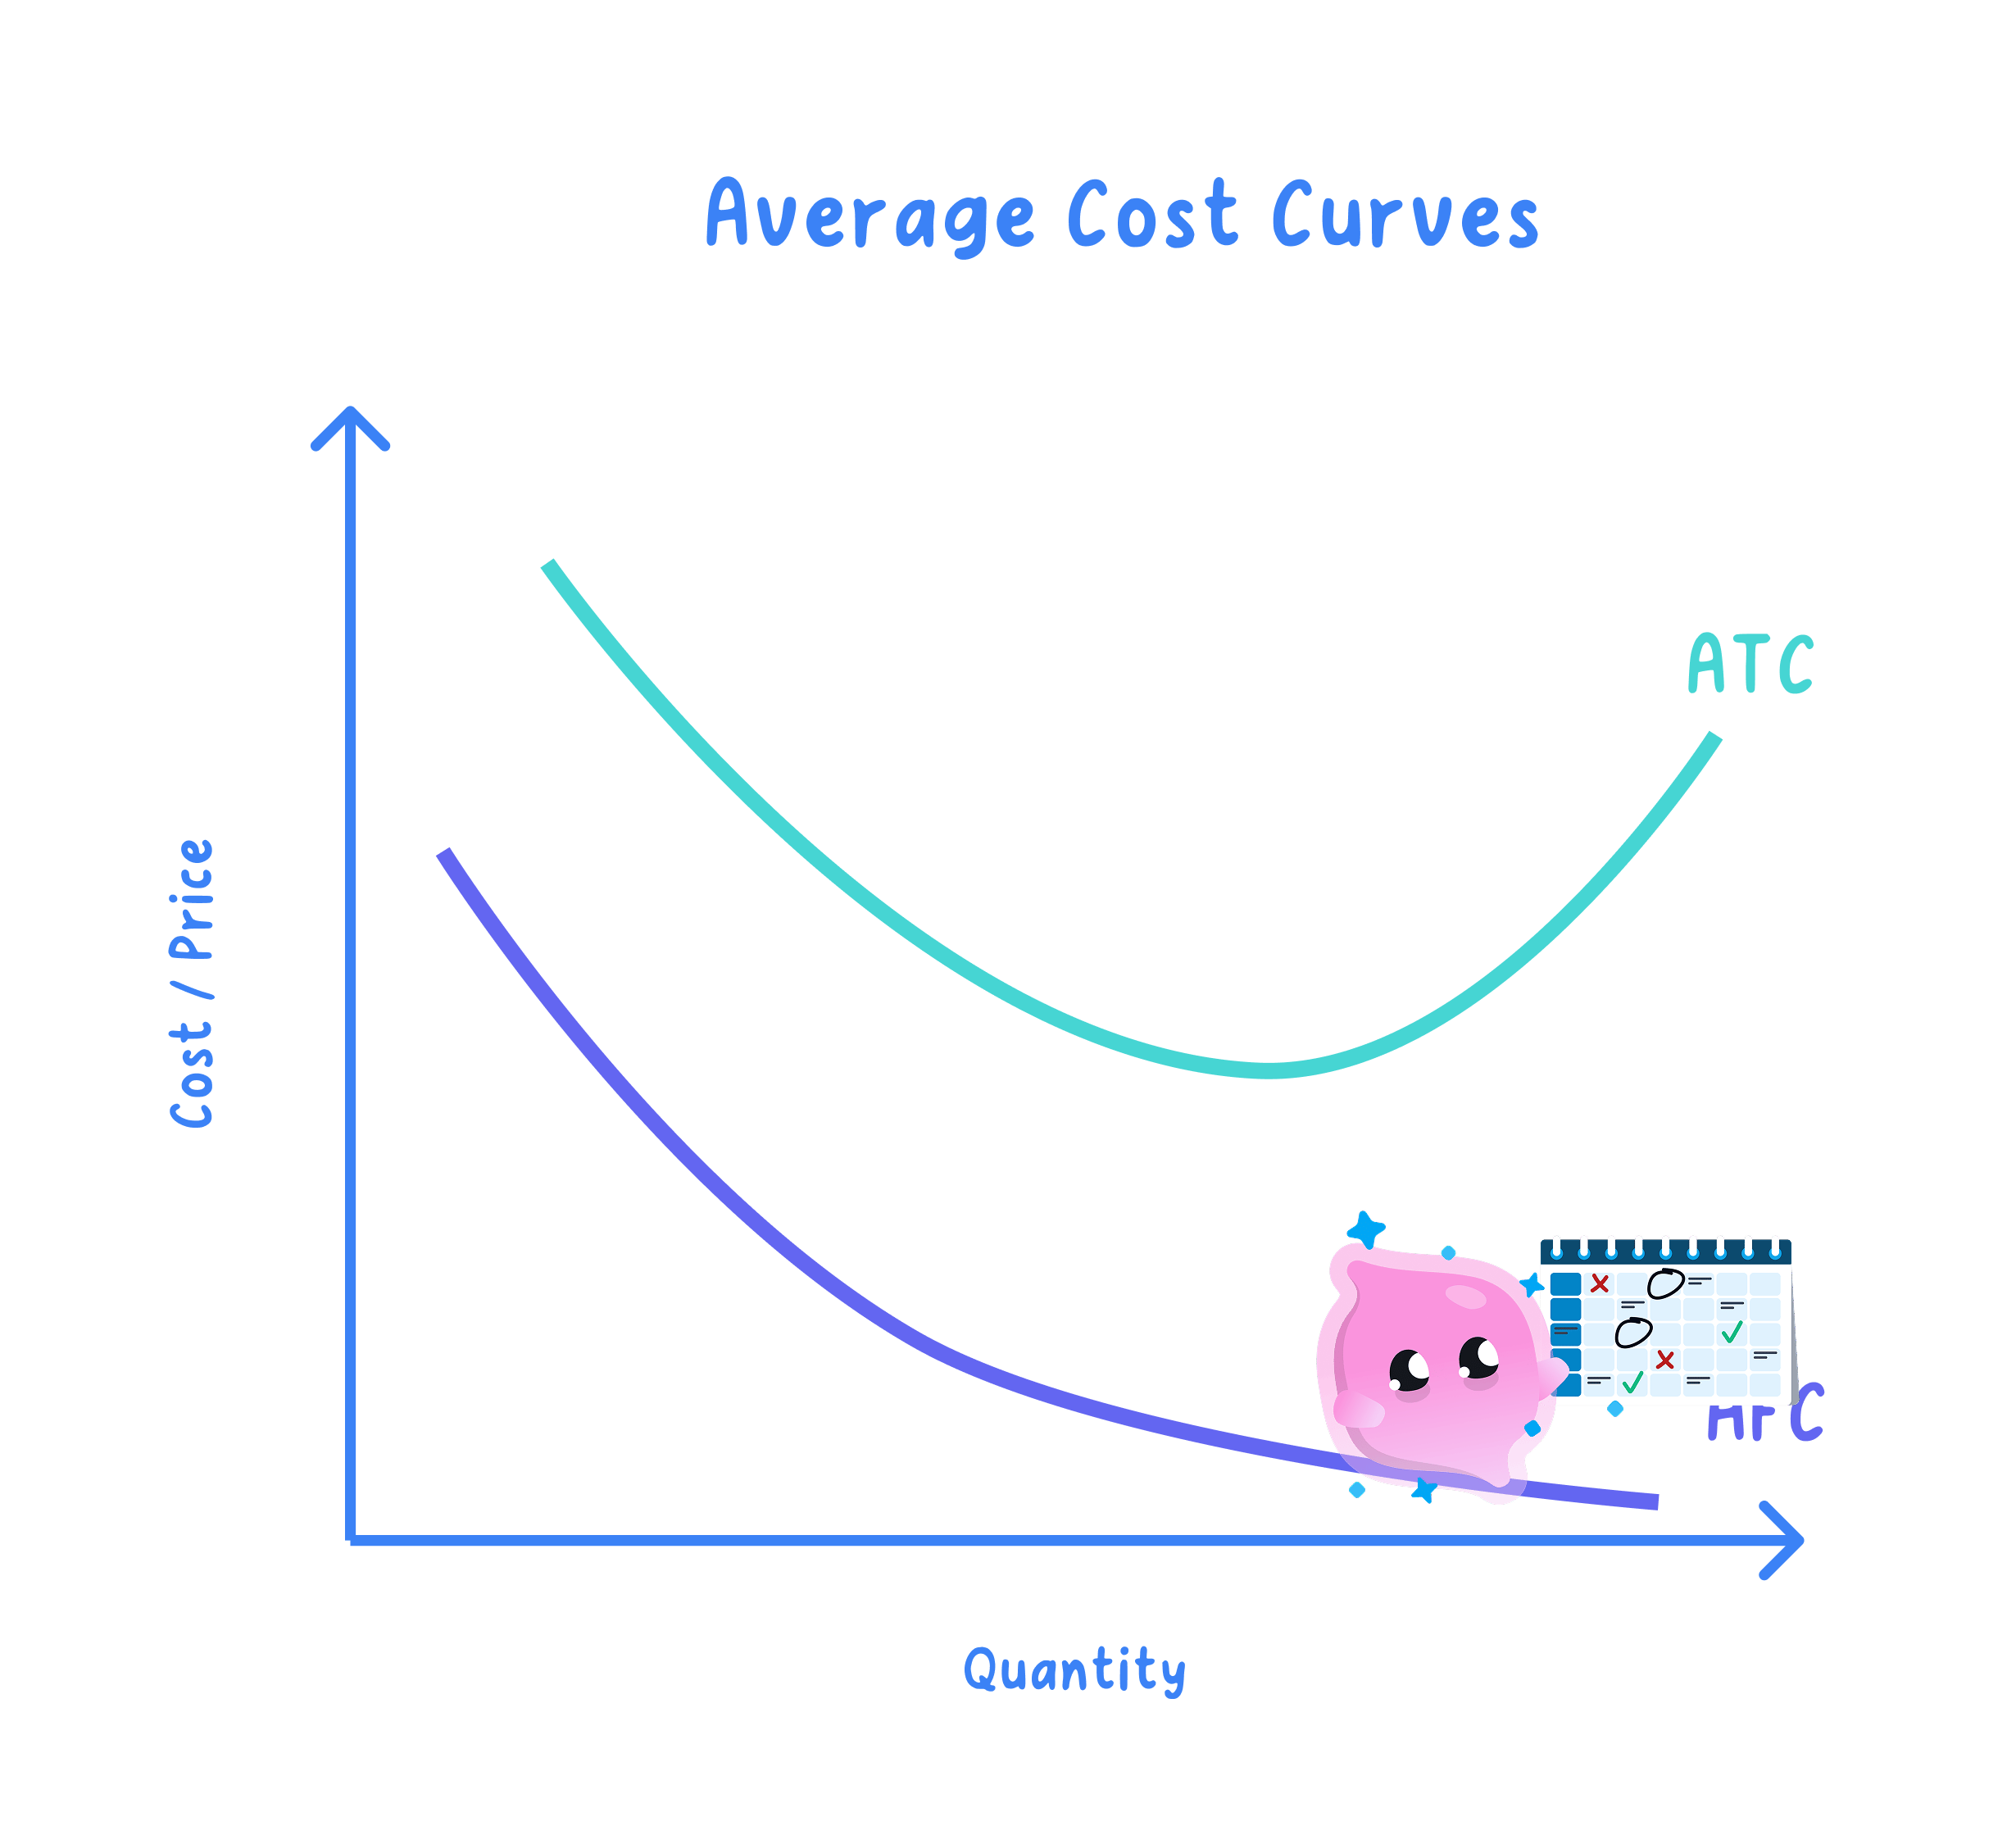
Multiply price by quantity for total revenue
Total revenue: all the money a firm receives from selling its output over a period, before any costs are taken off.
Average revenue: total revenue divided by the quantity sold, which is what one unit brought in on average.
- The two lines of arithmetic are these:
- Average revenue equals the price whenever every unit sells at the same price, so a question can hand you the price and expect average revenue back with no working at all.
- It drops below the shelf price as soon as some units go at a discount, so an end of day price cut pulls the average down without the shelf price changing at all.
- Multiply price by quantity and never add them, since £1.20 and 3,000 rolls are measured in different units.
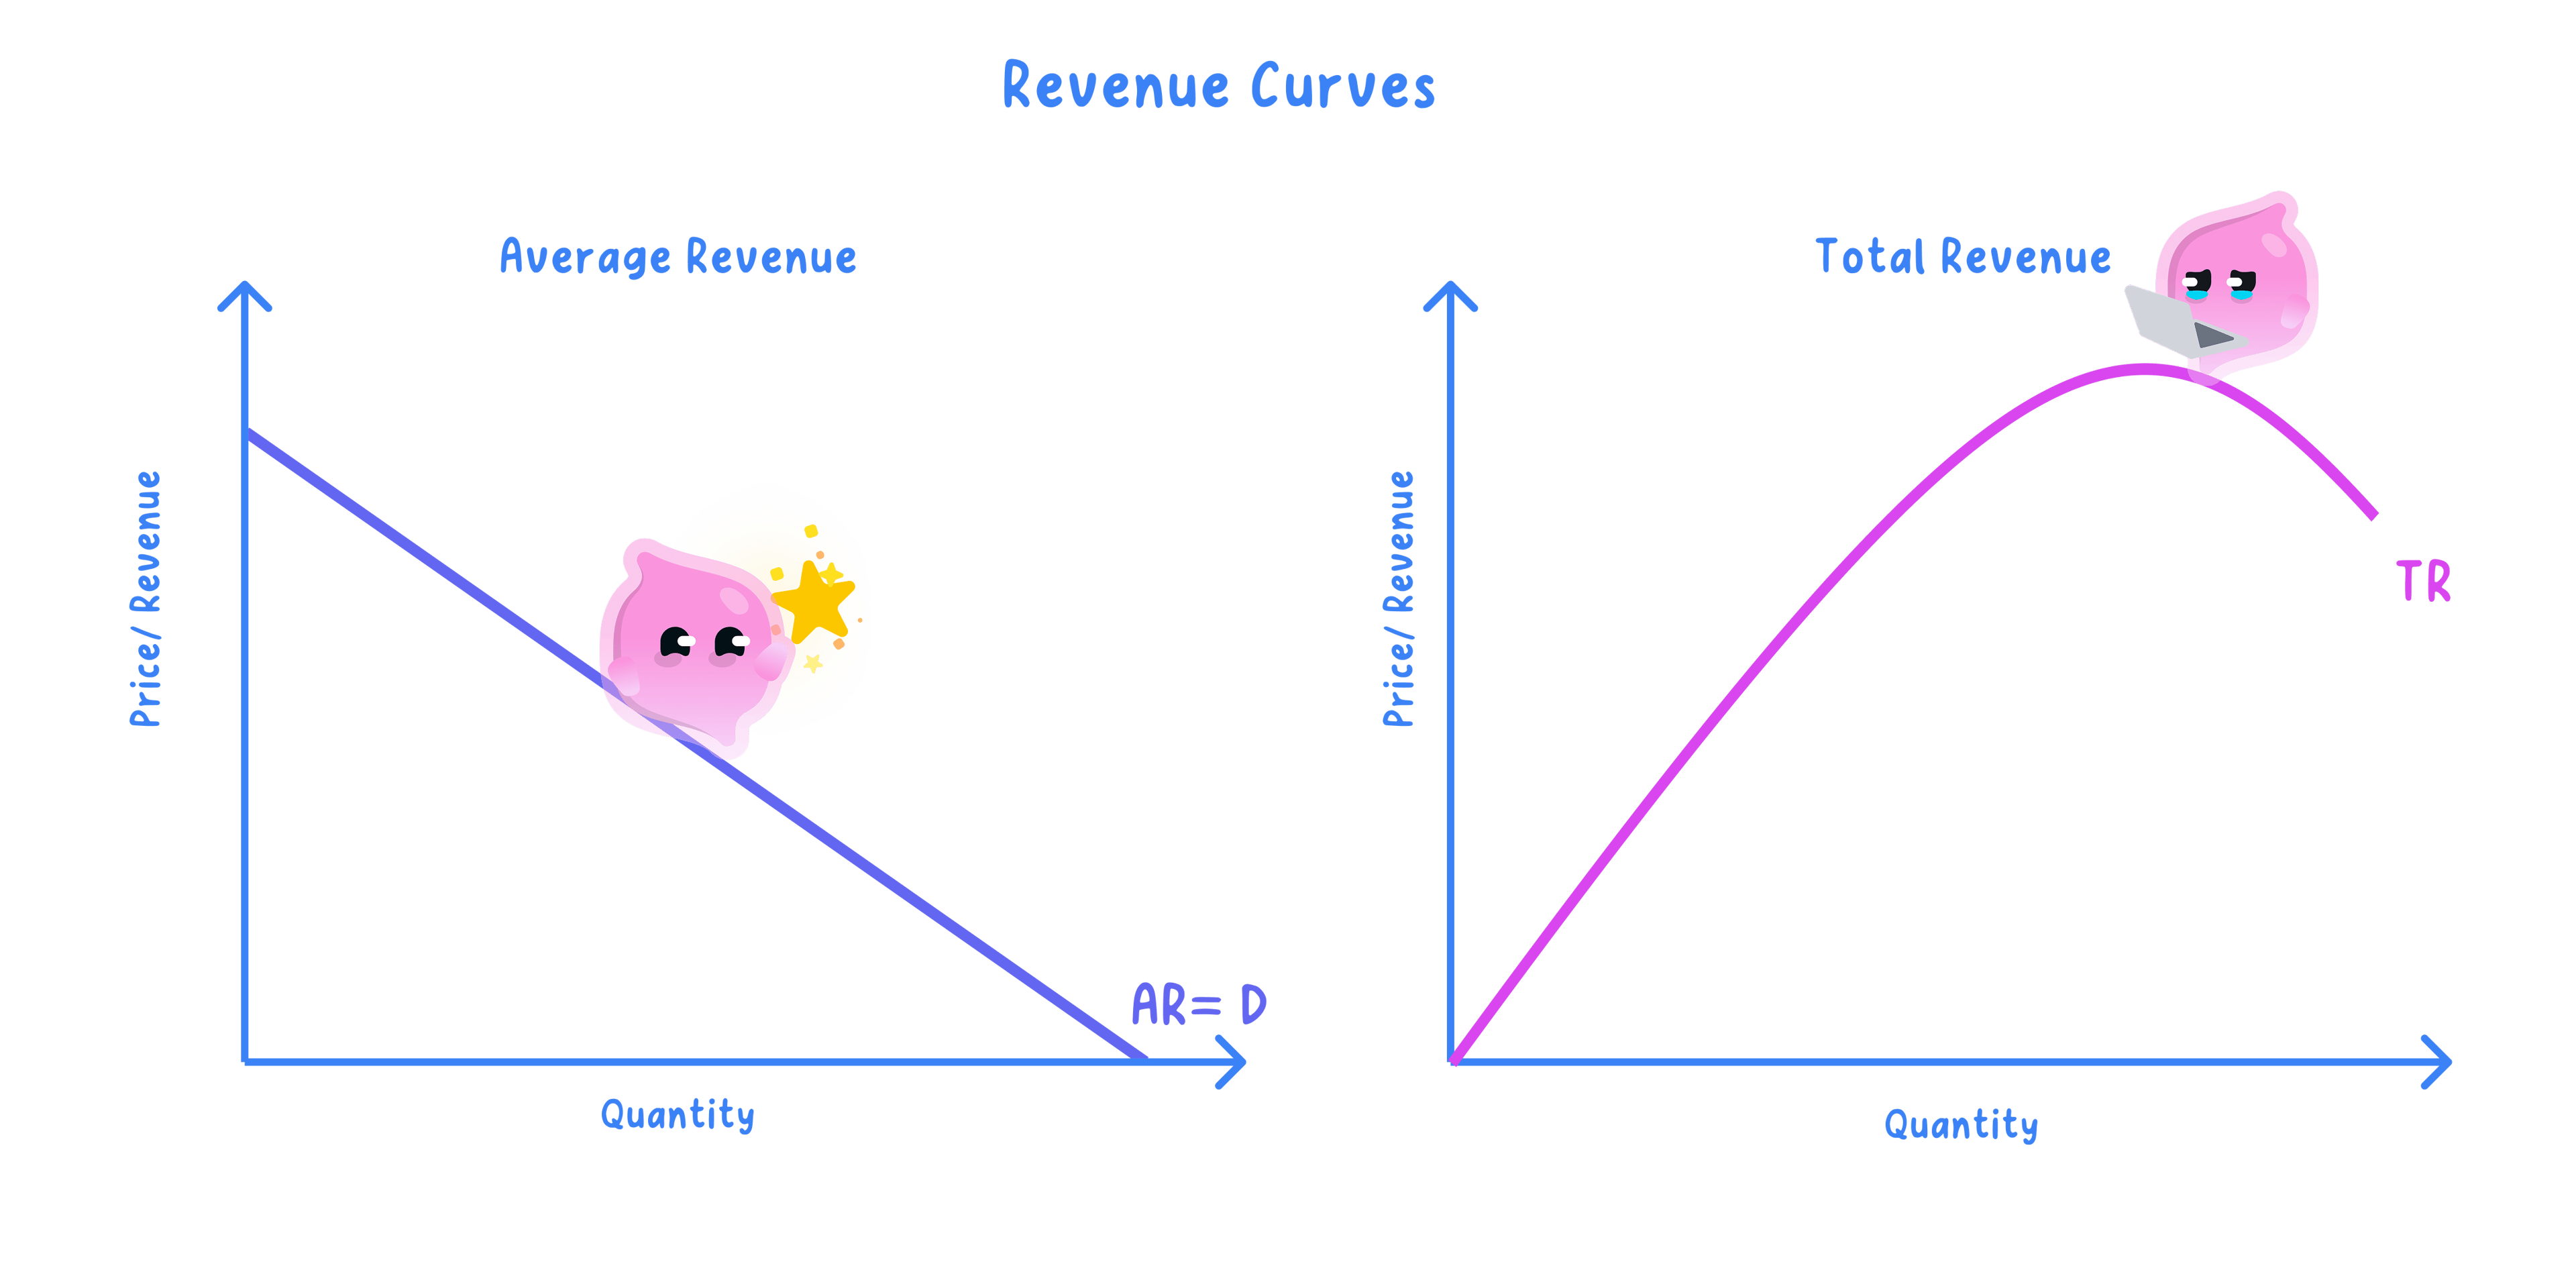
A falling price makes total revenue rise then fall
- When every unit sells at the same price, average revenue stays equal to that price and total revenue rises in step with the quantity sold, which is the bakery case the article's own arithmetic uses.
- When a firm has to lower its price to sell more, the price it can charge at each quantity is what demand shows, so its average revenue is the same thing as the demand it faces, which is what "AR = D" means.
- In that second case total revenue rises at first, reaches a peak and then falls. The reason is price elasticity of demand, which is covered in 1.3.5c: while demand is price elastic the extra units sold outweigh the lower price and revenue rises; once demand is price inelastic the price cut costs more than the extra units bring in, so revenue falls.
- The peak is where those two effects balance.
What is left once total costs are taken off total revenue is section 1.4.1c.
- Revenue is not profit, because nothing has yet been taken off for the pastry, the rent or the staff.
- Divide by output for an average cost and by quantity for an average revenue, never by the price.
- Do not multiply a fixed cost by output, because the figure you are given is already the total.
The same bakery's revenue, at one price then two
- The bakery sells its rolls at £1.20 and, at the output levels in the cost table, sells everything it bakes.
- The second scenario is a week when it clears the last 1,000 rolls at a 60p end of day price, which is where average revenue parts company with the shelf price.
- Three thousand rolls, all at £1.20: the same price is charged on every roll sold.
- Average revenue has come back as the price, exactly as it must when every unit sells for the same amount.
| Rolls sold | Price | Total revenue | Average revenue |
|---|---|---|---|
| 1,000 | £1.20 | £1,200 | £1.20 |
| 2,000 | £1.20 | £2,400 | £1.20 |
| 3,000 | £1.20 | £3,600 | £1.20 |
| 4,000 | £1.20 | £4,800 | £1.20 |
- The same week, clearing the last 1,000 rolls at 60p: it bakes 4,000 rolls in total, selling 3,000 at the full £1.20 price and discounting the final 1,000.
- Average revenue of £1.05 sits below the £1.20 shelf price, which is exactly what a discount on some units does to the average.
Work forward from whichever figure you are given
- Given fixed cost and variable cost, add them for total cost and then divide by output for average cost.
- Given total cost and output only, divide for average cost and do not try to split the total back into its fixed and variable parts.
- Given average cost and output, multiply to recover the total: total cost=average cost×output\text{total cost} = \text{average cost} \times \text{output}total cost=average cost×output.
- Given total revenue and quantity, divide for average revenue, and given the price instead, average revenue is that price already.
- Check the revenue side by multiplying average revenue back by quantity, which should return total revenue.
- Turn a per-unit variable cost into a total (multiply by output) before adding the fixed cost.
- Fill a table's total columns before its average columns, since every average needs its total.
- Check an average cost by adding fixed cost per unit to variable cost per unit.
- State the formulae for total cost, average cost, total revenue and average revenue.
- Fixed costs are £600 a week and the variable cost is 40p a roll: what are total cost and average cost at 2,000 rolls?
- Why does average cost fall as output rises even though total cost is going up?
- A stall sells 4,000 rolls at £1.20 each: what are its total revenue and its average revenue?
- Total revenue is £3,000 from 3,000 rolls: what is average revenue, and why need it not equal the shelf price?
1.4.1c Calculating profit
Profit is revenue left after total costs
Profit: what is left when total costs are taken away from total revenue, so profit=total revenue−total costs\text{profit} = \text{total revenue} - \text{total costs}profit=total revenue−total costs.
Loss: the shortfall when total costs come to more than total revenue, which is the same subtraction with a negative answer.
- Both figures have to cover the same period, so a year of revenue goes with a year of costs and a week with a week.
- Profit is the reward an owner takes for putting money at risk, and it is also the money the firm reinvests in machinery, premises and staff.
- A firm whose revenue exactly matches its total costs earns neither a profit nor a loss and is still paying every bill, so a year at zero is not the same as failing.
How total revenue, total cost and average cost are each worked out is section 1.4.1b.
- Revenue is not profit, so take total costs off before you write any profit figure.
- Only total costs go in the formula, so multiply an average cost by output first.
- A negative answer is a loss of that amount, never a profit of minus something.
One workshop's profit in a good and bad year
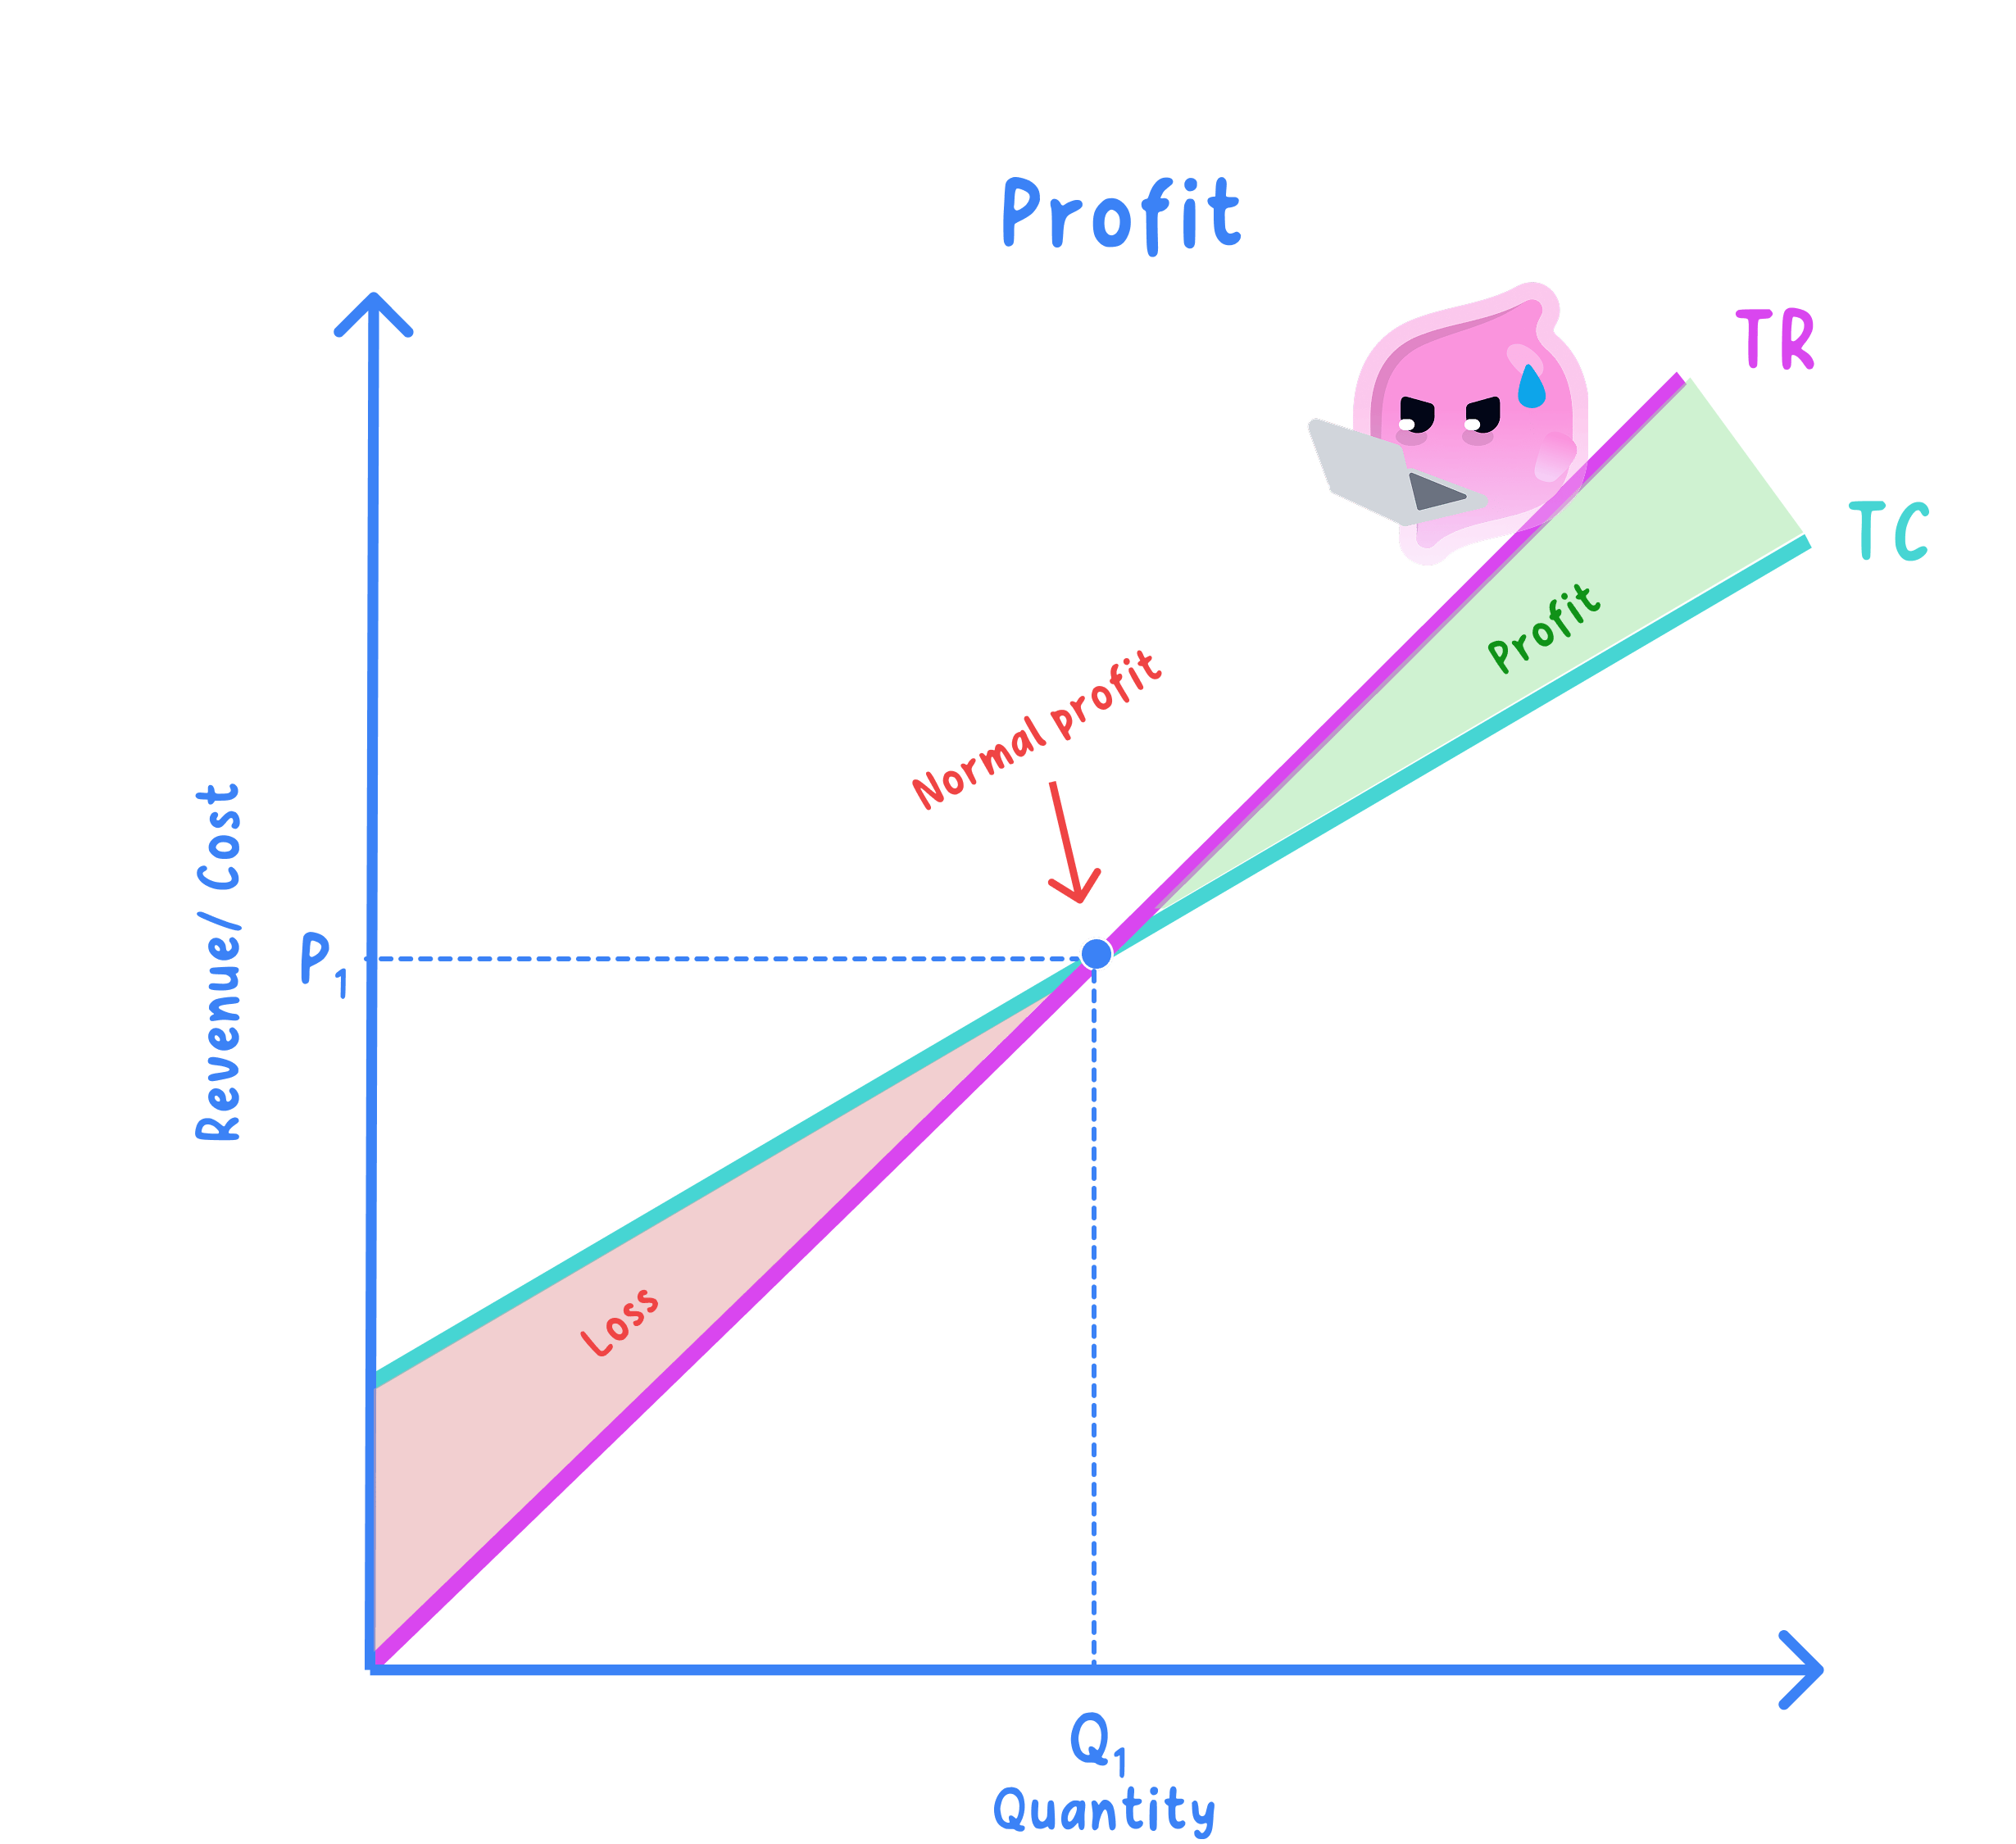
- A workshop building bicycle frames has fixed costs of £30,000 a year for its unit, its business rates and the lease on its machinery, and every frame adds £15 of variable cost in steel, paint and welders' hours.
- It sells frames at £25 and made 4,000 of them last year, then found orders down to 2,500 this year at the same price.
- The £30,000 falls due either way, which is what makes the two years look so different.
- The good year, 4,000 frames at £25: build the revenue, then the costs, then subtract.
- Average cost was £22.50 a frame against the £25 price, so each frame left £2.50 behind and 4,000 of them left the £10,000.
- The bad year, 2,500 frames at the same £25: only the variable side of the costs comes down with the orders.
- The answer is negative, so the workshop made a loss of £5,000, and the reason is that average cost climbed to £27.00 a frame while the price stayed at £25.
Two routes raise profit: lower cost, higher revenue
- Reducing average cost widens the gap from below, since every pound taken off what a unit costs to make stays inside the firm.
- A firm does it by buying materials more cheaply, by getting more output from the same workers, or by spreading its fixed costs over a larger output.
- Nissan's Sunderland plant is the standard UK example, because building hundreds of thousands of cars on one site spreads the cost of the press shop and the paint line very thinly indeed.
- Increasing revenue widens the gap from above, by selling more units, by charging more where buyers will stay, or by doing both at once.
- Selling more units pulls both routes together, because the extra output also spreads the fixed costs and so drags average cost down on its own.
- Neither route is free, since a cheaper supplier can mean a worse frame and a higher price can send buyers to a rival.
- They can also pull against each other, as cutting the price to shift more units only raises revenue if the extra sales more than make up for the lower price charged on every unit.
Both routes, worked on the same workshop
- Start from the good year again, 4,000 frames at £25 with £30,000 of fixed costs and £15 of variable cost a frame, which gave the £10,000 of profit.
- Change one thing at a time, so the movement in the profit figure can be traced to the route rather than guessed at.
- Route one, a lower average cost: a new steel contract cuts the variable cost from £15 to £13 a frame, with output and price untouched.
- Average cost has fallen from £22.50 to £20.50 and profit has risen by exactly the £2 saved on each of 4,000 frames.
- Route two, a larger revenue: a new stockist lifts sales from 4,000 to 5,000 frames at the same £25, with the variable cost back at £15.
- Profit has doubled to £20,000, which is the £10 each extra frame leaves once its own £15 is paid, and average cost has fallen to £21.00 as well, so raising output pulled both routes at once.
Rising revenue does not mean rising profit
- Revenue is the money coming in at the top and profit is what survives the costs, so the two move together only while costs stand still.
- A firm can raise its price yet cut its variable cost by so little that a rival undercuts it, or hold its price steady while overtime and rush deliveries push costs up faster than the extra sales pay for.
- So a firm announcing record sales has told you nothing about whether it made money, and a change in profit is always the difference between two changes.
- Drawn against output, profit is the vertical gap between the total revenue line and the total cost line, wherever revenue is the higher of the two.
- The two lines cross where the firm breaks even, which for this workshop is 3,000 frames, and below that output it loses money however hard it works.
- Write profit = total revenue minus total costs before you substitute, then build each total on its own line.
- Keep the £ sign on every figure, and label the answer profit or loss.
- Sense-check the size: a profit bigger than revenue means a figure is in the wrong place.
- State the formula for profit.
- Total revenue is £62,500 and total costs are £67,500: what is the result, and how should it be written?
- A workshop sells 4,000 frames at £25 with fixed costs of £30,000 and a variable cost of £15 a frame: what is its profit?
- Name the two routes to a higher profit that AQA gives.
- Explain how selling more units can pull average cost down as well as pushing revenue up.
1.4.1d Profit as an incentive to produce
Profit decides whether a producer bothers at all
Profit motive: the drive to earn the largest possible surplus of revenue over costs, which is what decides whether a private firm supplies a good at all and how much of it.
- Nobody in a market economy is obliged to produce anything, so something has to make it worth a producer's while to commit resources.
- That something has to be substantial, because a producer takes a risk, paying wages, rent and materials before knowing whether the output will sell.
- Profit is also the source of the money for expansion, since profit kept back in the business pays for extra machines, vans or premises without borrowing.
- Loss making activity cannot go on indefinitely, because the owner is covering the shortfall out of savings or debt.
- The strength of the incentive depends on the size of the gap between price and cost per unit, which is why the same firm expands one product line while closing another.
How total costs, total revenue and profit are calculated is 1.4.1b and 1.4.1c; this section takes those figures as given.
A higher price widens profit if costs hold steady
- A higher price means more total revenue from exactly the same quantity sold, because every unit now brings in more money.
- If the cost of producing a unit is unchanged, all of that extra revenue becomes extra profit per unit, which is the price minus the cost of producing a unit and exactly the number a producer looks at.
- A modest rise in price can multiply profit per unit several times over, because what widens is the narrow gap between price and cost rather than the price itself.
- The condition matters as much as the chain, because a price rise that is caused by rising costs leaves the gap no wider and brings no extra output.
- A dairy farmer: the farm gate milk price is £0.35 a litre, it costs £0.32 a litre to produce, and the herd yields 900,000 litres a year.
- The price then rises to £0.45 a litre while feed, labour and vet costs stay where they were.
- A price rise of about 29 per cent has turned £27,000 into £117,000, which is why the farmer now thinks about adding cows rather than selling them.
Wider profit per unit is why supply slopes upward
- Expanding output costs money, so a producer only does it when the extra revenue expected is bigger than the extra cost.
- A wider gap between price and cost per unit means more of the expensive extra output becomes worth making, such as overtime shifts, older machines or poorer land.
- Overtime is paid at a higher hourly rate, so an extra hour is only worth buying when the price of the output covers it.
- Existing firms therefore raise the quantity supplied as price rises, and new firms enter because the higher price now covers the cost of setting up.
- Expansion also takes time, since planting a crop, training staff, restocking a flock or building a factory cannot be done in the week the price moves.
- A higher price only widens profit per unit if costs are unchanged.
- UK electricity, 2021 to 2023: wholesale prices rose sharply, and developers brought forward solar farms and battery storage while North Sea operators reworked fields that had not been worth producing at the old price.
- Eggs: UK egg prices rose through 2022 and 2023 after producers had cut their flocks, and it was the higher price that persuaded them to restock the sheds.
- In every case the extra output followed the price rather than causing it, which is the direction the exam is testing.
Falling profit runs the chain backwards
- Firms cut output first, by ending overtime, dropping a shift or running one production line instead of three.
- Exit comes last, when the price no longer covers costs at any output the firm can produce, as it did for the nearly thirty small UK energy suppliers that failed in 2021 and 2022 while the Ofgem price cap held their price below the wholesale cost they were paying.
- What is meant by the profit motive?
- A firm sells at £0.45 a unit and its cost per unit is £0.32, so what is its profit per unit?
- Why does a higher price raise profit per unit only if costs are unchanged?
- Explain why the profit incentive makes the supply curve slope upwards.
- Give one UK example of a price rise that brought extra output.
1.4.1e Moral and ethical considerations
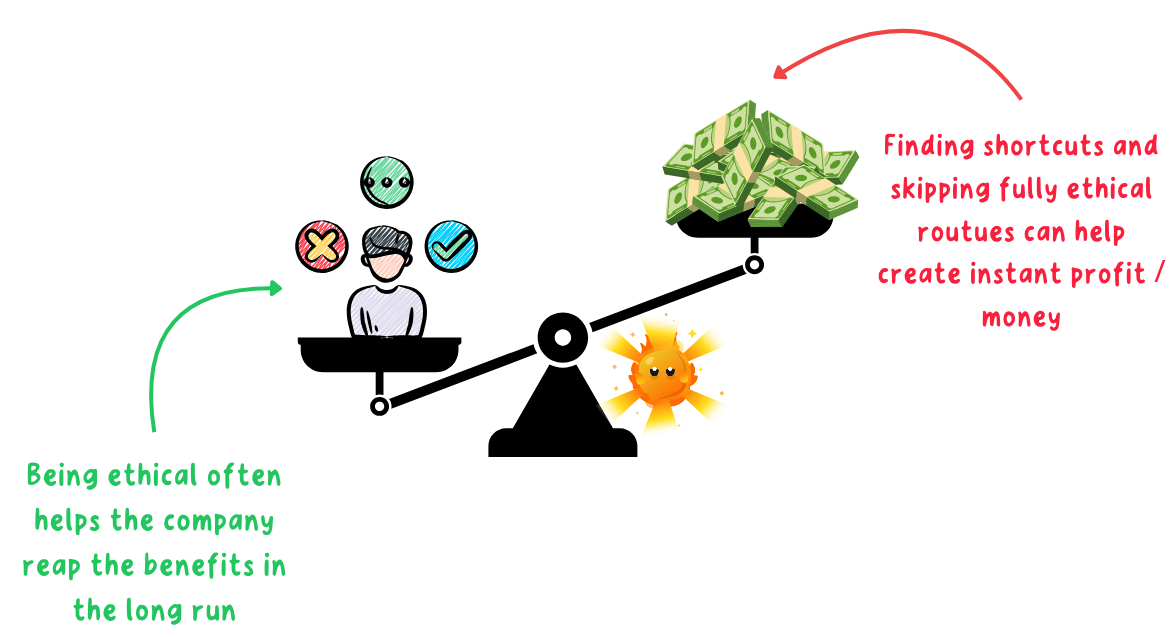
The cheapest way to produce is not always right
Ethical behaviour: acting in the way most people would judge to be morally right, such as paying suppliers fairly, keeping workers safe and limiting damage to the environment, even where a cheaper alternative is available.
Stakeholder: any group affected by what a producer does, including its owners, its workers, its customers, its suppliers, the local community and the environment.
- The conflict exists because the groups a firm affects are not the group that owns it, so a cost the firm avoids usually lands on somebody else.
- Cutting a cost is the same action whatever the cost happens to be, so the pressure that pushes a firm to waste less packaging also pushes it to pay less and inspect less.
- Nothing in the profit calculation charges a producer for the harm it causes, which is why the law and the regulators have to do it instead.
How profit itself is calculated is 1.4.1c, and why the prospect of profit drives producers to expand is 1.4.1d.
Cutting labour or environmental costs lifts profit
- Wages and working conditions are the largest cost most producers control, so holding pay at the legal minimum, using insecure contracts or pressing a supplier for a lower price per garment raises profit per unit directly.
- An independent review of Boohoo in 2020 found serious failings in its Leicester supply chain, including workers paid below the minimum wage, and the same cost pressure sits behind fast fashion prices at Primark and its rivals.
- The environment is cheaper to damage than to protect, since dumping waste, using single use plastic packaging and burning the cheapest fuel all cut the producer's cost while the cost of the damage falls on everyone.
- English water companies have repeatedly released untreated sewage into rivers and the sea rather than spend on treatment capacity, and Ofwat has fined them for it.
Misleading customers boosts revenue, squeezing suppliers cuts cost
- Honesty towards consumers: advertising that overstates what a product does, charges that only appear at checkout and vague environmental claims all raise revenue without raising cost.
- Greenwashing is the version the Competition and Markets Authority now polices, where a product is sold as recyclable, natural or carbon neutral on evidence that will not stand up.
- Suppliers: a large buyer can squeeze the price it pays a small supplier, and UK dairy farmers have at times been paid less per litre than the milk cost them to produce, which is why the Groceries Code Adjudicator exists.
- Animal welfare: cheaper eggs, chicken and pork come from more intensive systems, so a producer choosing free range is deliberately choosing a higher cost per unit.
- Fast fashion: a £6 t-shirt has to be designed, cut, stitched, finished, shipped and sold with a profit still left over, so the pressure to cut every cost falls hardest on the wages paid where it is made.
- The retailer usually does not own the factory but buys from suppliers bidding against each other on price, and that distance makes the conflict easy to ignore until an investigation makes it public.
- Primark and Boohoo have both since published supplier lists and audit findings and joined monitoring schemes, which is a real cost accepted to protect the brand.
Acting ethically can also raise profit
- Reputation is an asset, so a scandal that reaches the news costs a firm sales for years while a clean record supports a higher price.
- Some consumers will pay more for a product they trust, which is why Fairtrade chocolate, free range eggs and British sourced meat sell alongside the cheaper versions instead of being driven out by them.
- Penalties are avoided, so a producer that meets environmental, safety and advertising rules escapes fines, clean up orders and the management time an investigation swallows.
- Fairtrade: a chocolate bar carrying the mark guarantees the cocoa farmer a minimum price plus a premium, so the bar costs the manufacturer more to make.
- Shoppers who choose it accept a higher shelf price, so the extra cost is recovered in the price rather than taken out of profit.
- The Co-op moved its own label chocolate to Fairtrade cocoa and uses that sourcing in its advertising, which only works because enough of its customers care.
Whether profit and ethics conflict depends on the market
- It depends on how well informed consumers are, because a shopper who cannot see how a product was made cannot reward the firm that made it well, so the ethical producer carries the cost for nothing.
- It depends on whether consumers will pay more, since a household on a tight budget buys on price, which is why the ethical premium shrinks when incomes are squeezed.
- It depends on how tight the regulation is, because a rule enforced with real fines turns an ethical cost into an unavoidable cost for every firm at once, so no rival gains by ignoring it.
Judgement: the conflict is real but it is not fixed, because it narrows wherever consumers can see what a producer does and regulation makes behaving badly costly, so the useful question is never whether firms are greedy but whether the market they sell in makes good behaviour pay.
Regulation and information close a genuine conflict
- The law sets a floor under every producer, through the National Minimum Wage and National Living Wage, health and safety law and environmental permits.
- Information does the rest, since labelling, published audits and investigative journalism let consumers act on what they now know.
- What is meant by ethical behaviour by a producer?
- Name three stakeholder groups whose interests can conflict with higher profit.
- Explain one way in which cutting a cost raises profit but harms a stakeholder.
- Give two ways in which acting ethically can raise a producer's profit.
- Name one UK regulator and the behaviour it acts against.
1.4.2a Production versus productivity
Production is a total; productivity is a ratio
Production: the total quantity of goods or services a firm or an economy makes in a given period.
Productivity: the output produced per unit of input in a given period, most often output per worker or output per worker per hour.

- Production is counted in units of output, such as 4,800 loaves a week or 500,000 cars a year, and says nothing about how many workers it took.
- Productivity is a ratio, so it always carries its input and its period, as in loaves per worker per week.
- Labour productivity divides the total by the workers who made it: labour productivity=total outputnumber of workers\text{labour productivity} = \frac{\text{total output}}{\text{number of workers}}labour productivity=number of workerstotal output.
- Dividing by hours worked instead gives output per worker per hour, the measure the Office for National Statistics uses to compare the UK with other countries.
- Any input works the same way, so output per machine, output per hectare and sales per shop are all productivity measures.
- A bakery: 6 bakers produce 4,800 loaves in a week.
- Each baker works a 40-hour week, so the same output per hour is:
- Production is 4,800 loaves, while productivity is 800 a week or 20 an hour, and all three numbers describe the identical bakery, so check the units before comparing any two figures.
Production can rise while productivity falls
- Hiring raises the top and the bottom of the fraction at once, so productivity moves whichever way the larger percentage change points.
- If output rises by a smaller percentage than the workforce, output per worker falls even though the firm is making more than it ever has.
- That is the normal result of crowding extra staff into the same premises, because the newcomers share machines, tools and supervision.
- A furniture workshop: 8 joiners produce 400 chairs a week.
- Four more joiners are hired and weekly output rises to 480 chairs, so production is up by 20 per cent.
- The workforce rose by 50 per cent but output by only 20 per cent, so productivity fell from 50 to 40 chairs, a fall of 20 per cent.
- The workshop then cuts back to 6 joiners and weekly output falls to 360 chairs.
- Production is now 25 per cent below its peak while productivity, at 60 chairs, is the highest of the three weeks.
Redundancies reverse the arithmetic, so neither proves the other
- Redundancies work in reverse: total output falls, but if the least productive work is what goes, output per worker rises.
- So record output is not proof of higher productivity, and falling output is not proof of lower productivity.
- Production is a total, productivity is a ratio, so never use one word for the other.
- Output up is not productivity up: the firm may simply have hired more people.
The distinction decides what a figure actually tells you
- Only productivity tells you whether the same land, labour and capital is being used better, which is what makes a firm cheaper to run rather than simply bigger.
- It is also the only fair comparison between firms of different sizes, since total output merely tells you which is larger.
- It is not a measure of how hard people work, because better machines, training and organisation raise output per worker without anyone working harder.
- A country works the same way, since an economy can raise total output just by employing more people, and raising output per worker is what lets pay rise without prices rising to match.
- UK output per hour has grown unusually slowly since 2008, which is why weak productivity is blamed for weak growth in real pay.
What raises productivity, and what a firm and a country gain from it, is 1.4.2b.
- Show the division (total output over number of workers) and give the answer with its units.
- If both output and staff have changed, compare the two percentage changes to settle the direction.
- Write "output per worker", not the vaguer "efficiency".
- What is the difference between production and productivity?
- State the calculation for labour productivity.
- A print shop produces 1,200 leaflets a day with 4 workers. What is its labour productivity?
- A workshop goes from 8 workers making 400 chairs to 12 making 480. What has happened to production and to productivity?
- Why can a firm making redundancies see its productivity rise?
1.4.2b Factors and benefits of productivity
Training, capital and motivation each lift output per worker
Production, productivity and the difference between them are 1.4.2a. This article takes output per worker as given and asks first what moves it, then what it is worth.

- Education and training: a trained worker finishes the task faster and scraps less material, so output per worker rises without a single extra hour being worked.
- Nissan's Sunderland plant runs continuous on-the-job training alongside team working, and became one of the most productive car plants in Europe measured by cars per worker.
- Capital investment and technology: a faster machine, a robot or better software hands each worker more output in the same time, and this is the single largest source of productivity growth.
- Self-service checkouts let one Tesco colleague supervise six tills, though the investment has to be paid for before any of that saving appears.
- Worker motivation: fair pay, bonuses, sick pay and decent conditions raise the effort a worker chooses to put into hours the firm is already paying for.
- Motivation also cuts absence and staff turnover, so fewer hours are lost and fewer new starters are working at learner speed.
- Management quality: good managers plan the layout, schedule maintenance and have materials waiting where they are needed, so less of each paid hour is spent waiting.
- Weak management is why two factories with identical machines and equally skilled workers can differ sharply in output per worker.
- Specialisation and the division of labour: splitting a process into separate tasks lets each worker repeat one until they are expert at it, with no time lost switching between tools.
- A Greggs shop works this way at lunchtime, with one person on the counter, one on the ovens and one on drinks.
- Infrastructure and the quality of inputs: roads, rail, broadband and reliable electricity decide how much of a worker's day is productive, which is why congestion and slow connections show up as lower output per worker.
- Better components matter too, since a worker reworking faulty parts turns fewer hours into finished output.
- Nissan Sunderland: heavy robot investment in the body shop has run alongside continuous training and team working since the plant opened in 1986.
- At its peak it built about 500,000 cars a year with roughly 7,000 staff, which is about 70 cars per worker per year; the same 500,000 cars with 10,000 staff would be 50 cars per worker, so identical production would cost far more in wages for every car.
- The gain came from capital, training and organisation together, which is why no single factor on its own explains a productivity record.
Benefits: more output, lower unit costs
- Wages, rent and machine costs are largely fixed across a week, so if the same bill produces more units, the cost of each unit falls.
- That cost per unit is the average cost, and it sets both the lowest price the firm could charge and the margin it earns at any price it does charge.
- A lower average cost hands the firm a choice: cut the price to win customers, hold the price and take a wider margin, or split the gain between the two.
- Nothing here needed the firm to get bigger, since the saving comes from using less input per unit rather than from producing on a larger scale.
- A bakery: 6 bakers are paid £600 a week each, so the wage bill is £3,600, and together they produce 4,800 loaves.
- A new oven and a day of training lift weekly output to 6,000 loaves, with the same 6 bakers on the same pay.
- Productivity rose by 25 per cent and labour cost per loaf fell by 20 per cent, and that is the link every benefit below runs through.
Lower unit costs benefit consumers, workers and the economy
- Consumers gain where competition forces the saving into the price, so the same income buys more.
- Where a firm has few rivals it can keep the saving as profit instead, so the gain to consumers is never automatic.
- Workers can be paid more, because a bakery getting 1,000 loaves from each baker instead of 800 can raise pay and still pay less in wages for every loaf.
- This is the only way real wages can rise right across an economy without prices rising to match.
- Firms become more competitive, since a lower cost per unit lets them undercut rivals on price or spend more on quality at the same price.
- International competitiveness improves the same way, so UK exporters can win orders against German or Chinese rivals on cost rather than needing a weaker pound to do it.
- Profit can rise even at an unchanged price, and that profit funds the next round of investment and training, which raises productivity again.
- The economy produces more from the same land, labour and capital, which is real economic growth rather than simply more people being employed.
- Higher output per person is what lifts average living standards, which is why the UK's slow productivity growth since 2008 has gone hand in hand with slow growth in real pay.
- Higher productivity is not higher production: output per worker can rise while total output falls.
- Lower unit costs are not automatically lower prices: a firm with few rivals keeps the saving as profit.
- A productivity gain is not an economy of scale: one is more output from the same input, the other a lower average cost from producing on a larger scale.
The benefits are real, but neither automatic nor instant
- The gain has to be paid for first, since machines, training and reorganisation all cost money before they save any.
- It can be shared unevenly, so shareholders may take it as profit while pay and prices stay exactly where they were.
- Raising output per worker can cost jobs in the short run, because the same output now needs fewer people to make it.
- It need not cost jobs overall, since lower prices raise the quantity demanded and the money saved is spent elsewhere, creating work there.
- Some ways of raising the figure damage other things, so cutting breaks or pushing line speeds lifts output per worker while raising accidents, defects and turnover.
- Measured productivity can also rise for the wrong reason, since making the least productive workers redundant raises the average without anything actually improving.
- Name five factors that influence productivity.
- How does better capital raise output per worker?
- Six bakers paid £600 each produce 6,000 loaves a week. What is the labour cost per loaf?
- Set out the chain from higher productivity to a lower price for the consumer.
- Give two benefits of higher productivity for workers.
1.4.3a Economies of scale and business behaviour
Higher production can lower the cost per unit
Economies of scale: a fall in the average cost of production as a firm raises its output.
Average cost: what it costs a firm to produce one unit of its output.
- The formula puts output underneath: average cost=total costoutput\text{average cost} = \frac{\text{total cost}}{\text{output}}average cost=outputtotal cost, so average cost falls as output rises whenever total cost rises by proportionally less than output does. This is the one sentence 1.4.3b and 1.4.3c both build on.
- Fixed costs are the clearest route, because rent, machinery, insurance and head office are paid whatever the output, so every extra unit carries a smaller share of them.
- Section 1.4.1b sets out fixed, variable, total and average cost in full, so all you need here is the single division.
- Total cost almost always rises as output rises, since more flour, more electricity and more hours are used, which is why the saving can only be seen per unit.
- The gain is captured only when the larger output is actually made and sold, because a half empty factory spreads its fixed costs over fewer units, not more.
- A bakery raising weekly output: fixed costs are £12,000 a week and each loaf uses £0.40 of flour, packaging and power.
- Total cost rose by £16,000 while output tripled, so every loaf now costs 40p less to make. That 40p is the economy of scale, and a student who looked only at the £16,000 would have concluded the opposite.
Cheaper units change how firms behave
- Growth becomes an objective in its own right, because a larger output is the only way to reach the lower average cost, so firms open branches, buy rivals and chase volume they do not immediately need.
- A large firm can undercut a small one and still profit, since a price leaving 10p on each of its units can leave a loss on each of the smaller rival's dearer units.
- Some firms cut price deliberately to win volume, because the extra sales lower average cost further, which pays for the next price cut, and Aldi has used that loop to take share from far larger grocers.
- The cost gap works as a barrier to entry, as a new firm necessarily starts small and so starts with a higher average cost than the firms it is trying to beat on price.
- Industries where the saving is large end up concentrated in a few big producers, which is why car assembly, water, electricity networks and groceries are dominated by a handful of names.
- Where the saving is small, as in hairdressing, plumbing and independent cafes, thousands of tiny firms survive side by side.
- Firms redesign what they make, favouring standard products in long runs, because standardisation is what makes the big machine and the long run possible in the first place.
- Nissan's Sunderland plant builds a few models in very high volume, so presses, paint shop and robots costing hundreds of millions of pounds are spread over roughly 300,000 vehicles a year.
- Aldi stocks around 2,000 lines against roughly 30,000 in a large Tesco, so each line is ordered in enormous quantity: both firms chose a narrow range on purpose, because that is what raises output per line and pulls average cost down.
- Amazon UK spreads the cost of writing its ordering software over every parcel it ships, so the cost per parcel of that software falls each time volume grows.
Growth brings lower costs, market power and finance
- Lower unit costs are the benefit AQA cares about most, and can be taken as a lower price to win customers or as a wider margin at the old price.
- Market power grows with size, so a bigger firm can press suppliers for better terms and raise its own price with less fear of losing customers.
- Finance becomes easier and cheaper, because a large firm has more assets to offer as security and can raise money by issuing shares or bonds, which is closed to a corner shop.
- Risk is spread once the firm sells several products in several places, so a bad year in one market no longer threatens the whole business.
- Survival improves, since a firm with lower average costs can trade through a price war or a recession that bankrupts higher cost rivals.
Growth costs control, flexibility and safety
- It becomes harder to manage and coordinate, because decisions one owner used to take alone now pass through layers of managers, and each layer adds delay and salary.
- Flexibility and personal service are lost, since a plant built for long runs cannot switch quickly to a new design and a national chain cannot know its customers the way a single shop does.
- Borrowing rises, and the interest is owed whether the extra output sells or not, so a firm expanding on debt into a falling market can be pushed into losses.
- Diseconomies of scale become a real risk, meaning average cost turns back upwards past a certain size, which is 1.4.3c.
- Growth by takeover is expensive in itself, because the buyer pays a premium for the target and then has to merge two workforces, two computer systems and two sets of habits.
- Bigger is not automatically cheaper: say why average cost falls in this particular firm.
- Rising sales revenue is not an economy of scale: the test is the cost of each unit.
- A cheaper supplier at unchanged output is not an economy of scale: scale means the fall came from producing more.
Whether growth pays off depends on the firm
- It depends on the industry, because scale is decisive where machinery is huge and products standard, as in car assembly or cement, and worth almost nothing to a plumber whose job differs in every house.
- It depends on whether the extra output can be sold, since a firm that produces more cheaply and then cannot shift the units has raised its costs and its stock, not lowered them.
- It depends on how the growth is paid for, because expansion funded from retained profit can be slowed if demand disappoints, while expansion funded by borrowing carries interest that cannot.
- It depends on how well the firm is organised, as splitting a large business into divisions with their own budgets can hold average cost down at sizes that would otherwise become unmanageable.
- It depends on whose interests you are judging, since owners collect the lower unit costs while customers gain only if competition forces the saving into prices, and workers may face a less personal employer.
Judgement: growth is worth its costs up to the output at which average cost stops falling, because the cost advantage is structural and permanent while most of the costs of growth are management problems a well run firm can fix, so the sensible target is the size that minimises average cost rather than the largest size the firm could reach.
Growth pays off until average cost stops falling
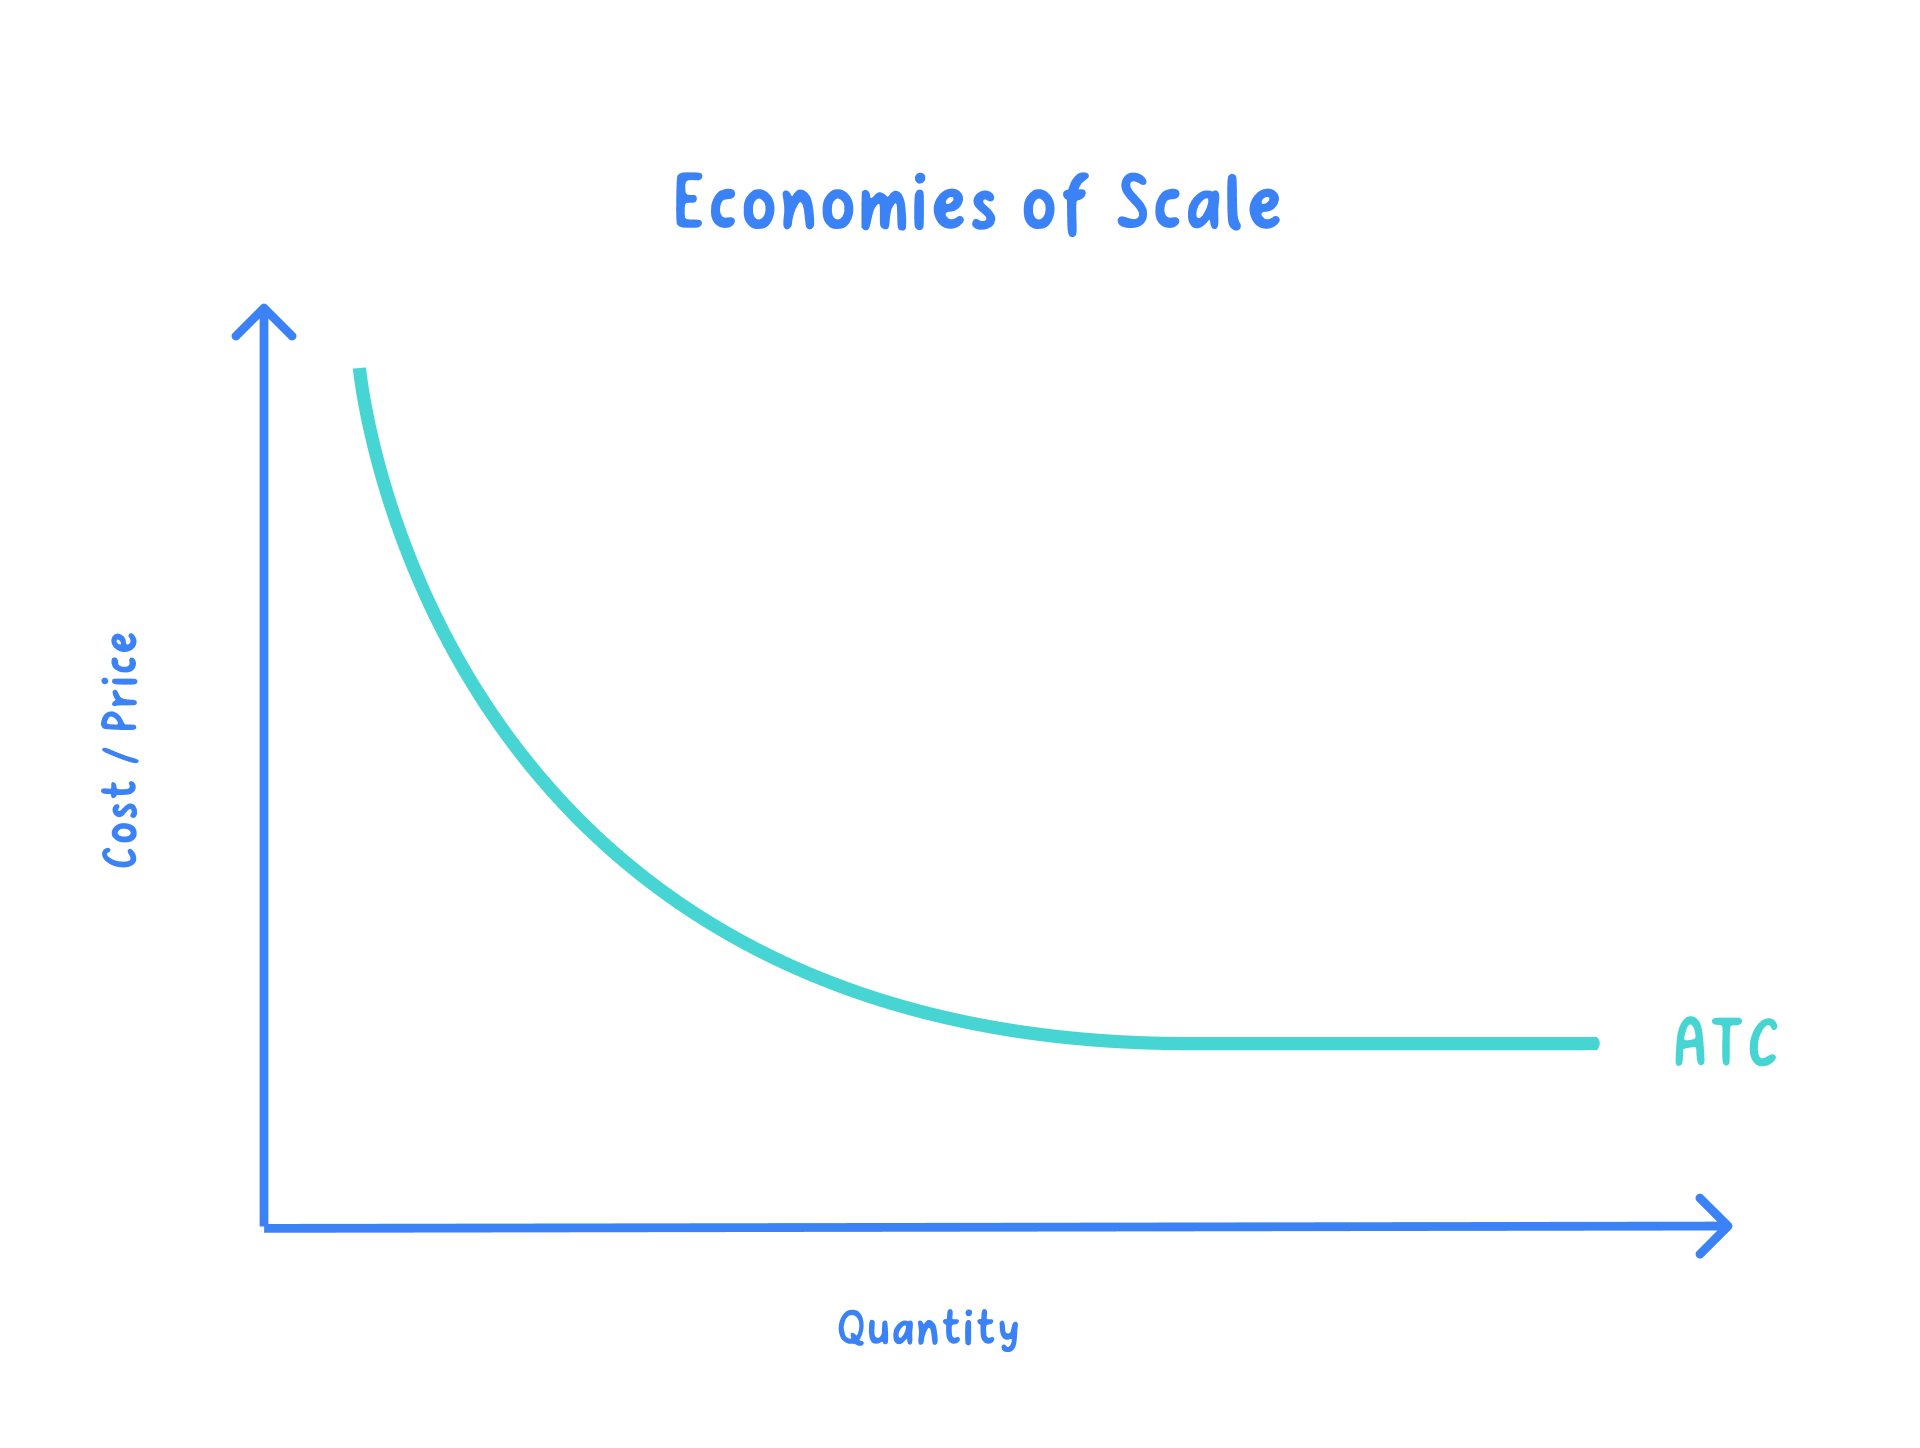
- Average cost sits on the vertical axis and output on the horizontal axis; the curve falls as economies of scale are captured, then reaches a minimum.
- That minimum is the output a firm chasing lower costs is aiming for; beyond it the curve turns upward into the U shape covered in 1.4.3c.
- Divide total cost by output at both given outputs and quote both average costs.
- For "evaluate", weigh the benefits of growth against its costs, then state what your judgement depends on.
- Judge how large the saving is likely to be for the given firm: decisive for a car plant, negligible for a hairdresser.
- Define an economy of scale.
- A bakery's total cost rises from £20,000 at 20,000 loaves a week to £36,000 at 60,000 loaves. What happens to average cost, and by how much?
- Give two ways economies of scale change how a firm behaves.
- Give two benefits and two costs of growth for a business.
- Why is a rise in sales revenue not evidence of an economy of scale?
1.4.3b Types of economy of scale
Five routes lead to the same lower cost
- Section 1.4.3a established that an economy of scale is a fall in average cost as output rises, so the work here is to name the route and trace it to the cost of one unit.
- A growing firm usually collects several routes at once, since the supermarket ordering more stock is also buying bigger lorries and hiring specialist buyers in the same year.
Managerial, purchasing and financial economies come from organisation
Managerial economies: savings that come from employing specialist managers for separate parts of the business.
Purchasing economies: savings that come from buying materials and stock in larger quantities.
Financial economies: savings that come from being able to borrow and raise money more cheaply.

- Managerial: a small firm's owner has to be accountant, buyer, marketer and production manager at once, and is unlikely to be good at all four. Only at high output is a full-time specialist for each worth their salary, and then average cost falls twice over: better decisions waste less, and the salaries are divided between a very large number of units.
- Tesco employs separate directors and whole teams for buying, logistics, property, technology and people, and their pay spread across billions of pounds of sales adds a fraction of a penny to each item; the same salaries in a corner shop would be impossible.
- Purchasing: a supplier shipping one large order instead of forty small ones spreads its own delivery, invoicing and selling costs over more units, so it can charge less per unit and still profit. Materials are often the buyer's largest single cost, so its average cost falls with them.
- The NHS buys medicines and equipment for around 1.5 million staff and the whole of England at once, securing prices no single hospital could negotiate, and Aldi's narrow range of about 2,000 lines means each line is ordered in huge volume.
- Financial: a bank judges a large, established firm less likely to fail and has more assets to seize if it does, so it lends at a lower rate, and a large firm can skip the bank altogether by issuing shares or bonds. Interest is a cost like any other, so cheaper money on the same machine lowers average cost at every level of output.
- Tesco can borrow by selling bonds to investors while the independent grocer down the road negotiates an overdraft, and the gap between the two rates of interest is the economy.
- Flour for a bakery: an independent shop buys 500 sacks a year and pays £14.00 a sack, while a national chain buying 20,000 sacks pays £11.00 a sack, and one sack makes 100 loaves.
- The loaf, the recipe and the oven are identical, so the whole 3p comes from the size of the order. At two million loaves a week that is £60,000 the chain can hand to customers as a lower price or keep as profit.
Technical and risk-bearing economies come from scale
Technical economies: savings that come from using larger or more specialised machinery, plant and vehicles.
Risk-bearing economies: savings that come from spreading risk across more products, customers and markets.
- Technical: a large machine or production line only repays its purchase price at high output, but once running it makes each unit more cheaply than smaller equipment can, and high output also makes it worth breaking production into specialised stages so each machine and worker repeats one task.
- Larger containers, lorries and ships cost less per unit of what they carry, because doubling the size of a tank costs far less than doubling the metal around it.
- Nissan's Sunderland plant runs robotic body and paint lines that only make sense at roughly 300,000 vehicles a year, and JCB machines digger parts on dedicated lines rather than general purpose tools.
- Risk-bearing: a firm with one product in one town loses everything if tastes move, while a firm with twenty products in ten countries loses one twentieth of its sales.
- That steadiness lowers cost without any supplier cutting a price, since lenders and insurers charge less for a business whose income is steady, the firm can afford to test products that may fail, and it can hold less idle cash against a bad month.
- JCB sells many machine models into dozens of countries, so a construction slowdown in one market no longer threatens the whole firm, and Tesco spreads risk across groceries, clothing, banking and several countries.
- Lower total cost is not the test: total cost almost always rises with output, and it is average cost that has to fall.
- Getting bigger is not the test either: a firm can double output and sales with the cost of each unit unchanged.
Spotting which type a question is describing
- Ask what the firm bought or hired, since machinery and vehicles point to technical, materials and stock to purchasing, and managers to managerial.
- Ask who charged less, because a lender charging less is financial while a supplier charging less is purchasing, and candidates lose marks by swapping the two.
- Ask whether the saving came from safety rather than from a bill going down, since risk-bearing works through spread and steadiness rather than a visible discount.
- Then name the type, give the firm that shows it, and finish with the same sentence every time: the cost of each unit falls, so average cost falls.
- Name the five types of economy of scale AQA lists.
- Which type explains a large firm borrowing at a lower rate of interest than a small one?
- Flour costs £14.00 a sack on a small order and £11.00 on a large one, and one sack makes 100 loaves. How much does the large order save on each loaf?
- Explain how a technical economy of scale lowers average cost.
- Why does a rise in total cost not rule out an economy of scale?
1.4.3c Diseconomies of scale
Beyond a point, more output raises unit costs
Diseconomies of scale: a rise in the average cost of production as a firm raises its output beyond a certain size.
Optimum output: the level of output at which a firm's average cost is at its lowest.
- Section 1.4.3a followed average cost downwards as a firm grew, and diseconomies are simply what happens on the far side of the lowest point.
- The trigger is the same rise in production, so the two ideas differ in effect rather than in cause.
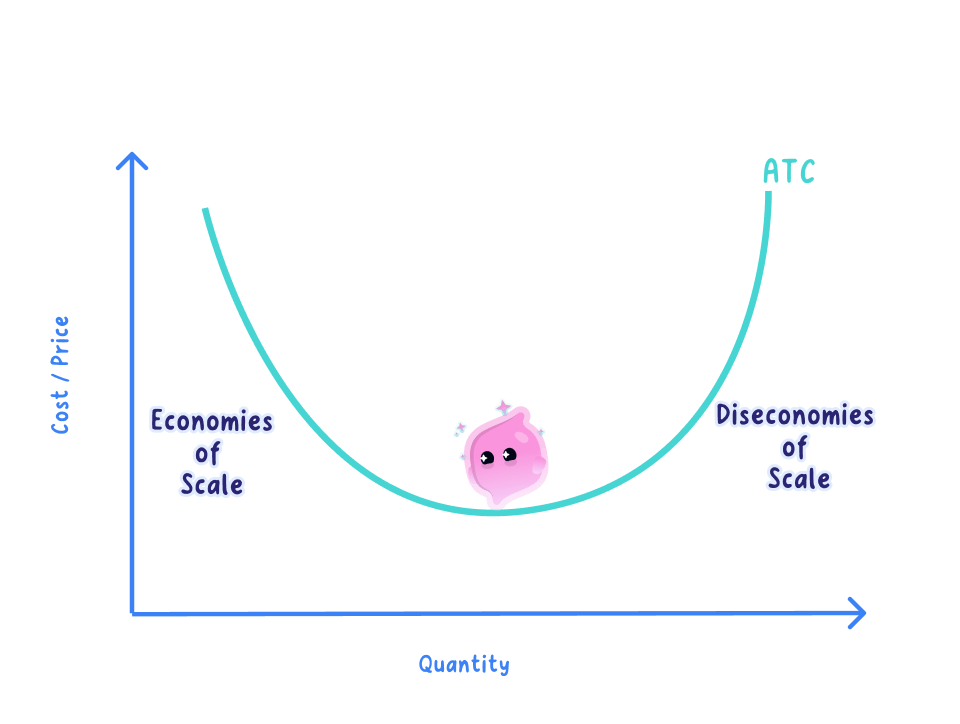
- Average cost sits on the vertical axis and output on the horizontal axis: the curve falls, hits a minimum, then rises again, the characteristic U shape.
- The output at that minimum is the optimum output: growing towards it lowers average cost, growing past it raises it.
The causes are organisational, not technological
- Communication breaks down: a message in a firm of tens of thousands passes through several layers of management and arrives late, incomplete or changed, so decisions are made on stale information.
- In an Amazon UK fulfilment centre of several thousand staff, a change to a picking rule that reaches one shift and not the next produces a day of wasted work that still has to be paid for.
- Coordination and duplication get expensive: more sites, product lines and departments need more managers, meetings and monitoring, and none of that adds a single unit of output.
- The NHS employs around 1.5 million people across hundreds of separate organisations, and two trusts buying the same equipment on different contracts raises the cost per patient treated.
- Worker motivation weakens: a worker who never meets a manager, and whose effort makes no visible difference to a business of this size, has little reason to push, so lower output per worker, more absence and higher turnover all mean the same wage bill buys fewer units.
- Management layers turn into bureaucracy: each new layer of managers, forms and approvals is a salary and a delay, and waste is harder to see from the top, so departments duplicate each other's work and nobody is answerable for the total.
- Quality gets harder to monitor: checking standards across roughly 2,600 Greggs shops or hundreds of Tesco stores costs money, and every batch thrown away or replaced is paid for out of the same output.
- The bakery from 1.4.3a pushed past its best size: one site handles 60,000 loaves a week on fixed costs of £12,000 and £0.40 a loaf, but 100,000 loaves needs three sites, so fixed costs rise to £20,000 and overtime and supervision push the variable cost to £0.55 a loaf.
- Output rose by two thirds and every loaf now costs 15p more, which is £15,000 a week thrown away on the extra size alone. Average cost is lowest at 60,000 loaves, so 60,000 is this bakery's optimum output and everything past it is a diseconomy of scale.
Diseconomies depend on organisation, not just size
- It depends on how the firm is structured, because splitting a business into divisions with their own budgets and targets restores the short lines of command that made it cheap when it was small.
- It depends on how well information moves, since shared stock and sales systems let a head office see every store in real time, which is why national grocers can run thousands of shops without losing control of them.
- It depends on how workers are managed and paid, as bonuses, team working, promotion from the shop floor and giving staff real decisions all recover motivation that sheer size takes away.
- It depends on how far past the optimum the firm has gone, because a small overshoot costs pennies a unit while a firm that has doubled past its best size may have given back every economy it ever gained.
- It depends on the industry, since a firm assembling a standard product on one site can grow very large before coordination bites, while a firm whose service is delivered face to face runs into the limit far sooner.
Judgement: diseconomies of scale can be delayed but not abolished, because every device that fixes them, whether divisions, information systems or bonuses, is itself a cost paid out of the same output, so good organisation moves a firm's optimum output further out rather than removing the limit altogether.
Diseconomies limit growth but do not stop it
- Notice what is not being claimed: output is still rising past the optimum, sales may still be rising and total profit may still be rising, and only the cost of each unit has turned.
- A firm can therefore choose to accept a higher average cost to win a bigger market, which is why the largest firm in an industry is rarely the cheapest per unit.
- The decision is whether the extra volume is worth more than the pennies added to every unit, which is exactly the weighing up of the costs and benefits of growth in 1.4.3a.
- Label both axes and mark the minimum point when sketching the average cost curve; an unlabelled U earns nothing.
- For "evaluate", argue that size alone does not cause diseconomies; judge how well the particular firm is organised.
- Define diseconomies of scale.
- What is a firm's optimum output?
- A bakery's total cost is £36,000 at 60,000 loaves a week and £75,000 at 100,000 loaves. What happens to average cost, and by how much?
- Give two causes of diseconomies of scale and say how each one raises average cost.
- Where on a U-shaped average cost curve does the optimum output sit?
