1.3.1a Demand and the factors that influence it
Demand is buying people can actually pay for
Demand: the quantity of a good or service that consumers are willing and able to buy at a given price over a period of time.
Quantity demanded: the single amount consumers would buy at one particular price, taken out of that whole set of buying plans.
- Willing and able are two separate tests, and a buyer who fails either adds nothing to the market.
- A shopper who would love a Nissan Leaf but cannot raise the money is willing without being able.
- A millionaire with no interest in motorbikes is able without being willing.
- Buying that passes both tests is effective demand, the only kind that reaches a shop's till.
- A demand figure needs a price attached, because the same shoppers buy a very different amount at £2 as at £5.
- It needs a time period too, since 40 loaves a week and 40 loaves a year describe two different shops.
- Each quantity is what consumers plan to buy, so it is an intention rather than a record of a sale.
- A fall in the good's own price raises quantity demanded, not demand.
- Demand quoted with no price and no time period cannot be marked.
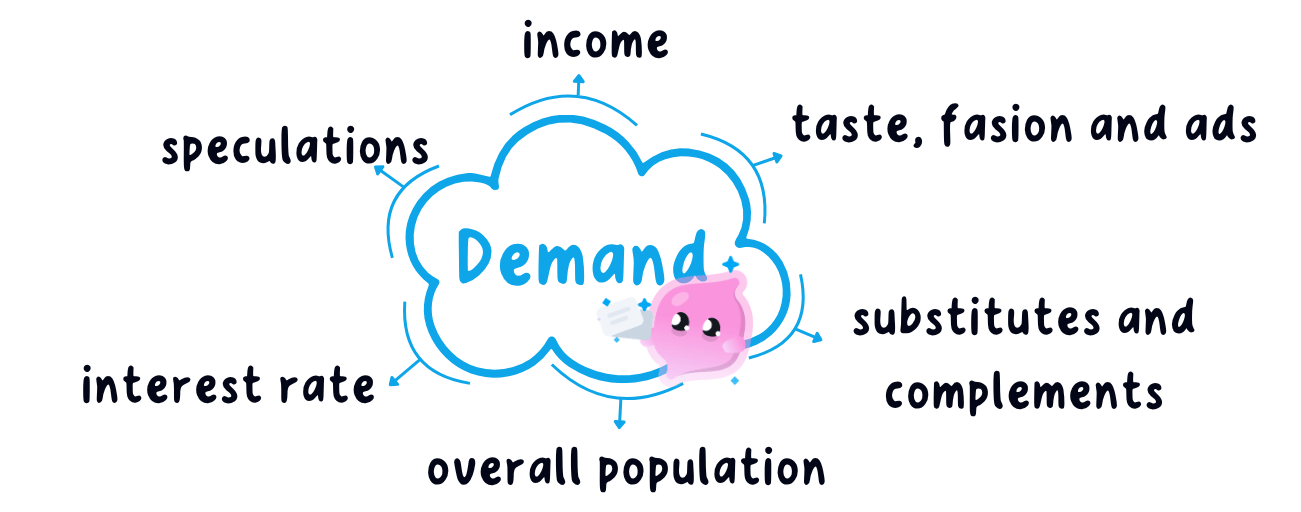
Income raises normal goods, lowers inferior goods
- Real income is what a household's pay will actually buy, so it rises only when wages grow faster than prices.
- A normal good is one people buy more of as real income rises, such as meals out at Wagamama or holidays abroad.
- An inferior good is one people buy less of as real income rises, such as supermarket value ranges or long coach journeys.
- One pay rise pushes the two types in opposite directions, so name the type of good before you give a direction.
- An income tax cut or a rise in benefits works like a pay rise, because all three leave households with more to spend.
- UK real incomes were squeezed from 2021 as prices rose faster than wages.
- Tesco and Sainsbury's shoppers moved from branded groceries to own-label ranges, and Aldi and Lidl gained market share.
- Value food is the inferior good and the branded version the normal good, both reacting to one change in income.
Tastes, fashion and advertising change demand
- Tastes and fashion change demand because consumers want the good more or less than before, with no price change involved.
- The Greggs vegan sausage roll met a shift in UK tastes towards plant-based food, and queues formed at prices no lower than the meat version.
- Health information moves tastes the other way, so NHS campaigns about sugar have lowered demand for full-sugar fizzy drinks.
- Advertising raises demand by making a good better known and more wanted, which is why firms pay for it.
- John Lewis spends heavily on its Christmas advertisement to lift demand across the whole store in December.
- Advertising by one firm can lower demand for a rival, since the buyers it wins have to come from somewhere.
Substitutes and complements change demand too
- A substitute is bought instead of the good being studied, so a fall in its price pulls buyers away and lowers demand for that good.
- When Tesco cuts the price of its own-brand cola, demand for Coca-Cola falls even though Coca-Cola's own price has not changed.
- A complement is used together with the good being studied, so a fall in its price raises demand for that good.
- Cheaper games consoles raise demand for the games played on them, and cheaper flights raise demand for hotel rooms.
- The price that moved belongs to the other good, which is why this changes demand rather than quantity demanded.
- Name the related good as a substitute or a complement before you give the effect.
Substitutes and complements, and the knock-on effects between related markets, are developed in sections 1.3.4a and 1.3.4b.
Population and expectations shift demand
- A larger population raises demand for most goods, because there are more buyers in the market.
- Structure matters as well as size, so an ageing UK population raises demand for NHS care and lowers demand for school places.
- Expectations bring buying forward or push it back, so households expecting higher energy bills buy insulation sooner.
- Buyers who expect a price fall wait instead, which lowers demand today and raises it later.
Interest rates and seasons move demand
- Interest rates change demand for anything bought on credit, so a Bank of England rate cut raises demand for cars and new kitchens.
- The seasons move demand at fixed points in the year, so sun cream peaks in July and gas heating peaks in January.
- Not one factor in this article is the good's own price, which is what they all have in common.
- Give the full definition of demand.
- How does demand differ from quantity demanded?
- Why does a rise in real income lower demand for an inferior good?
- A supermarket cuts its own-brand cola price. What happens to demand for Coca-Cola?
- Name three non-price factors that change demand.
1.3.1b The demand curve
Plot the schedule to get the curve
Demand schedule: a table of prices with the quantity a consumer would buy at each of those prices.
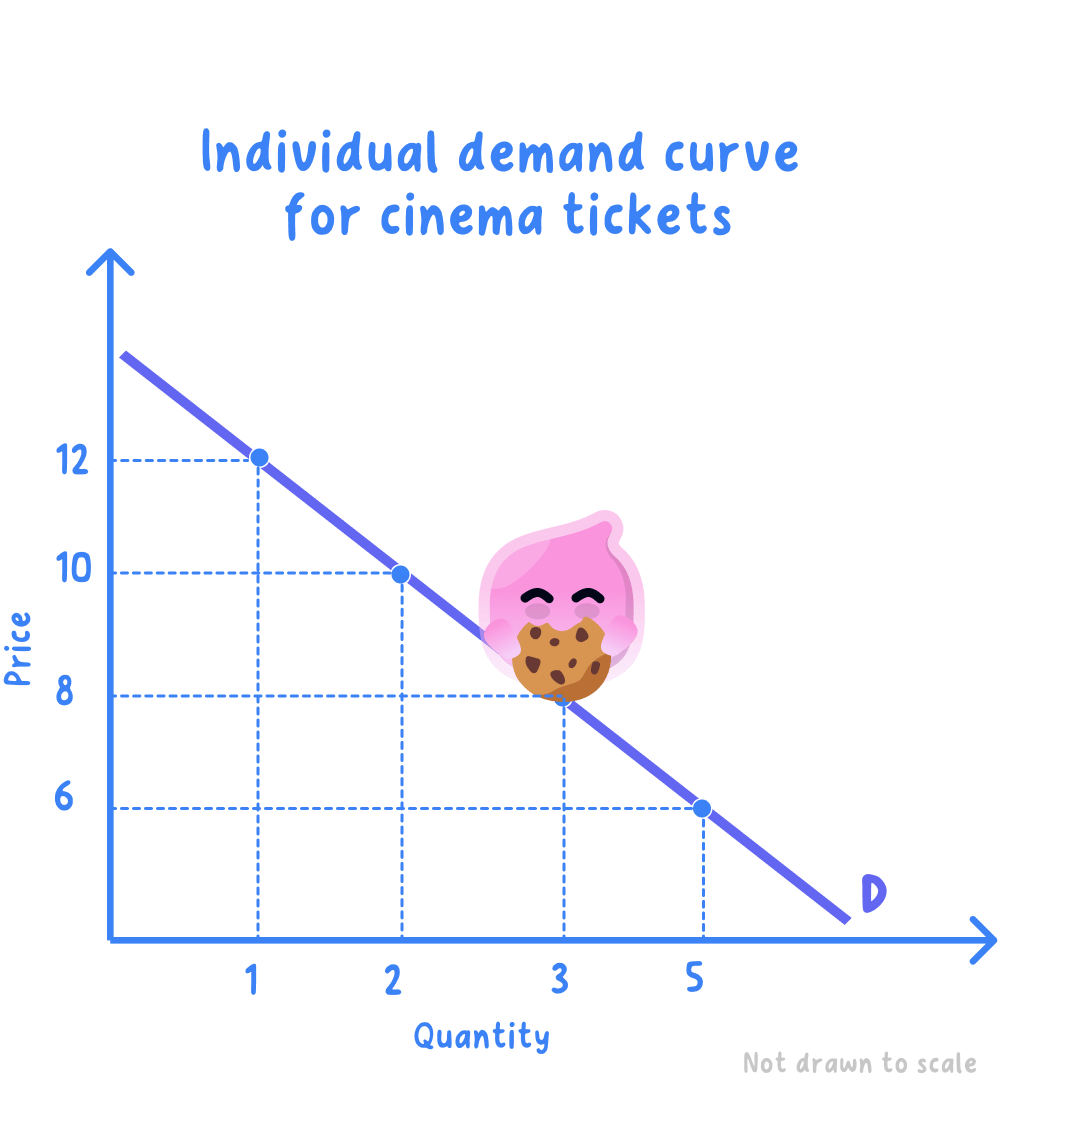
Demand curve: the same information drawn as a line, with each row of the schedule plotted as one point.
Demand itself, and the non-price factors that change it, are set out in section 1.3.1a.
- Price goes on the vertical axis and quantity demanded on the horizontal axis, on every demand and supply diagram.
- Plot each row as one point, join them into a single line falling from top left to bottom right, and label it D.
- The finished curve assumes nothing but price has changed, which economists call ceteris paribus.
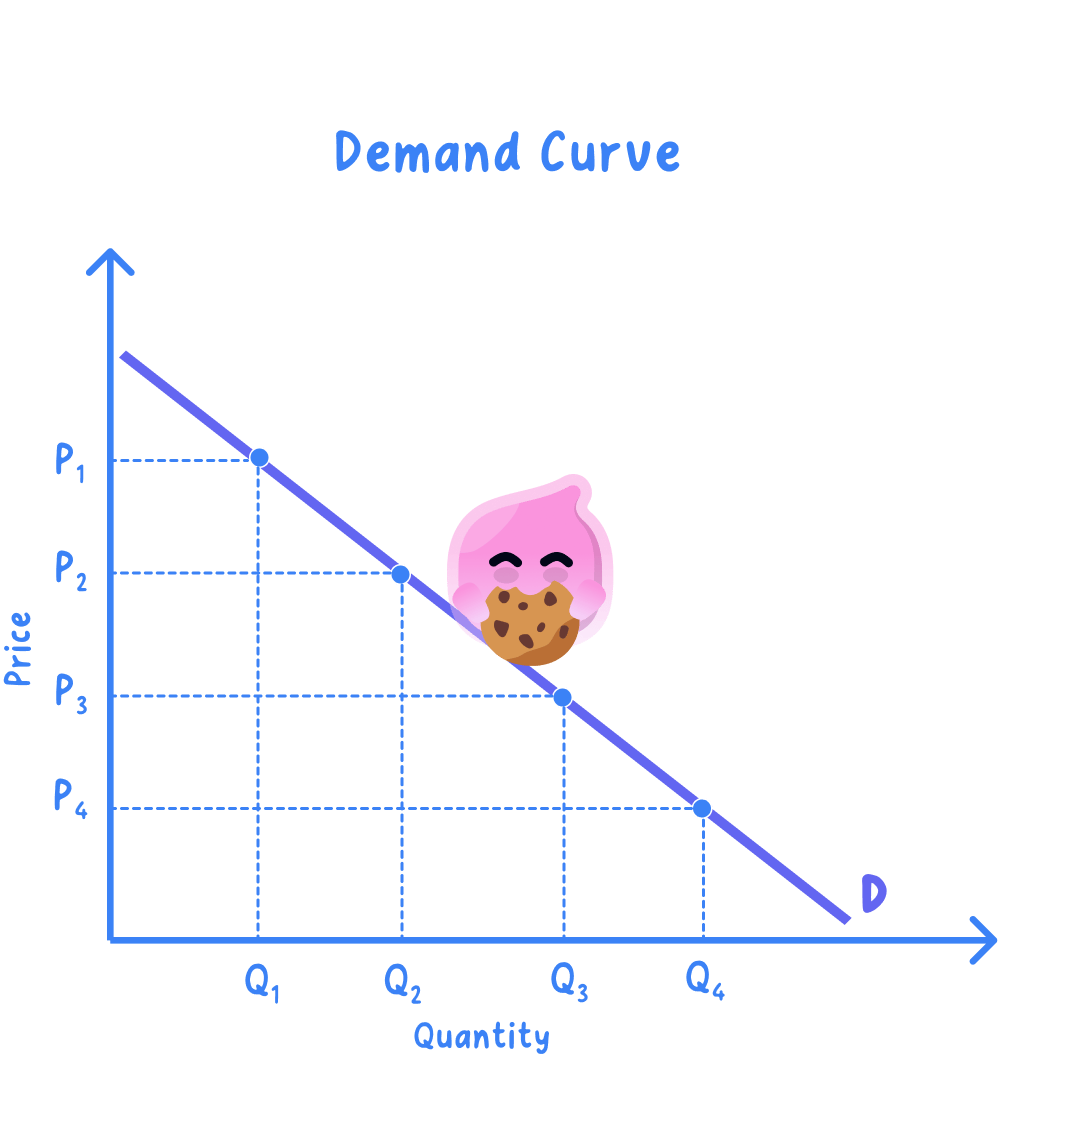
- One student's cinema tickets: the schedule shows how many tickets she would buy in a month at each price.
| Price per ticket | Tickets a month |
|---|---|
| £12 | 1 |
| £10 | 2 |
| £8 | 3 |
| £6 | 5 |
Step 1: plot £12 against 1 ticket, £10 against 2, £8 against 3 and £6 against 5, then join the points and label the line D.
Step 2: subtract the quantity at the highest price from the quantity at the lowest.
5−1=4 tickets a month 5 - 1 = 4\text{ tickets a month} 5−1=4 tickets a month- A fall from £12 to £6 raises her quantity demanded by 4 tickets a month, and all four points sit on the one curve D.
Why the demand curve slopes downwards
- A lower price brings in buyers who could not afford the good before, so more people become willing and able to buy it.
- A lower price also makes the good cheaper against the goods it competes with, so some buyers switch across to it.
- People already buying tend to take extra units, because each further unit now costs them less.
- All three effects push the same way, which is the law of demand: price and quantity demanded move in opposite directions.
- Never put quantity on the vertical axis: swapped axes cannot be credited.
- Do not draw a second curve for a price cut: only a non-price factor gives a new curve.
A price change slides you along D
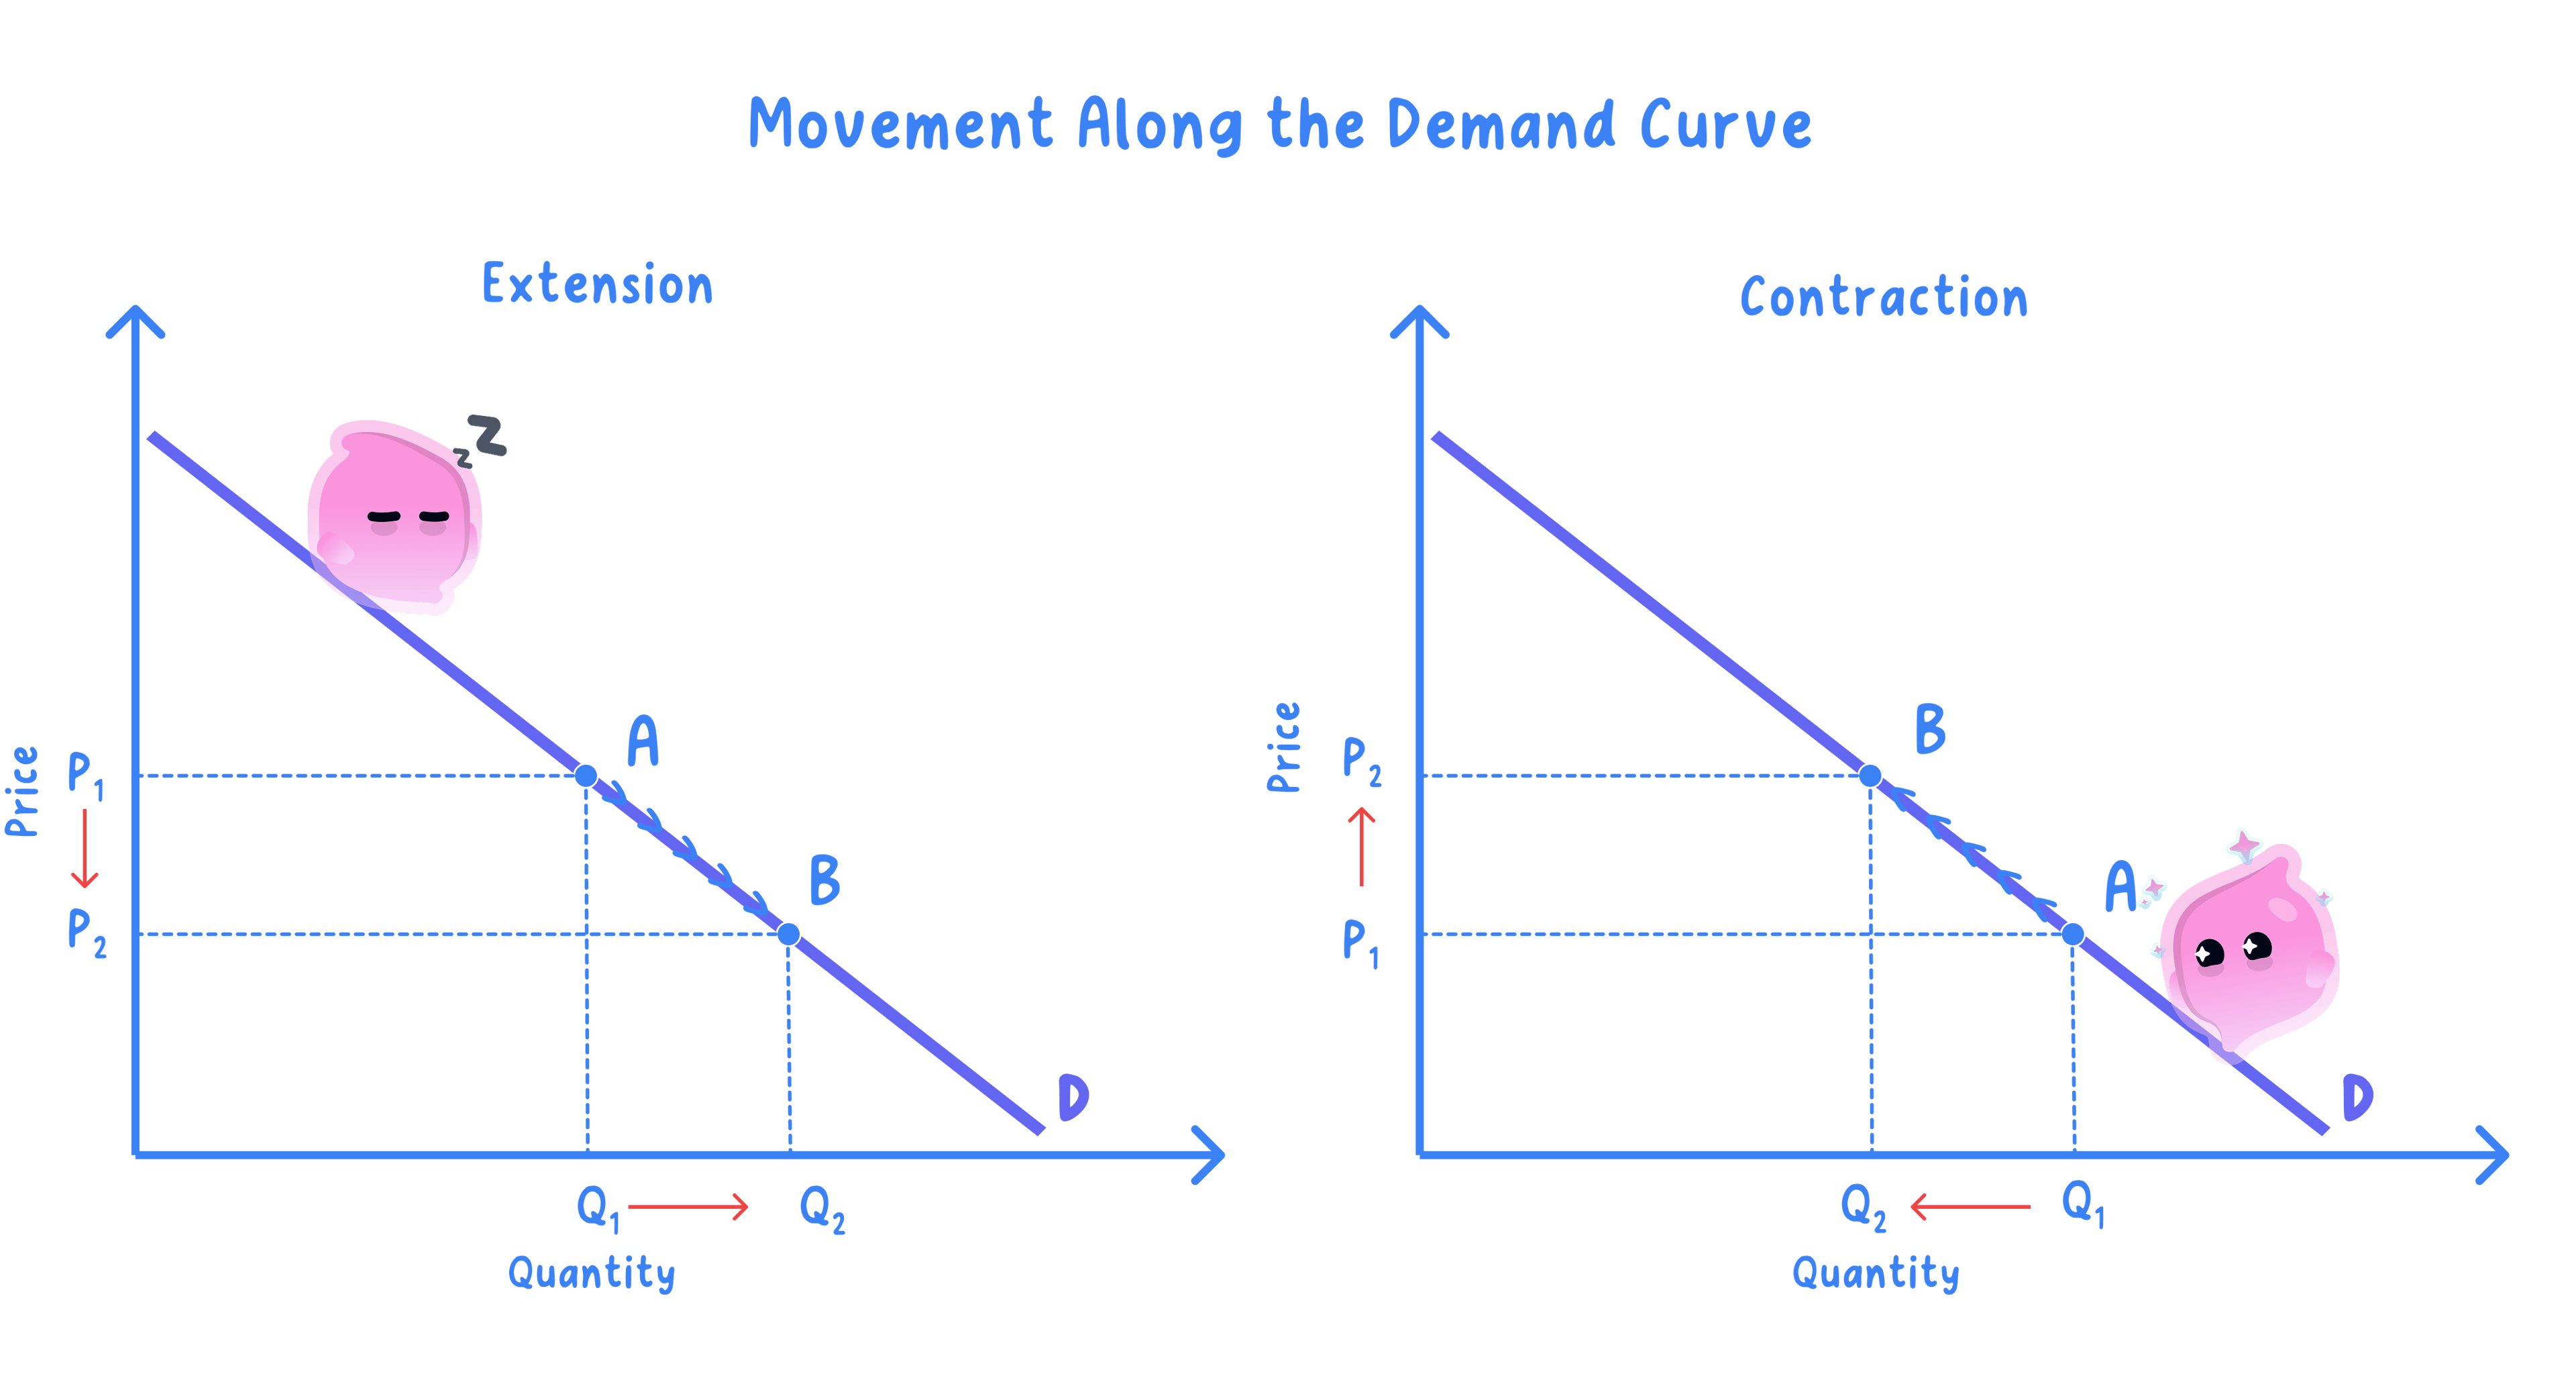
Movement along the demand curve: a change from one point on the curve to another point on the same curve, caused only by a change in the good's own price.
Extension of demand: a rise in quantity demanded after a fall in the good's own price, shown by sliding down the curve to the right.
Contraction of demand: a fall in quantity demanded after a rise in the good's own price, shown by sliding up the curve to the left.
- The curve does not move and the label D stays put; what moves is the point being read.
- Mark the two points A and B, and label P1, P2, Q1 and Q2 so the coordinates you moved between are visible.
A shift changes demand at every price
- A shift happens only when something other than the good's own price changes, which means one of the factors in section 1.3.1a.
- An increase in demand moves the whole curve to the right, so a larger quantity is demanded at every price.
- A decrease in demand moves the whole curve to the left, so a smaller quantity is demanded at every price.
- Draw the second curve as a complete line roughly parallel to the first, label it D2, and add an arrow showing which way it has gone.
- Use increase and decrease for a shift, and extension and contraction for a movement.
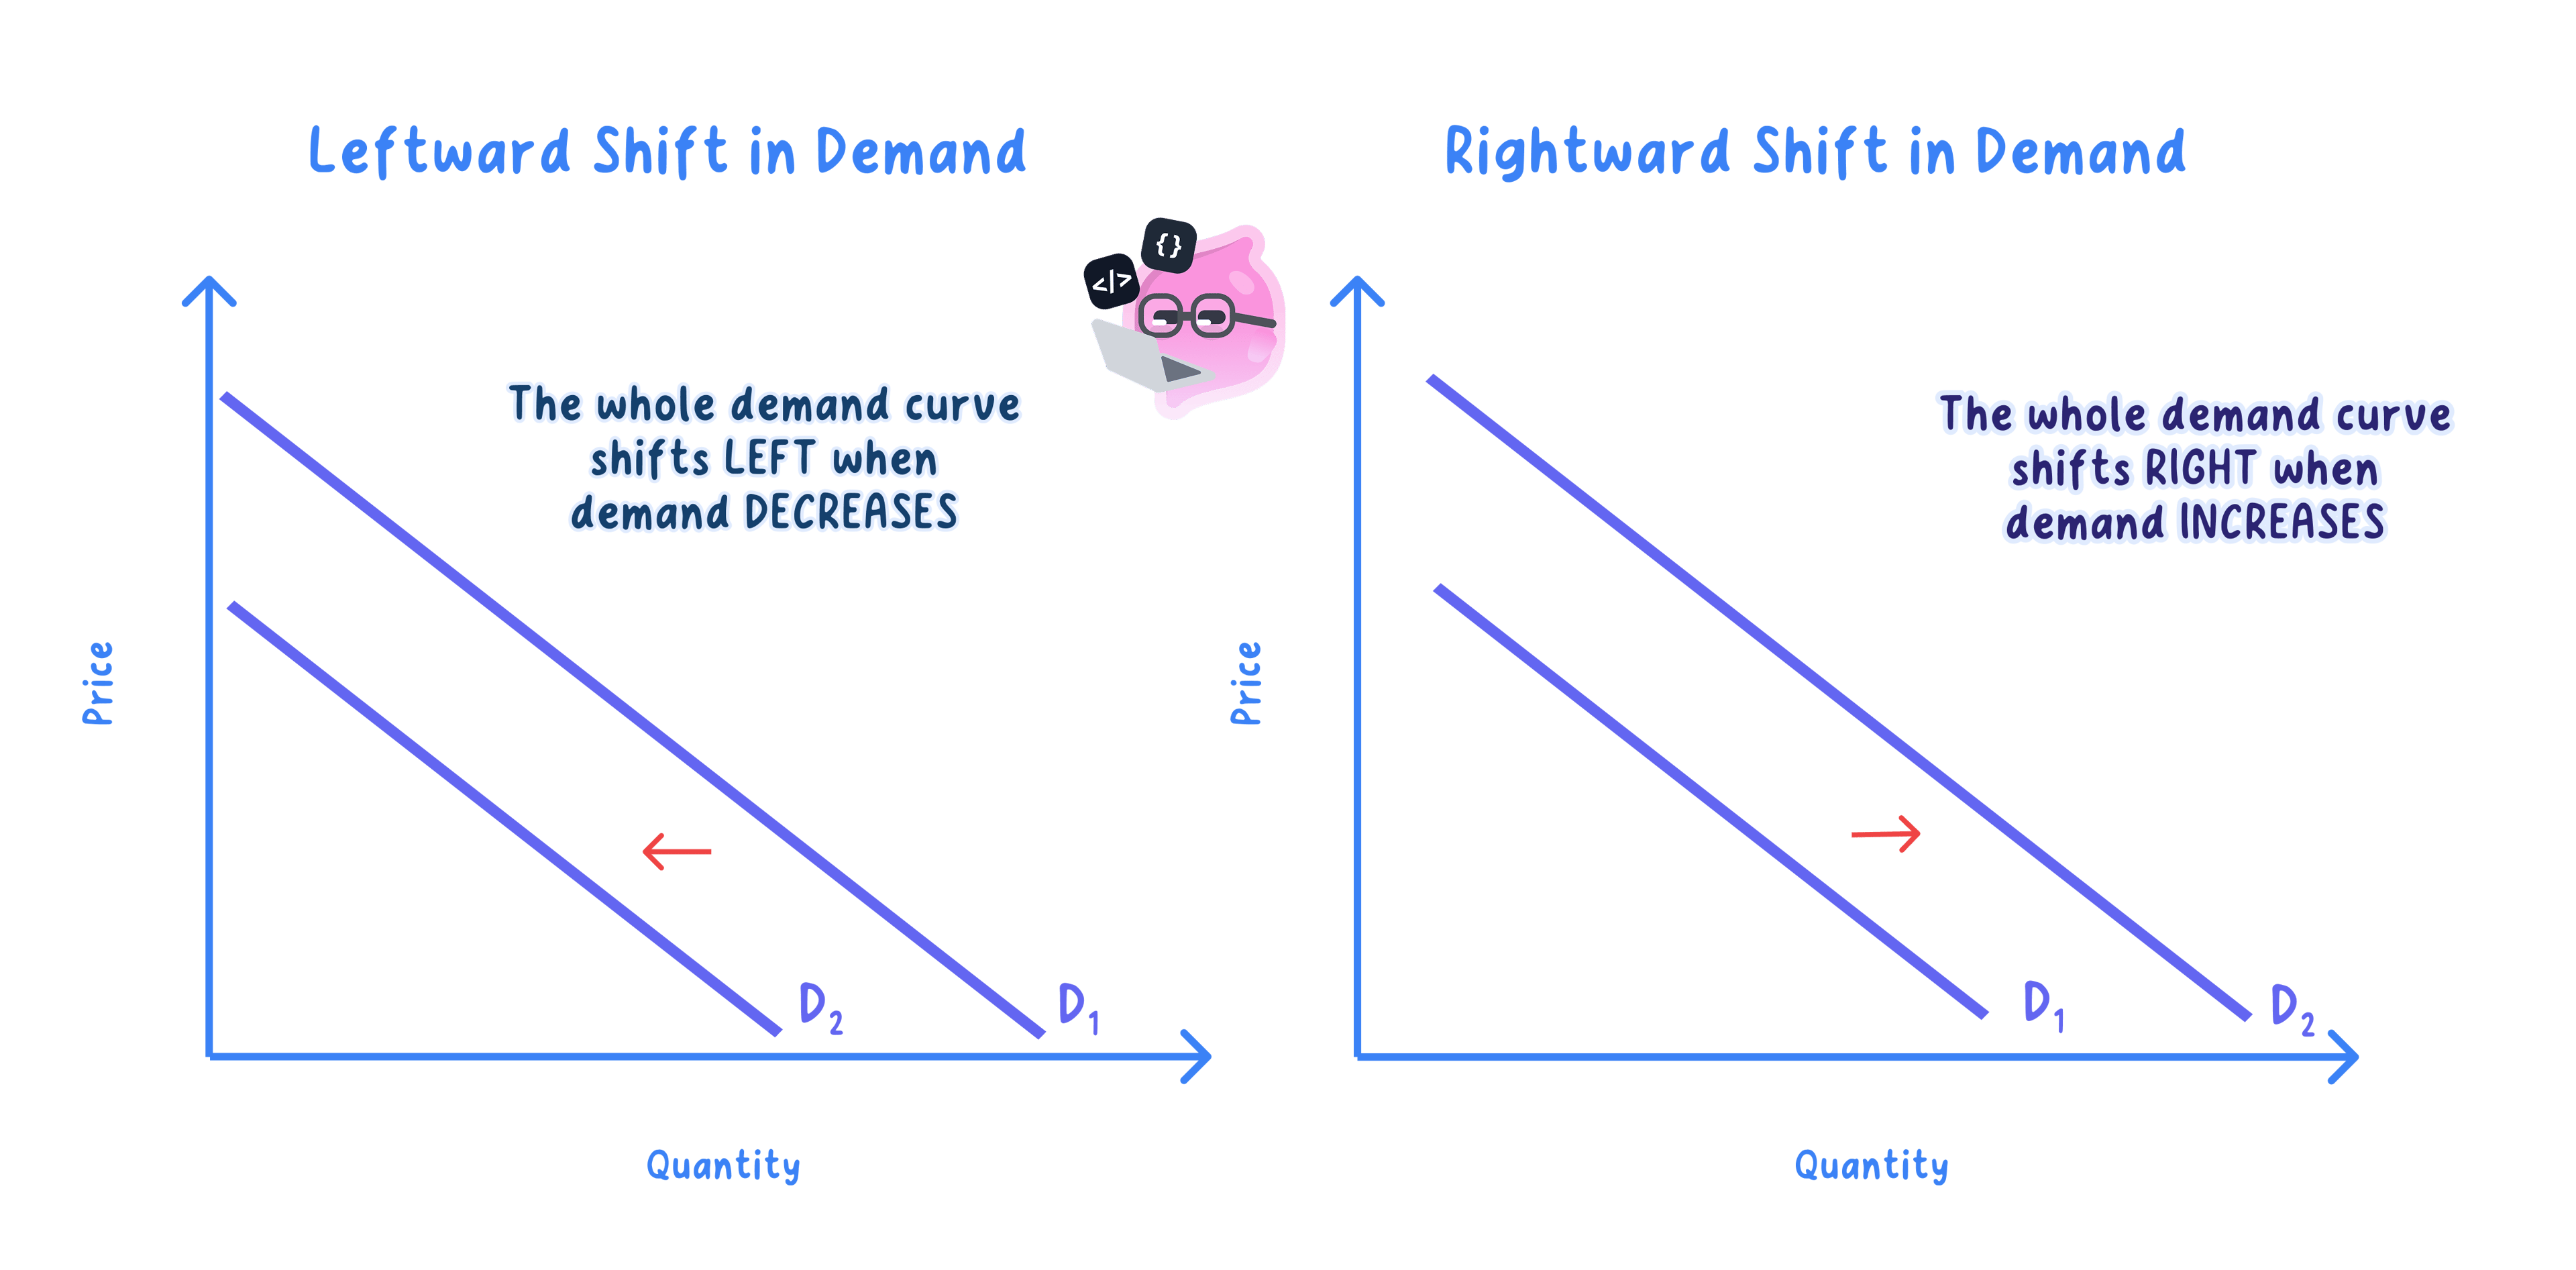
- A high street coffee shop after new offices open nearby: the schedule shows cups a day before and after the offices filled up, with menu prices left alone.
| Price per cup | Cups a day before | Cups a day after |
|---|---|---|
| £3.00 | 250 | 400 |
| £2.00 | 400 | 560 |
Step 1: at £3.00, subtract the old quantity from the new one.
400−250=150 cups a day 400 - 250 = 150\text{ cups a day} 400−250=150 cups a dayStep 2: do the same at £2.00.
560−400=160 cups a day 560 - 400 = 160\text{ cups a day} 560−400=160 cups a day- More is wanted at both prices with no price change, so the whole curve has shifted right from D to D1: an increase in demand.
Shift the curve, or slide along it?
- Find the change the question describes and ask whether it is the price of this good.
- If it is, slide along the existing curve and call it an extension or a contraction.
- If it is anything else, draw the second curve and call it an increase or a decrease in demand.
- Watch for a related good: the price of a substitute or a complement is not the price of this good, so it shifts this curve.
- Label both axes and the curve D before showing any change, because an unlabelled curve earns nothing.
- Show a movement as two labelled points on one curve, and a shift as a second curve D1 with an arrow.
- A substitute's or complement's price shifts this curve, so never read it as a movement along it.
- Which variable goes on the vertical axis?
- Give one reason the demand curve slopes downwards.
- What is the only cause of a movement along the demand curve?
- Using the coffee shop figures, how many more cups a day were demanded at £2.00 after the offices opened?
- How is a decrease in demand shown on a diagram?
1.3.2a Supply and the factors that influence it
Supply is planned selling firms can deliver
Supply: the quantity of a good or service that producers are willing and able to sell at a given price over a period of time.
Quantity supplied: the single amount producers would offer at one particular price, taken out of that whole set of selling plans.
- Willing and able are two separate tests for a producer, exactly as they are for a buyer.
- A bakery that would like to sell 500 loaves a day but has ovens for only 300 supplies 300, because capacity limits the plan.
- A firm with spare capacity offers nothing at a price that fails to cover the cost of making the good.
- A supply figure needs a price and a time period attached, since 60 tonnes a day and 60 tonnes a year describe very different producers.
- Supply records what firms plan to offer, and how much they actually sell depends on how buyers respond to the price.
- Supply is a flow over a period of time, not the amount already sitting in a warehouse.
- Firms supply in order to make a profit, so anything that changes the profit on a unit changes how much they will supply.
- A rise in the good's own price raises quantity supplied, not supply.
- Stock in a warehouse is not supply: supply is a flow at a stated price.
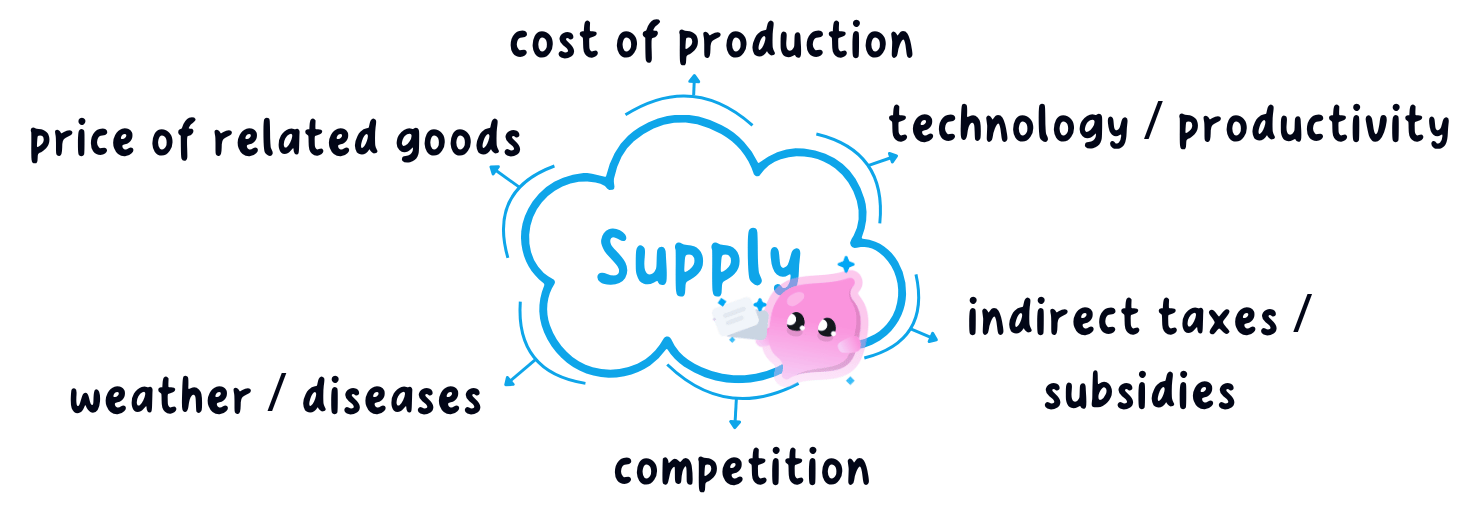
Costs of production are the main influence
- Costs of production include wages, raw materials, energy, rent and the interest paid on borrowing.
- Higher costs cut the profit on each unit, so firms offer less at every price and supply decreases.
- Wholesale gas prices rose sharply from 2021, and several UK steel, glass and fertiliser plants cut or paused production.
- Lower costs raise the profit on each unit, so firms offer more at every price and supply increases.
- A rise in the National Living Wage bites hardest where labour is the biggest cost, such as Greggs and other high street food chains.
- Nissan's Sunderland plant buys steel, aluminium, electronic components and electricity to build every car.
- When energy and component prices rose in 2021 and 2022, the cost of building each car rose with them.
- The plant will now build fewer cars at every price, which is a change in supply and not in what buyers want.
Technology and productivity raise supply
- Technology raises the output a firm gets from given inputs, which lowers the cost of each unit and increases supply.
- Ocado's automated warehouses pick grocery orders far faster than staff picking by hand, so one site can supply many more deliveries a day.
- Higher productivity does the same job, because more output per worker spreads the same costs over more units.
- Training and better capital equipment therefore increase supply over time, without touching the price of the good.
Indirect taxes and subsidies both shift supply
- An indirect tax is a tax on spending that the firm hands to the government, such as VAT, fuel duty or alcohol duty.
- The tax acts on the firm like an extra cost of production, so supply decreases and less is offered at every price.
- A subsidy is a government payment to producers, such as the support paid to UK renewable electricity generators.
- The subsidy lowers the cost of producing each unit, so supply increases and more is offered at every price.
- The size of the tax or subsidy matters as well as its direction, because a larger amount per unit moves supply further.
- A subsidy is paid to producers, so it shifts supply and never demand.
- An indirect tax also shifts supply: do not move demand just because buyers pay more.
More firms mean more market supply
- More firms in a market increases supply, because the market total is every firm's selling plans added together.
- Firms leaving therefore decreases supply, because their selling plans drop out of that total.
- Around thirty small UK energy suppliers collapsed in 2021 after wholesale gas prices rose, and Ofgem moved their customers to the firms left standing.
Weather, disease and related goods shift supply
- The weather changes supply in farming, so a cold wet spring cuts the British wheat and potato harvest whatever price the crop is fetching.
- Disease works the same way, as bird flu outbreaks have repeatedly cut the UK supply of eggs and Christmas turkeys.
- The price of a related good matters when a producer can switch resources, so a rise in the oilseed rape price reduces the wheat supplied from the same farm.
- Not one factor in this article is the good's own price, which is what separates them all from a change in quantity supplied.
- Give the full definition of supply.
- How does supply differ from quantity supplied?
- Why does a rise in raw material prices decrease supply?
- Does a subsidy change supply or demand, and in which direction?
- Name two factors other than costs that can change supply.
1.3.2b The supply curve
Plot production data to get the curve
Supply schedule: a table of prices with the quantity a firm would offer for sale at each of those prices.
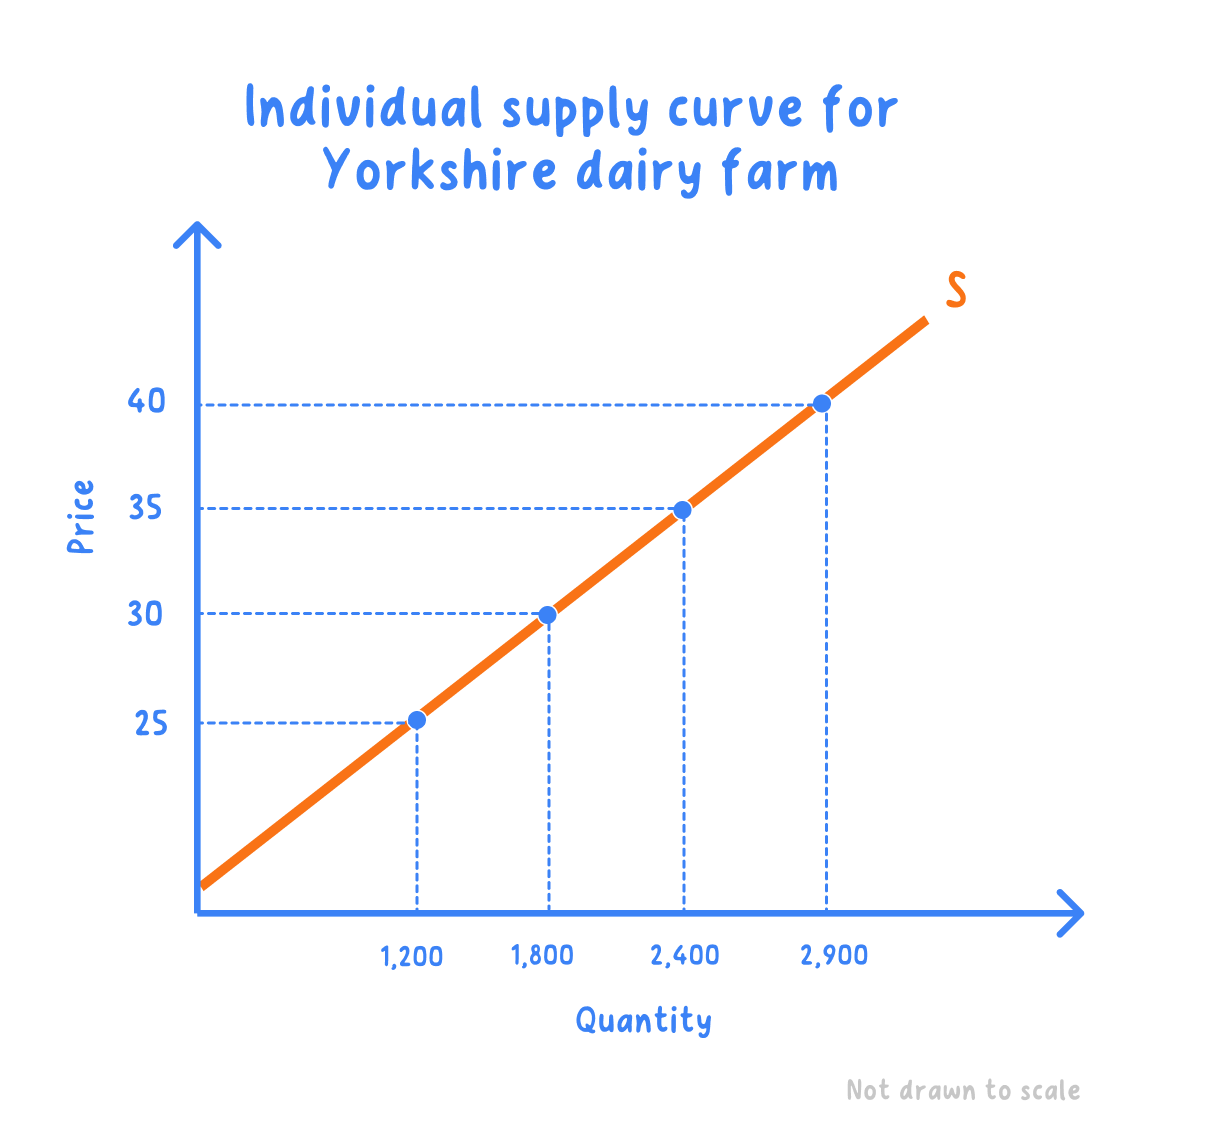
Supply curve: the same information drawn as a line, with each row of the schedule plotted as one point and the line labelled S.
Supply itself, and the non-price factors that change it, are set out in section 1.3.2a.
- Price goes on the vertical axis and quantity supplied on the horizontal axis, exactly as on a demand diagram.
- Plot each row as one point, join them into a single line rising from bottom left to top right, and label it S.
- One firm's line is an individual supply curve, and adding what every firm would offer at each price gives the market curve, with the same upward slope.
- The finished curve holds ceteris paribus, so costs, technology, taxes and the weather are frozen while price alone changes.
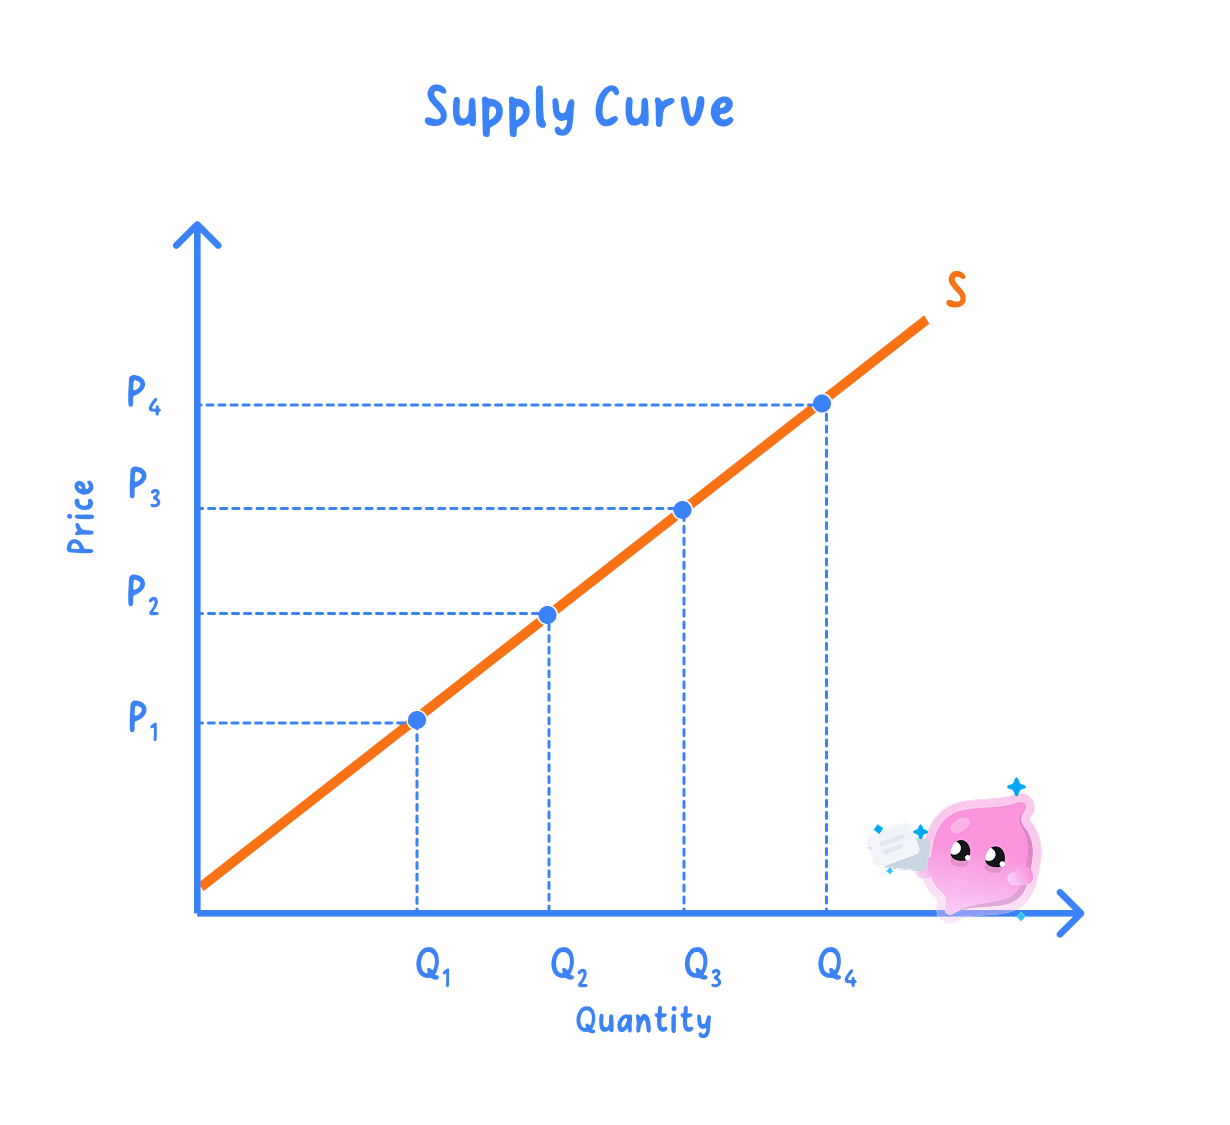
- A Yorkshire dairy farm: the schedule shows the litres of milk a day the farm would sell at each farmgate price.
| Price per litre | Litres a day |
|---|---|
| 25p | 1,200 |
| 30p | 1,800 |
| 35p | 2,400 |
| 40p | 2,900 |
Step 1: plot 25p against 1,200 litres, 30p against 1,800, 35p against 2,400 and 40p against 2,900, then join the points and label the line S.
Step 2: subtract the quantity at the cheapest price from the quantity at the dearest.
2,900−1,200=1,700 litres a day 2{,}900 - 1{,}200 = 1{,}700\text{ litres a day} 2,900−1,200=1,700 litres a day- A rise from 25p to 40p a litre raises quantity supplied by 1,700 litres a day, and all four points sit on the one curve S.
Why the supply curve slopes upwards
- A higher price raises the profit made on each unit sold, so the firm is willing to produce more of them.
- Squeezing out extra output usually costs more per unit, through overtime pay or older machinery, and only a higher price covers that.
- A low price leaves the dearest units unprofitable, so the firm cuts back to the output it can still make at a profit.
- Price and quantity supplied therefore move in the same direction, a direct relationship drawn as the upward slope.
- Never draw a supply curve sloping downwards: a lower price brings less output, not more.
- A rise in the good's own price is an extension of supply, not an increase in supply.
A price change slides you along S
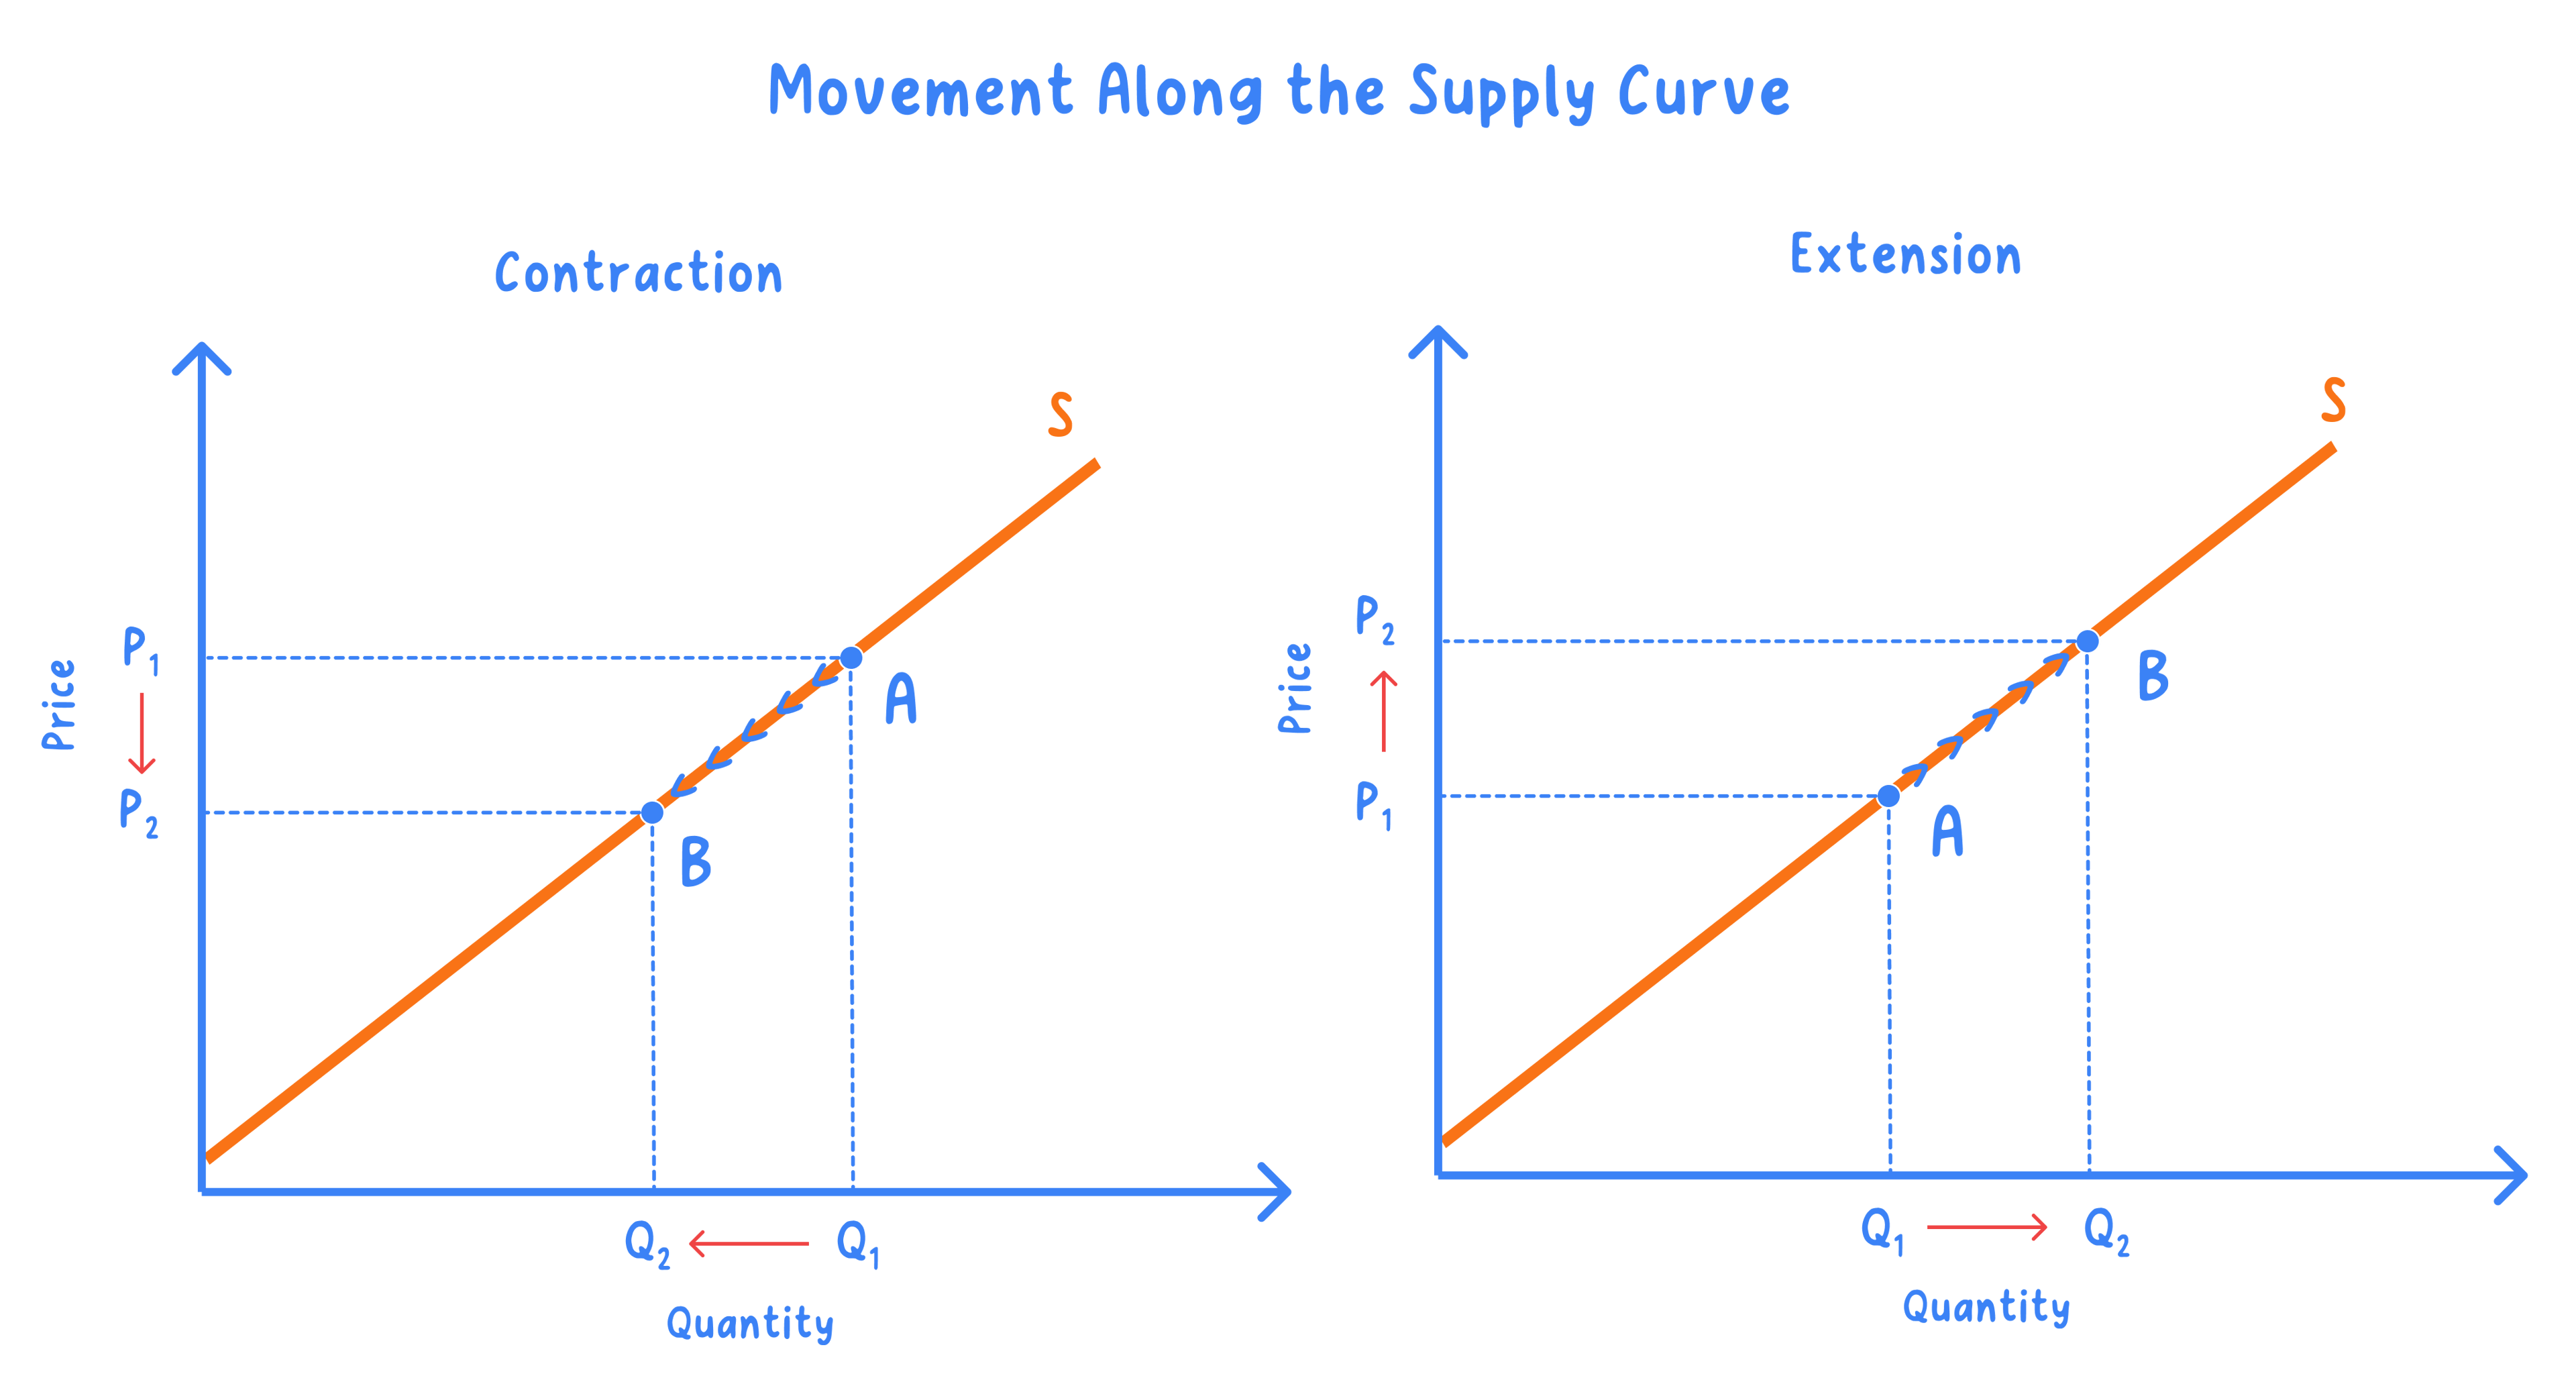
Movement along the supply curve: a change from one point on the curve to another point on the same curve, caused only by a change in the good's own price.
Extension of supply: a rise in quantity supplied after a rise in the good's own price, shown by sliding up the curve to the right.
Contraction of supply: a fall in quantity supplied after a fall in the good's own price, shown by sliding down the curve to the left.
- The curve stays where it was drawn and the label S does not change; what moves is the point being read.
- Mark the two points A and B, and label P1, P2, Q1 and Q2 so the coordinates the firm moved between are visible.
- How far the point slides depends on how quickly the firm can change output, measured as price elasticity of supply in section 1.3.6a.
- Costs, technology, taxes and the weather are unchanged throughout, so the selling plans behind the curve still apply.
A shift changes supply at every price
- A shift happens only when something other than the good's own price changes, such as costs, technology, a tax, a subsidy or the weather.
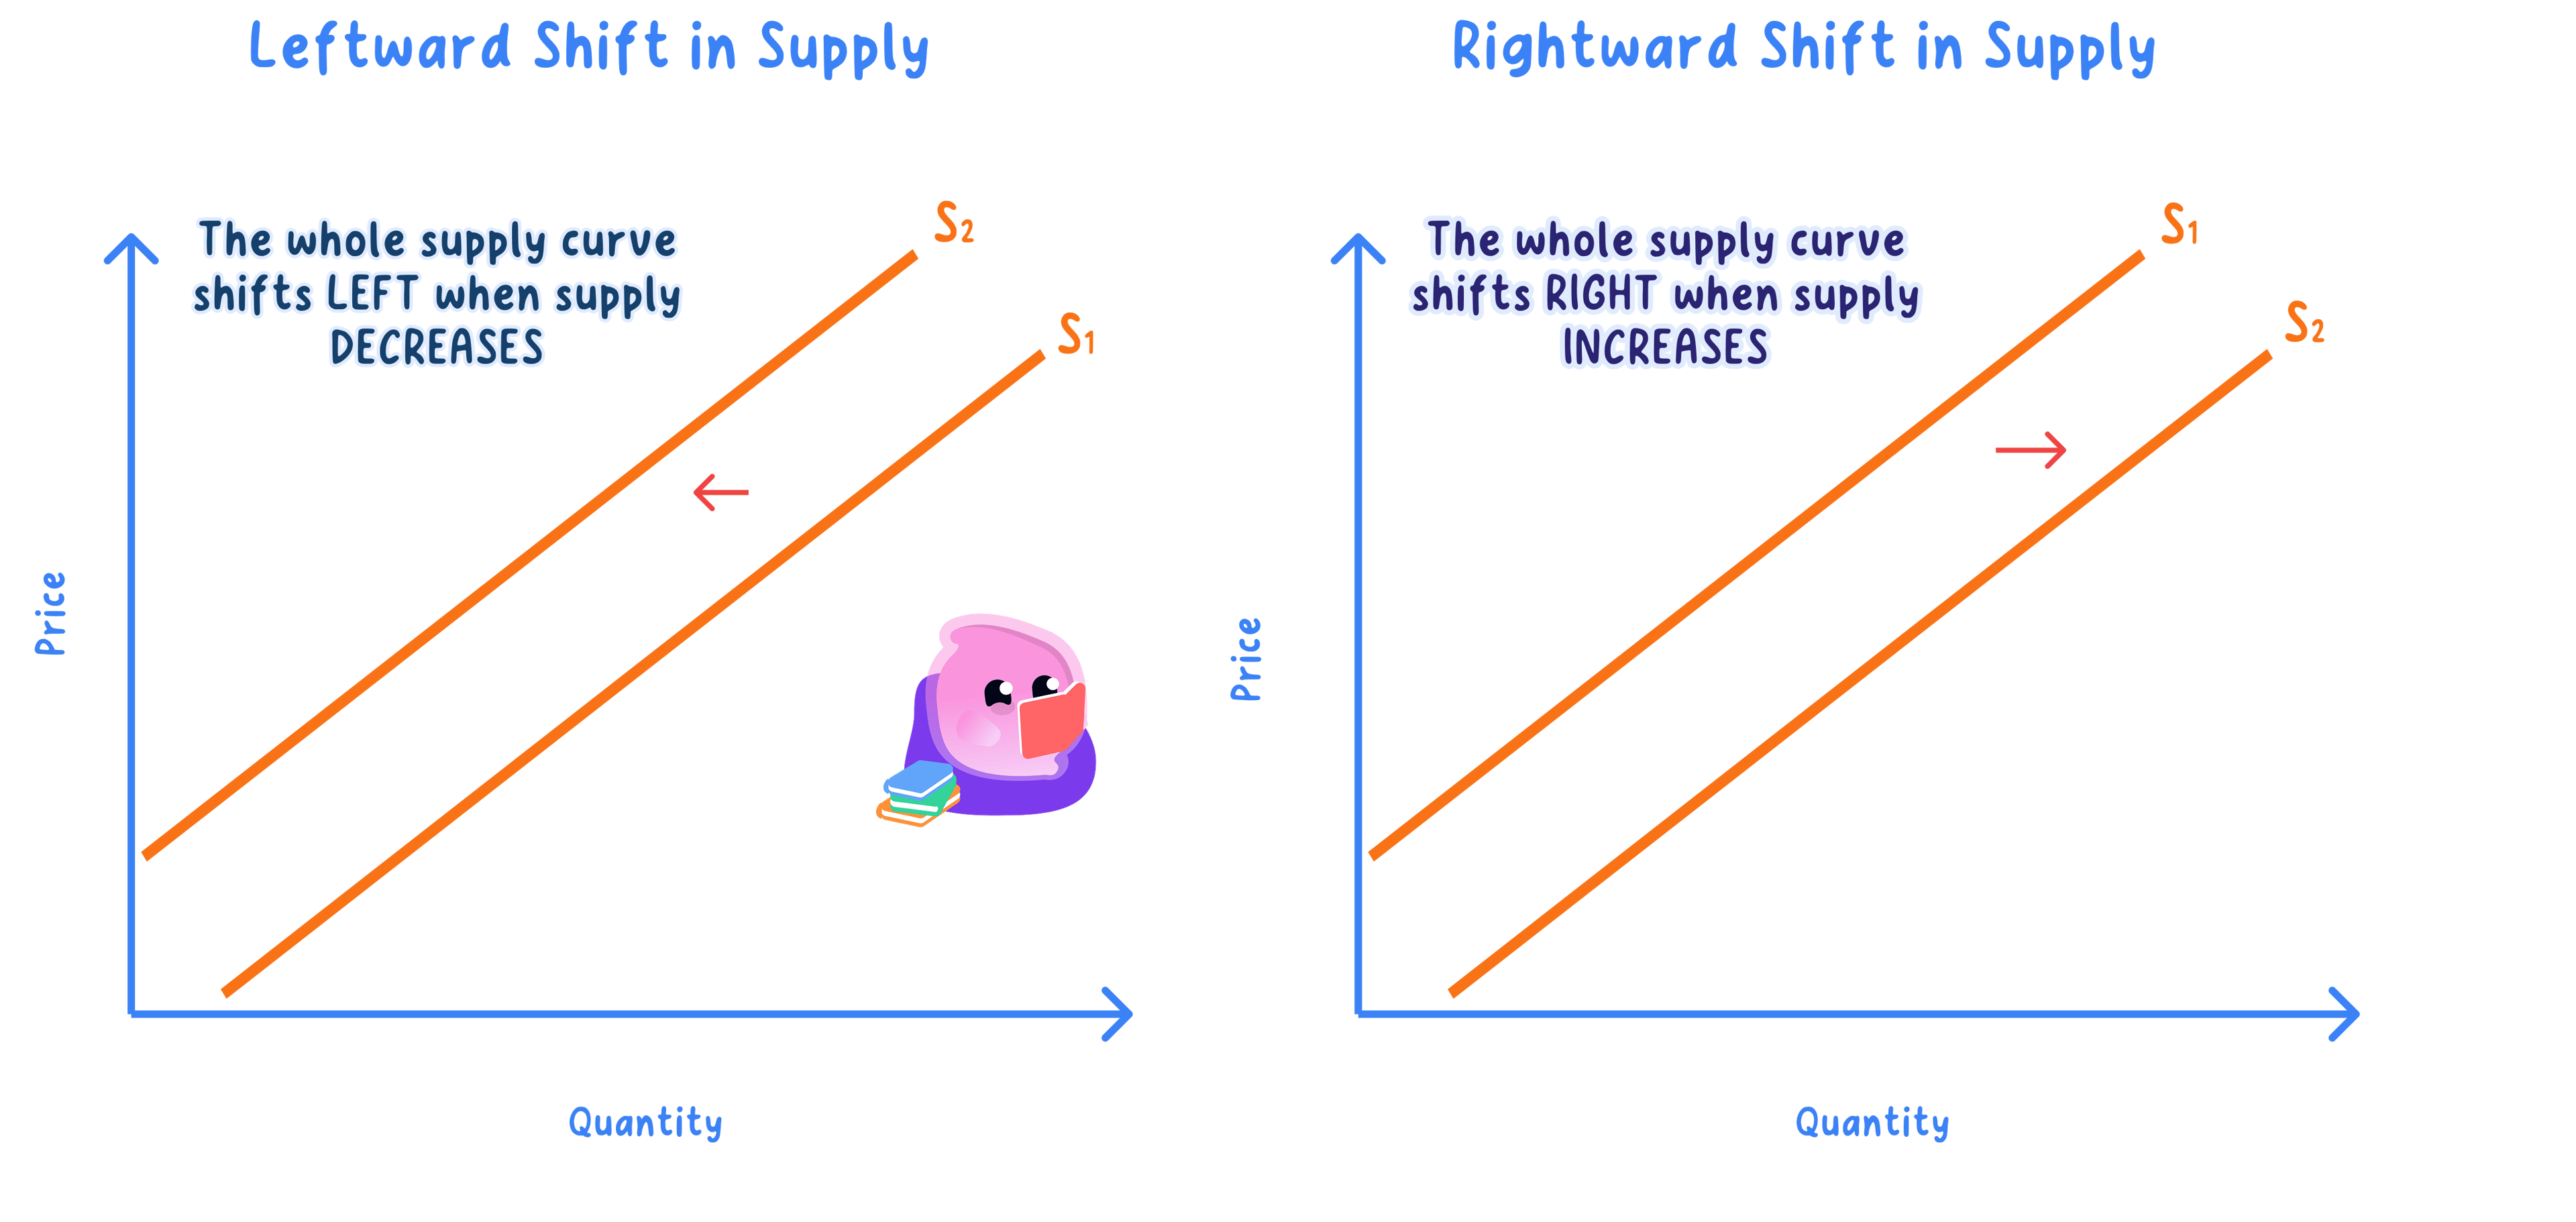
- An increase in supply moves the whole curve to the right, so a larger quantity is supplied at every price.
- On an upward-sloping line that rightward shift also sits lower down the page, which is why it is sometimes called a shift downwards.
- A decrease in supply moves the whole curve to the left, so a smaller quantity is supplied at every price.
- Draw the second curve as a complete line roughly parallel to the first, label it S2, and add an arrow showing which way it has gone.
- Use increase and decrease for a shift, and extension and contraction for a movement.
- The same dairy farm after fitting a new milking parlour: the schedule shows litres a day before and after the investment, with farmgate prices unchanged.
| Price per litre | Litres a day before | Litres a day after |
|---|---|---|
| 30p | 1,800 | 2,500 |
| 35p | 2,400 | 3,100 |
Step 1: at 30p, subtract the old quantity from the new one.
2,500−1,800=700 litres a day 2{,}500 - 1{,}800 = 700\text{ litres a day} 2,500−1,800=700 litres a dayStep 2: do the same at 35p.
3,100−2,400=700 litres a day 3{,}100 - 2{,}400 = 700\text{ litres a day} 3,100−2,400=700 litres a day- The farm offers 700 more litres a day at both prices, so the whole curve has shifted right from S to S1: an increase in supply.
Shift or movement? Ask one question
- Find the change the question describes and ask whether it is the price of this good.
- If it is, slide along the existing curve and call it an extension or a contraction of supply.
- If it is anything else, draw a second curve labelled S1 and call it an increase or a decrease in supply.
- A tax, a subsidy, a wage rise or a poor harvest all shift the curve, because none of them is the price of the good.
- Read a shift at one fixed price and quote both quantities, such as 1,800 then 2,500 litres at 30p.
- An extension of supply follows a price rise, while an extension of demand follows a price fall.
- Costs, taxes and weather shift the curve; only the good's own price slides the firm along it.
- How is a supply schedule turned into a supply curve?
- Why does the supply curve slope upwards?
- What is the only cause of a movement along the supply curve?
- Using the dairy farm figures, how many extra litres a day were supplied at 35p after the new parlour?
- How would you show a decrease in supply on a diagram?
1.3.3a Determining equilibrium price
One price makes both plans agree
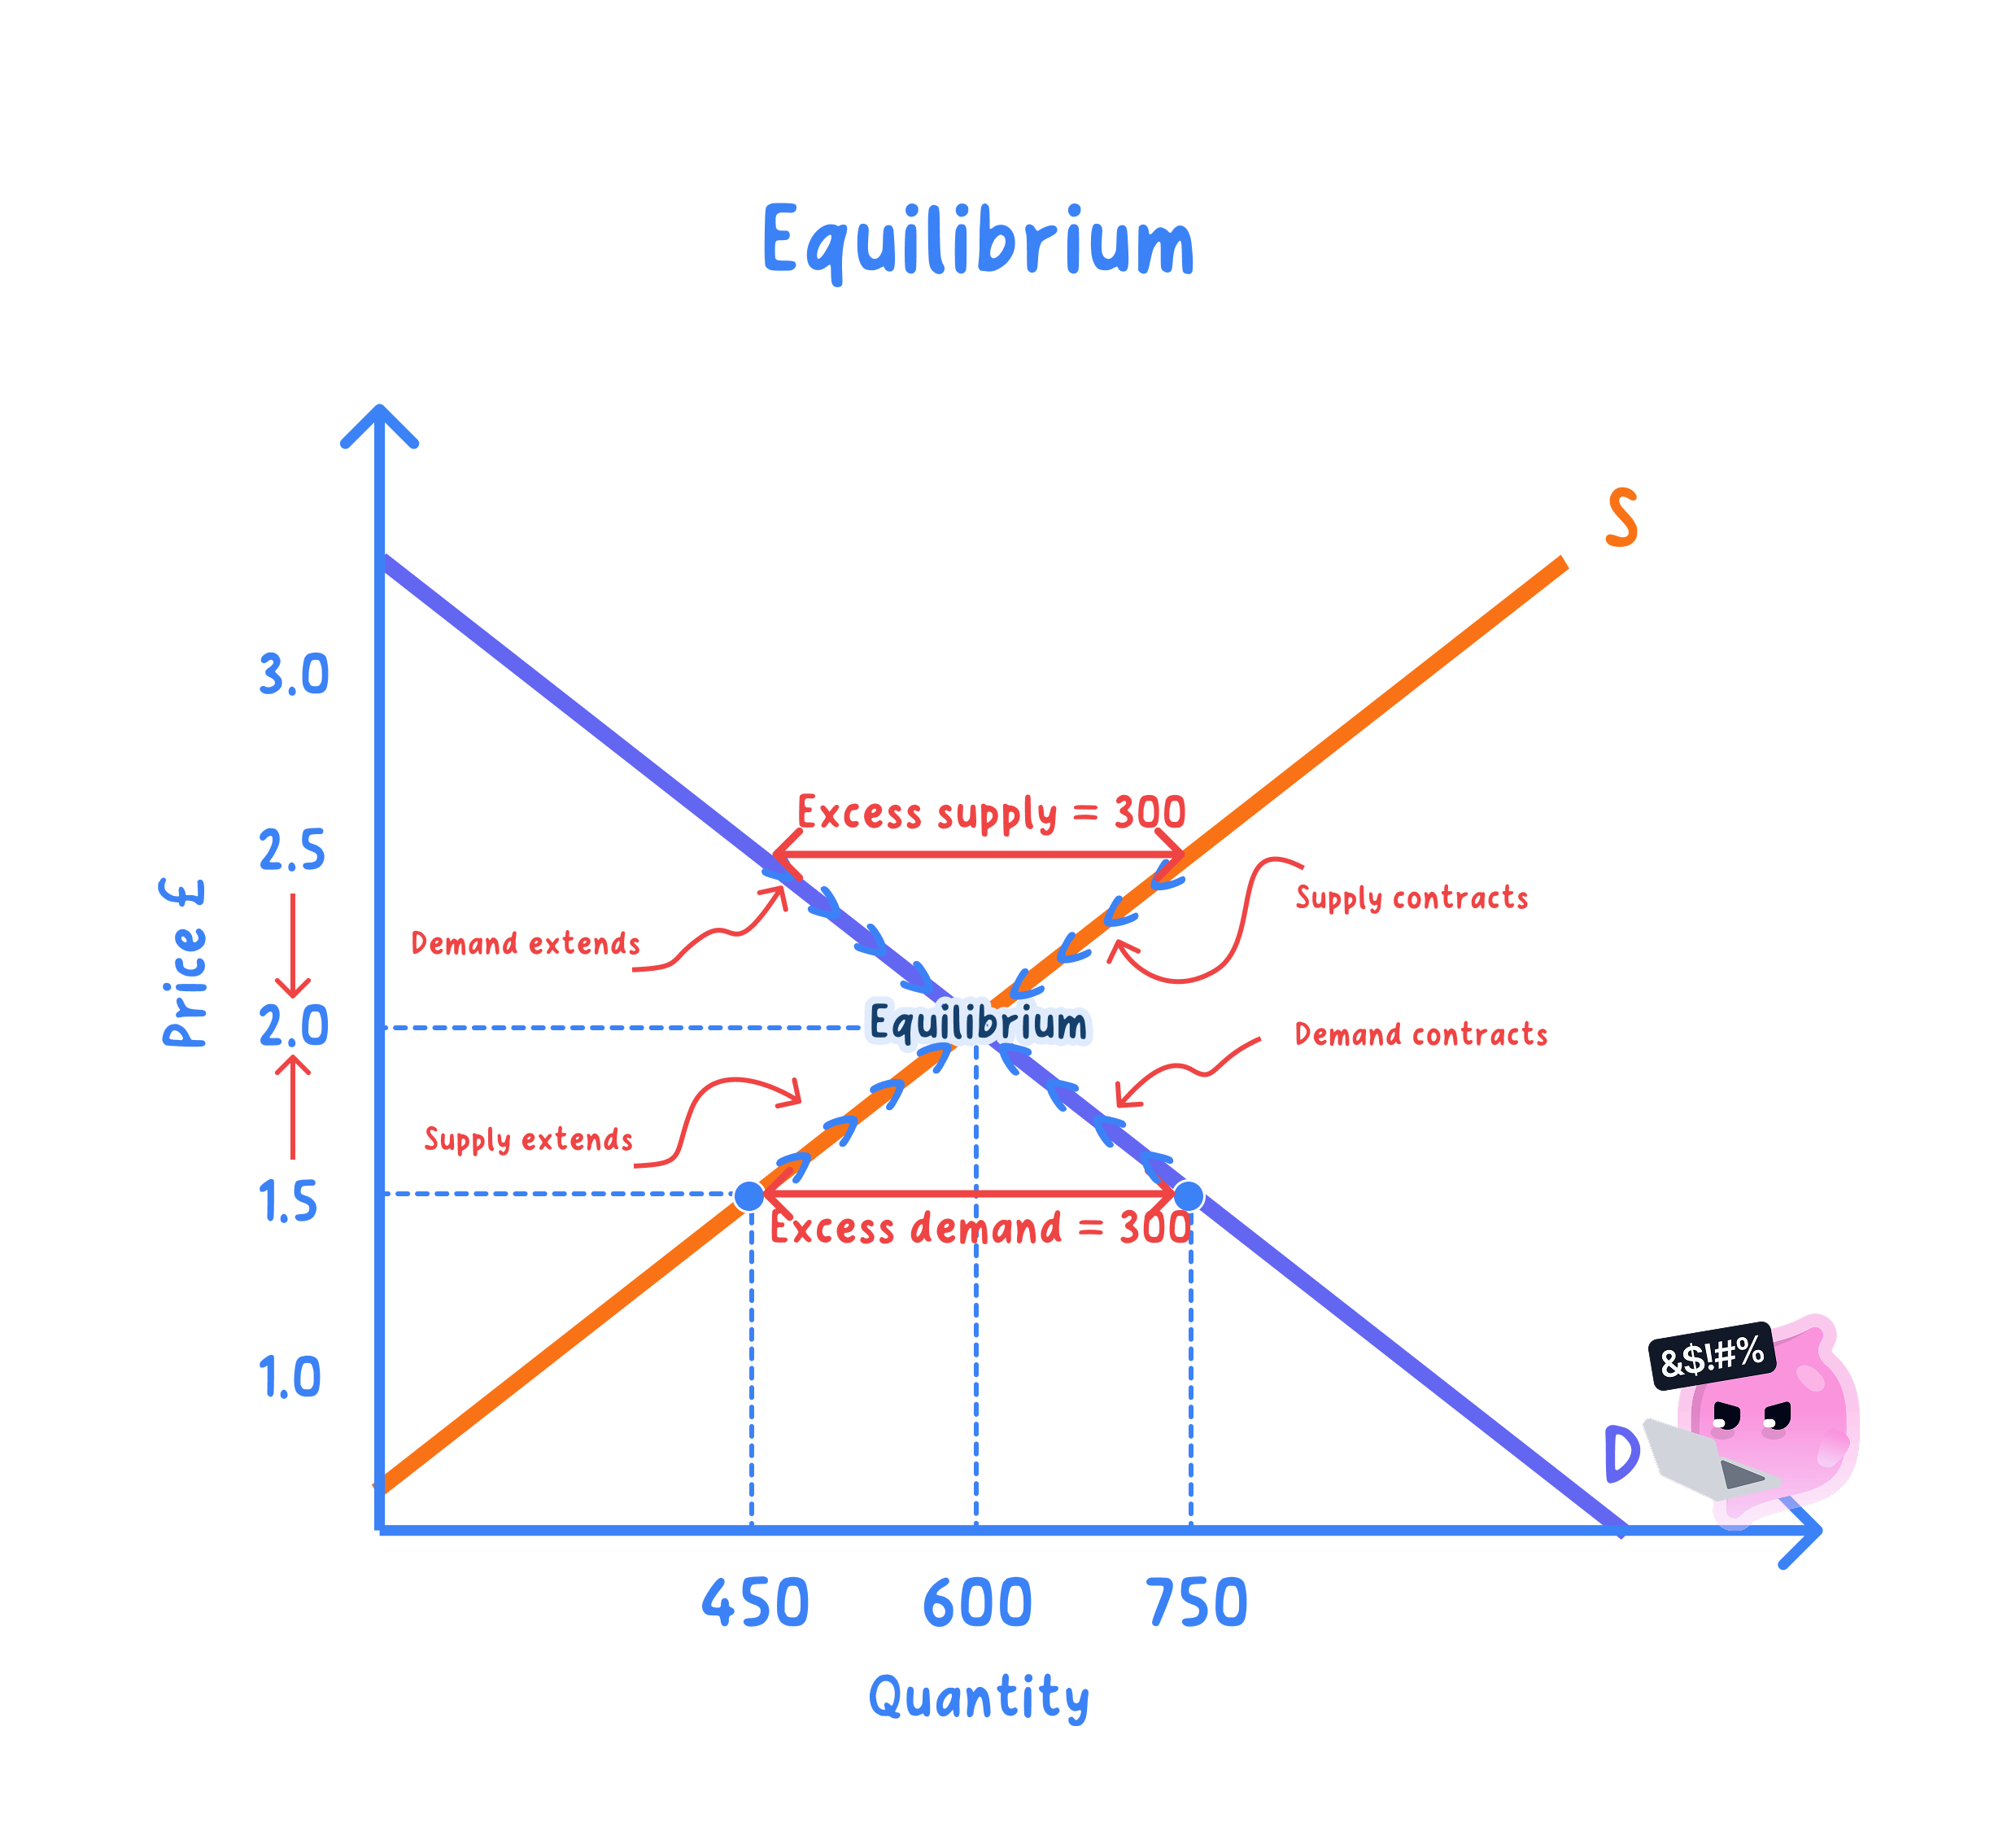
Equilibrium price: the price at which the quantity demanded equals the quantity supplied, so the market clears.
- No single buyer and no single seller chooses this price. It is the outcome of thousands of separate decisions to buy and to sell.
- Only one price does this, because the two curves slope in opposite directions and so meet at exactly one point.
- At every other price one side of the market is frustrated, and frustrated buyers or sellers are what make the price move.
- Too high a price leaves sellers holding stock they cannot sell.
- Too low a price leaves willing buyers going away with nothing.
- The equilibrium quantity is the amount actually traded at that price, read off the quantity axis.
- Once a market clears it stays there until demand or supply itself changes, because nobody is left with a reason to bid differently.
Find the row where quantities match
- A demand and supply schedule lists both quantities at each price, so the equilibrium can be found by arithmetic rather than by drawing.
- Work down the schedule subtracting quantity supplied from quantity demanded: the equilibrium is the row where that subtraction gives zero.
- A positive answer is excess demand and a negative answer is excess supply.
- The two quantities move in opposite directions as you read down the price column, which is why the gap changes sign only once.
- The UK market for 2 kg bags of British potatoes: quantities are thousands of bags a week.
| Price | Quantity demanded | Quantity supplied | Gap |
|---|---|---|---|
| £1.00 | 900 | 300 | +600, excess demand |
| £1.50 | 750 | 450 | +300, excess demand |
| £2.00 | 600 | 600 | 0, the market clears |
| £2.50 | 450 | 750 | -300, excess supply |
| £3.00 | 300 | 900 | -600, excess supply |
Step 1, test £1.00 by subtracting quantity supplied from quantity demanded.
900−300=+600 thousand bags 900 - 300 = +600\text{ thousand bags} 900−300=+600 thousand bagsStep 2, test £3.00 the same way.
300−900=−600 thousand bags 300 - 900 = -600\text{ thousand bags} 300−900=−600 thousand bagsStep 3, the sign has changed, so test the price in between.
600−600=0 thousand bags 600 - 600 = 0\text{ thousand bags} 600−600=0 thousand bags- The equilibrium price is £2.00 a bag and the equilibrium quantity is 600 thousand bags a week, the only row where neither side is frustrated.
- The gap narrows from 600 thousand bags at £1.00 to 300 thousand at £1.50 and to nothing at £2.00, which is the adjustment below happening one step at a time.
Excess supply pushes the price down
Excess supply: the amount by which quantity supplied exceeds quantity demanded at a price above the equilibrium price, known in everyday language as a surplus.
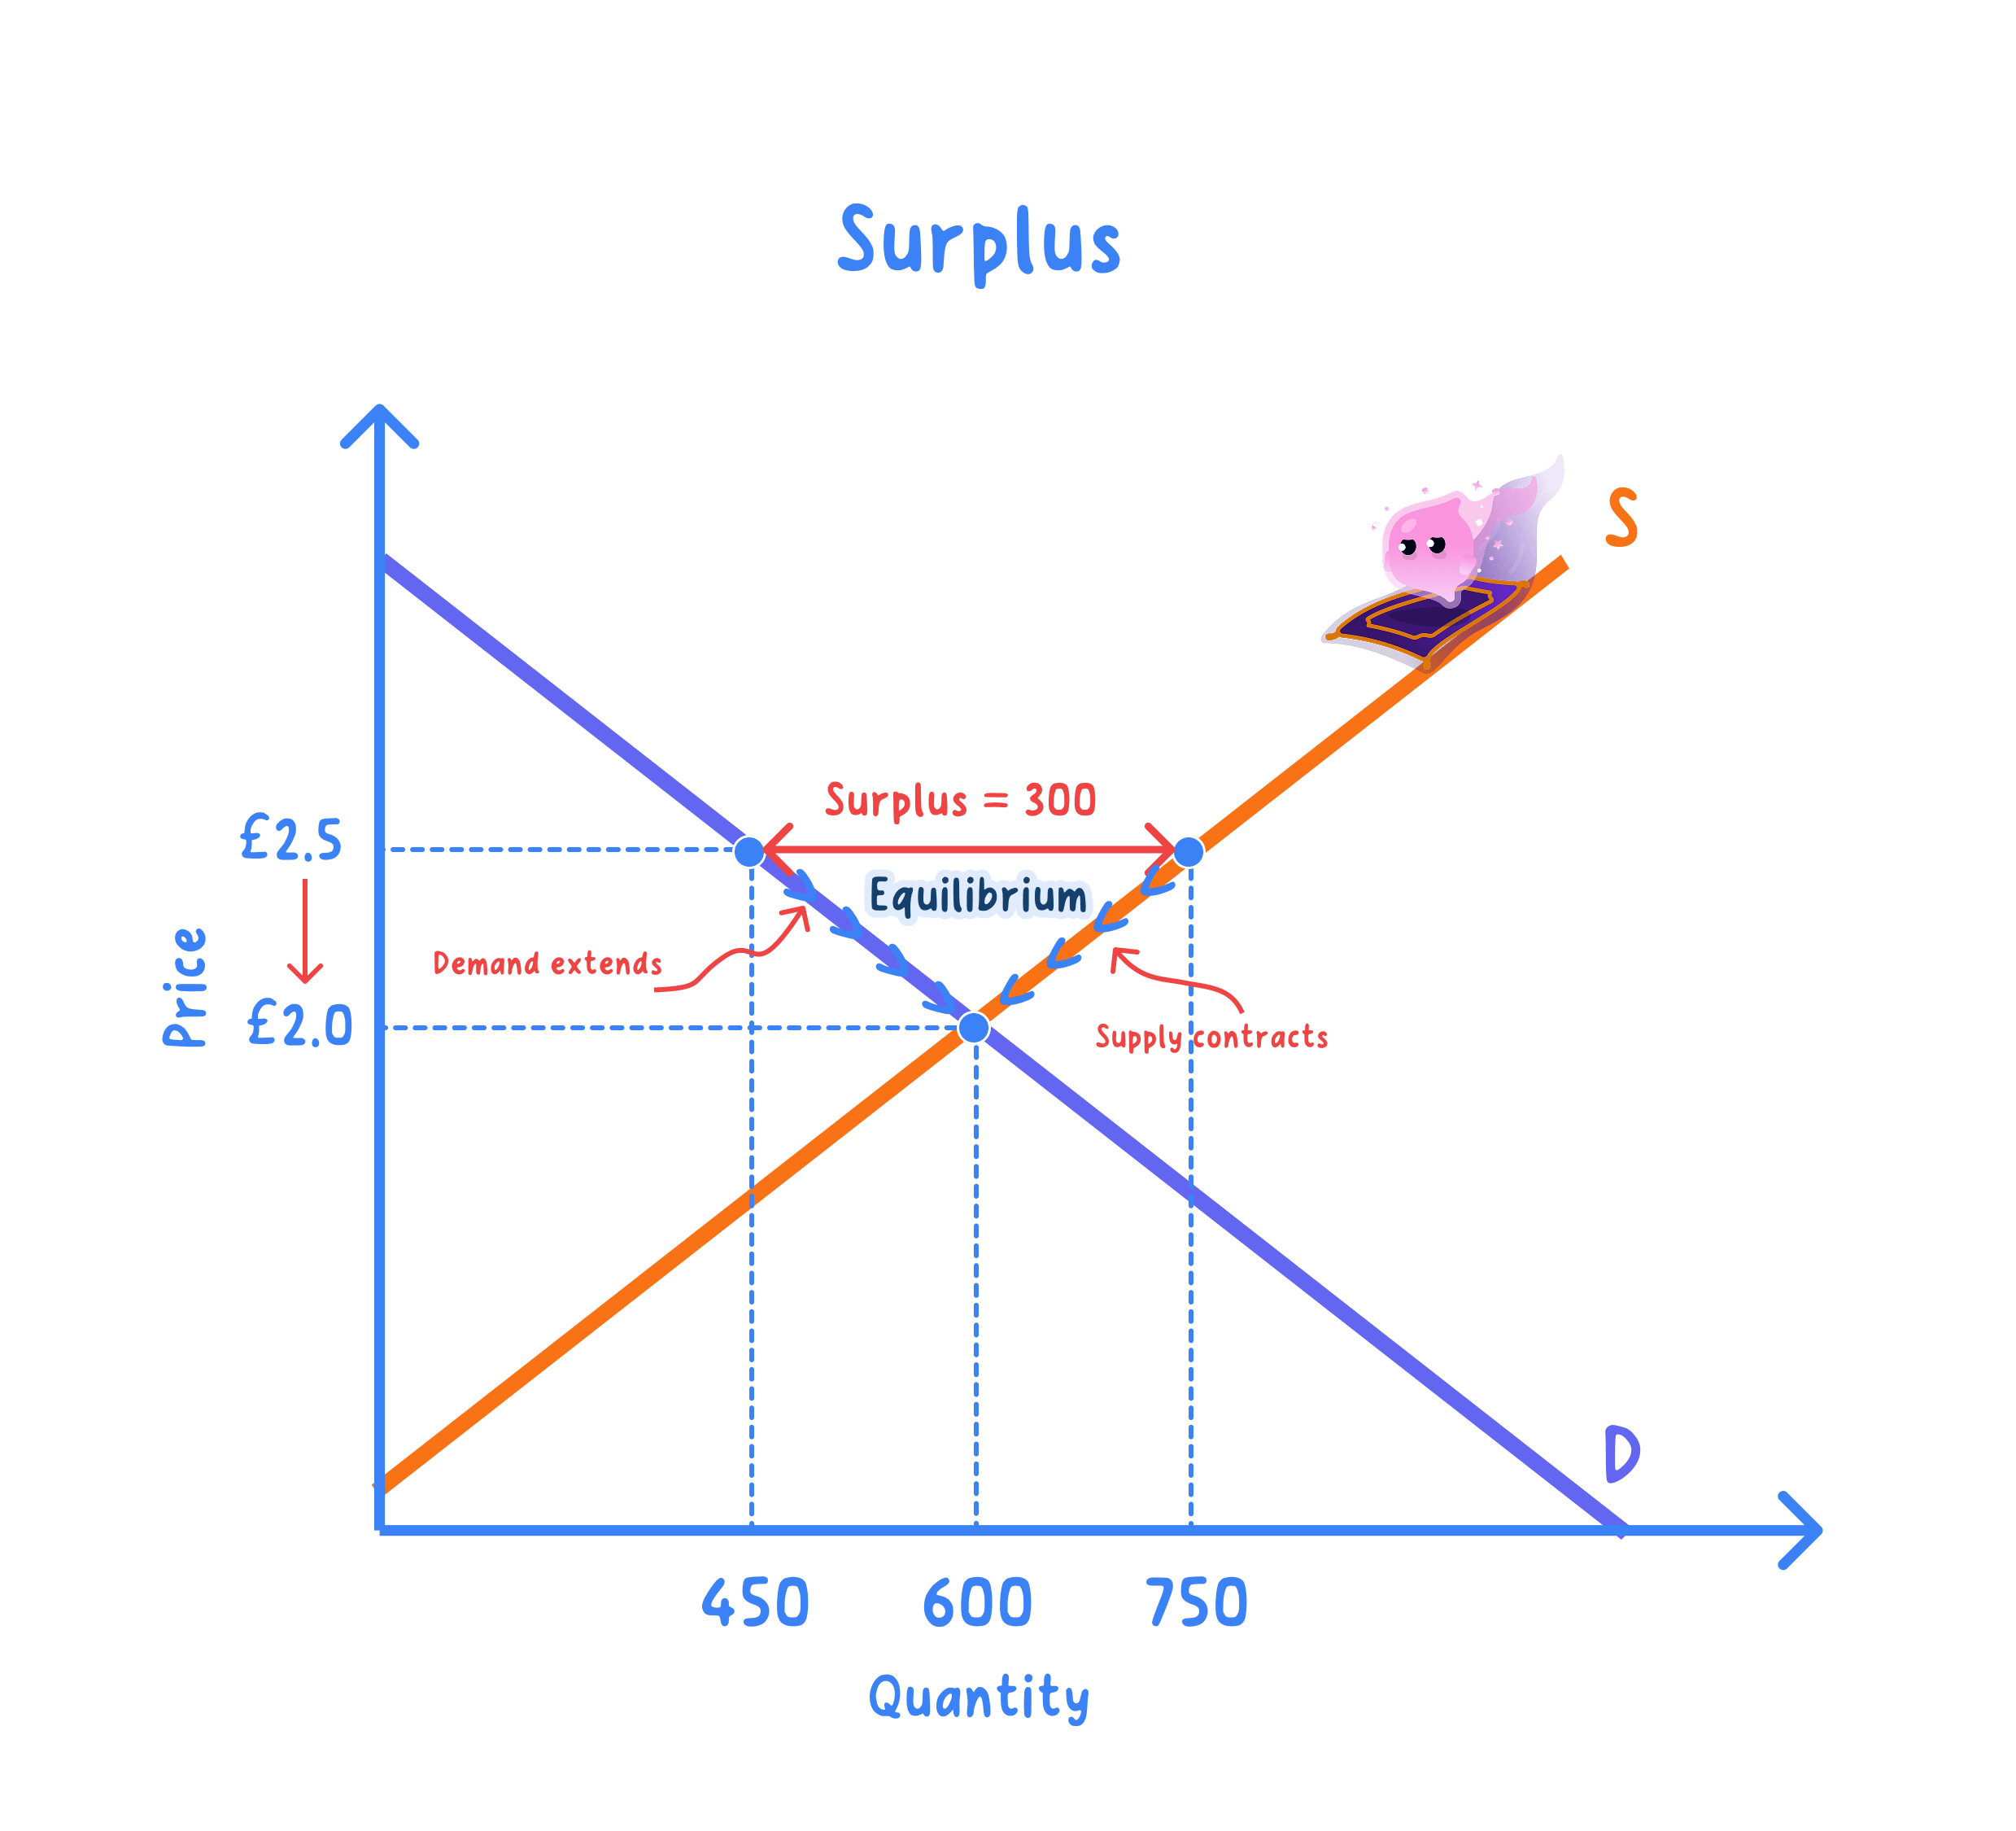
- Start at £2.50, where growers offer 750 thousand bags a week but shoppers want only 450 thousand.
- The 300 thousand unsold bags cost money to store and will eventually rot, so at least one seller cuts the price to shift them.
- Rivals must match the cut or watch their own bags sit unsold, so the lower price spreads.
- The lower price makes potatoes better value against everything else in the trolley, so quantity demanded extends along the unchanged demand curve.
- It also makes the least efficient growers unprofitable, so quantity supplied contracts along the unchanged supply curve.
- Those two movements attack the gap from opposite ends at once, so the surplus is smaller after every cut.
- Cutting stops at £2.00, because no seller is left with stock to clear.
- Excess demand does not mean demand has risen: no curve has moved, the price is simply too low.
- Sellers do not pick the equilibrium price: name a higher one and stock goes unsold.
- A shortage is not scarcity: scarcity is permanent, a shortage is one market at one price.
Excess demand pushes the price up
Excess demand: the amount by which quantity demanded exceeds quantity supplied at a price below the equilibrium price, known in everyday language as a shortage.
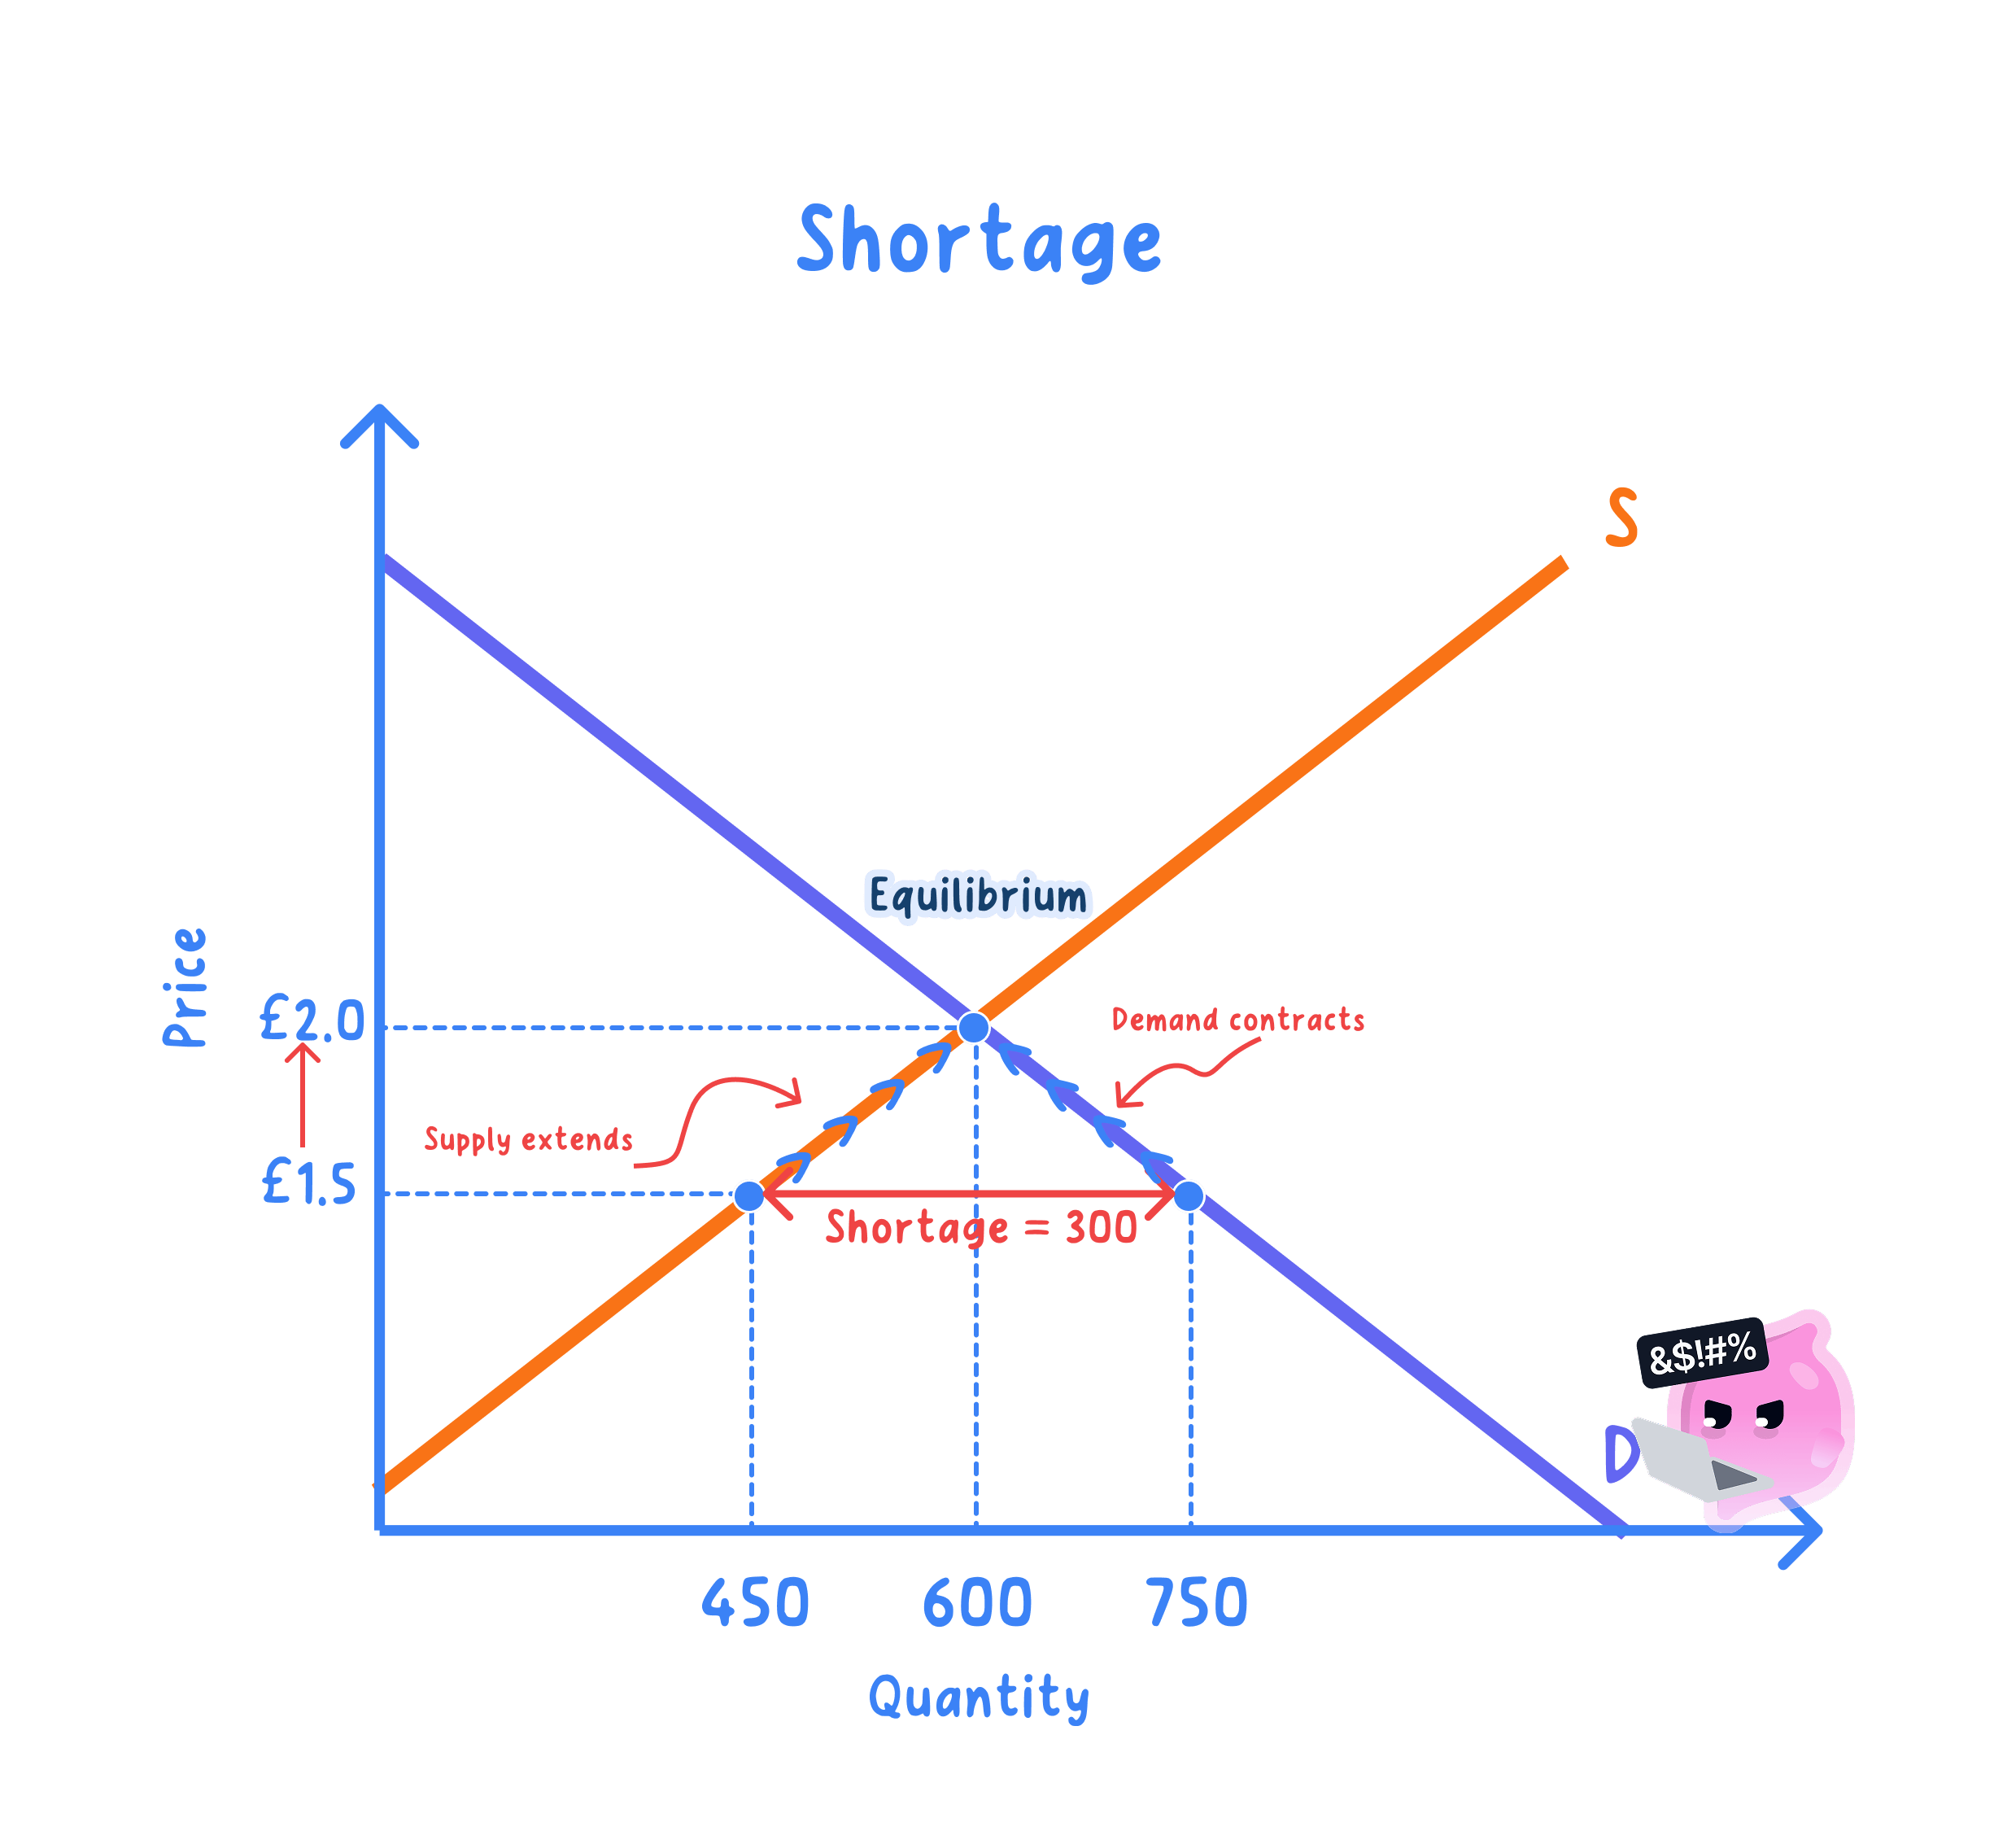
- Start at £1.50 instead, where shoppers want 750 thousand bags a week but growers offer only 450 thousand.
- Shelves empty early and 300 thousand bags' worth of buyers go away with nothing, so sellers learn they can charge more and still sell everything.
- Buyers compete for what is left, which is why a shortage in a resale market shows up as buyers openly bidding the price up.
- The higher price prices out the buyers who valued the good least, so quantity demanded contracts along the unchanged demand curve.
- It also makes it worth planting and lifting more, so quantity supplied extends along the unchanged supply curve.
- The shortage therefore shrinks with every rise, from 300 thousand bags at £1.50 to nothing at £2.00.
- Because both adjustments push towards the same single price, a competitive market is self-correcting, with nobody in charge of the outcome.
- Compare the given price with the equilibrium price first: that alone settles whether it is excess demand or excess supply.
- Show the subtraction and give the units, so 750 minus 450 is a surplus of 300 thousand bags a week.
- Say extends or contracts for the return to equilibrium, and save shift for a change in demand or supply.
- At the equilibrium price, how does quantity demanded compare with quantity supplied?
- In the potato schedule, what are the equilibrium price and quantity?
- At £2.50 a bag, is there excess demand or excess supply, and how big is it?
- Which way does excess demand push the price, and why?
- Why does quantity supplied contract as the price falls?
1.3.3b Applying diagrams and showing revenue
Price moves until demand and supply match again
- Equilibrium: the price at which quantity demanded equals quantity supplied.
- A shift in demand or supply creates a shortage or surplus at the old equilibrium price.
- Shortage: quantity demanded is greater than quantity supplied, so price tends to rise.
- Surplus: quantity supplied is greater than quantity demanded, so price tends to fall.
- Price changes until quantity demanded and quantity supplied are equal again at the new equilibrium.
- Read the new price and quantity from the new crossing point of the two curves.
- If demand shifts, price and quantity move in the same direction; if supply shifts, they move in opposite directions.
- A demand increase raises equilibrium price and quantity; a demand decrease lowers both.
- A supply increase lowers price and raises quantity; a supply decrease raises price and lowers quantity.
- Four changes, four markets: shift one curve and read the new price and quantity from the new crossing point.
| Change | Curve | Price | Quantity | UK example |
|---|---|---|---|---|
| Demand rises | Right | Rises | Rises | Ice cream |
| Demand falls | Left | Falls | Falls | Gas |
| Supply rises | Right | Falls | Rises | Wheat harvest |
| Supply falls | Left | Rises | Falls | Nissan Sunderland |
- Examples of the triggers: a heatwave increases demand for ice cream; a mild winter reduces demand for gas; a good harvest increases wheat supply; a chip shortage reduces car supply.
- Demand shifts move price and quantity together. Supply shifts move them in opposite directions.
- For example, a supply fall in cars can raise price while reducing the number sold.
The same curves fit any market
- Any market: the same demand-and-supply reasoning applies wherever buyers and sellers respond to price.
- Before using the model, identify the buyers, sellers and unit traded.
- For electricity, buyers are households and firms; sellers are generators and suppliers; the unit is a kilowatt hour.
- For rented flats, buyers are tenants; sellers are landlords; the unit is a tenancy for a stated period.
- The model applies to services as well as goods, such as haircuts, train journeys and plumbers’ hours.
- Markets differ in how quickly supply can adjust, but the direction of the equilibrium change is found in the same way.
- In the short run, a fixed supply, for example, seats at a sold-out concert, can make the price response much larger.
- Shift one curve only unless the question gives a reason for both to shift.
- A change in the good’s own price causes a movement along a curve, not a shift.
- Keep and label the old and new equilibrium when comparing diagrams.
Revenue is the rectangle under equilibrium
Total revenue: the money a producer receives from selling output. It is calculated as total revenue = price × quantity sold.
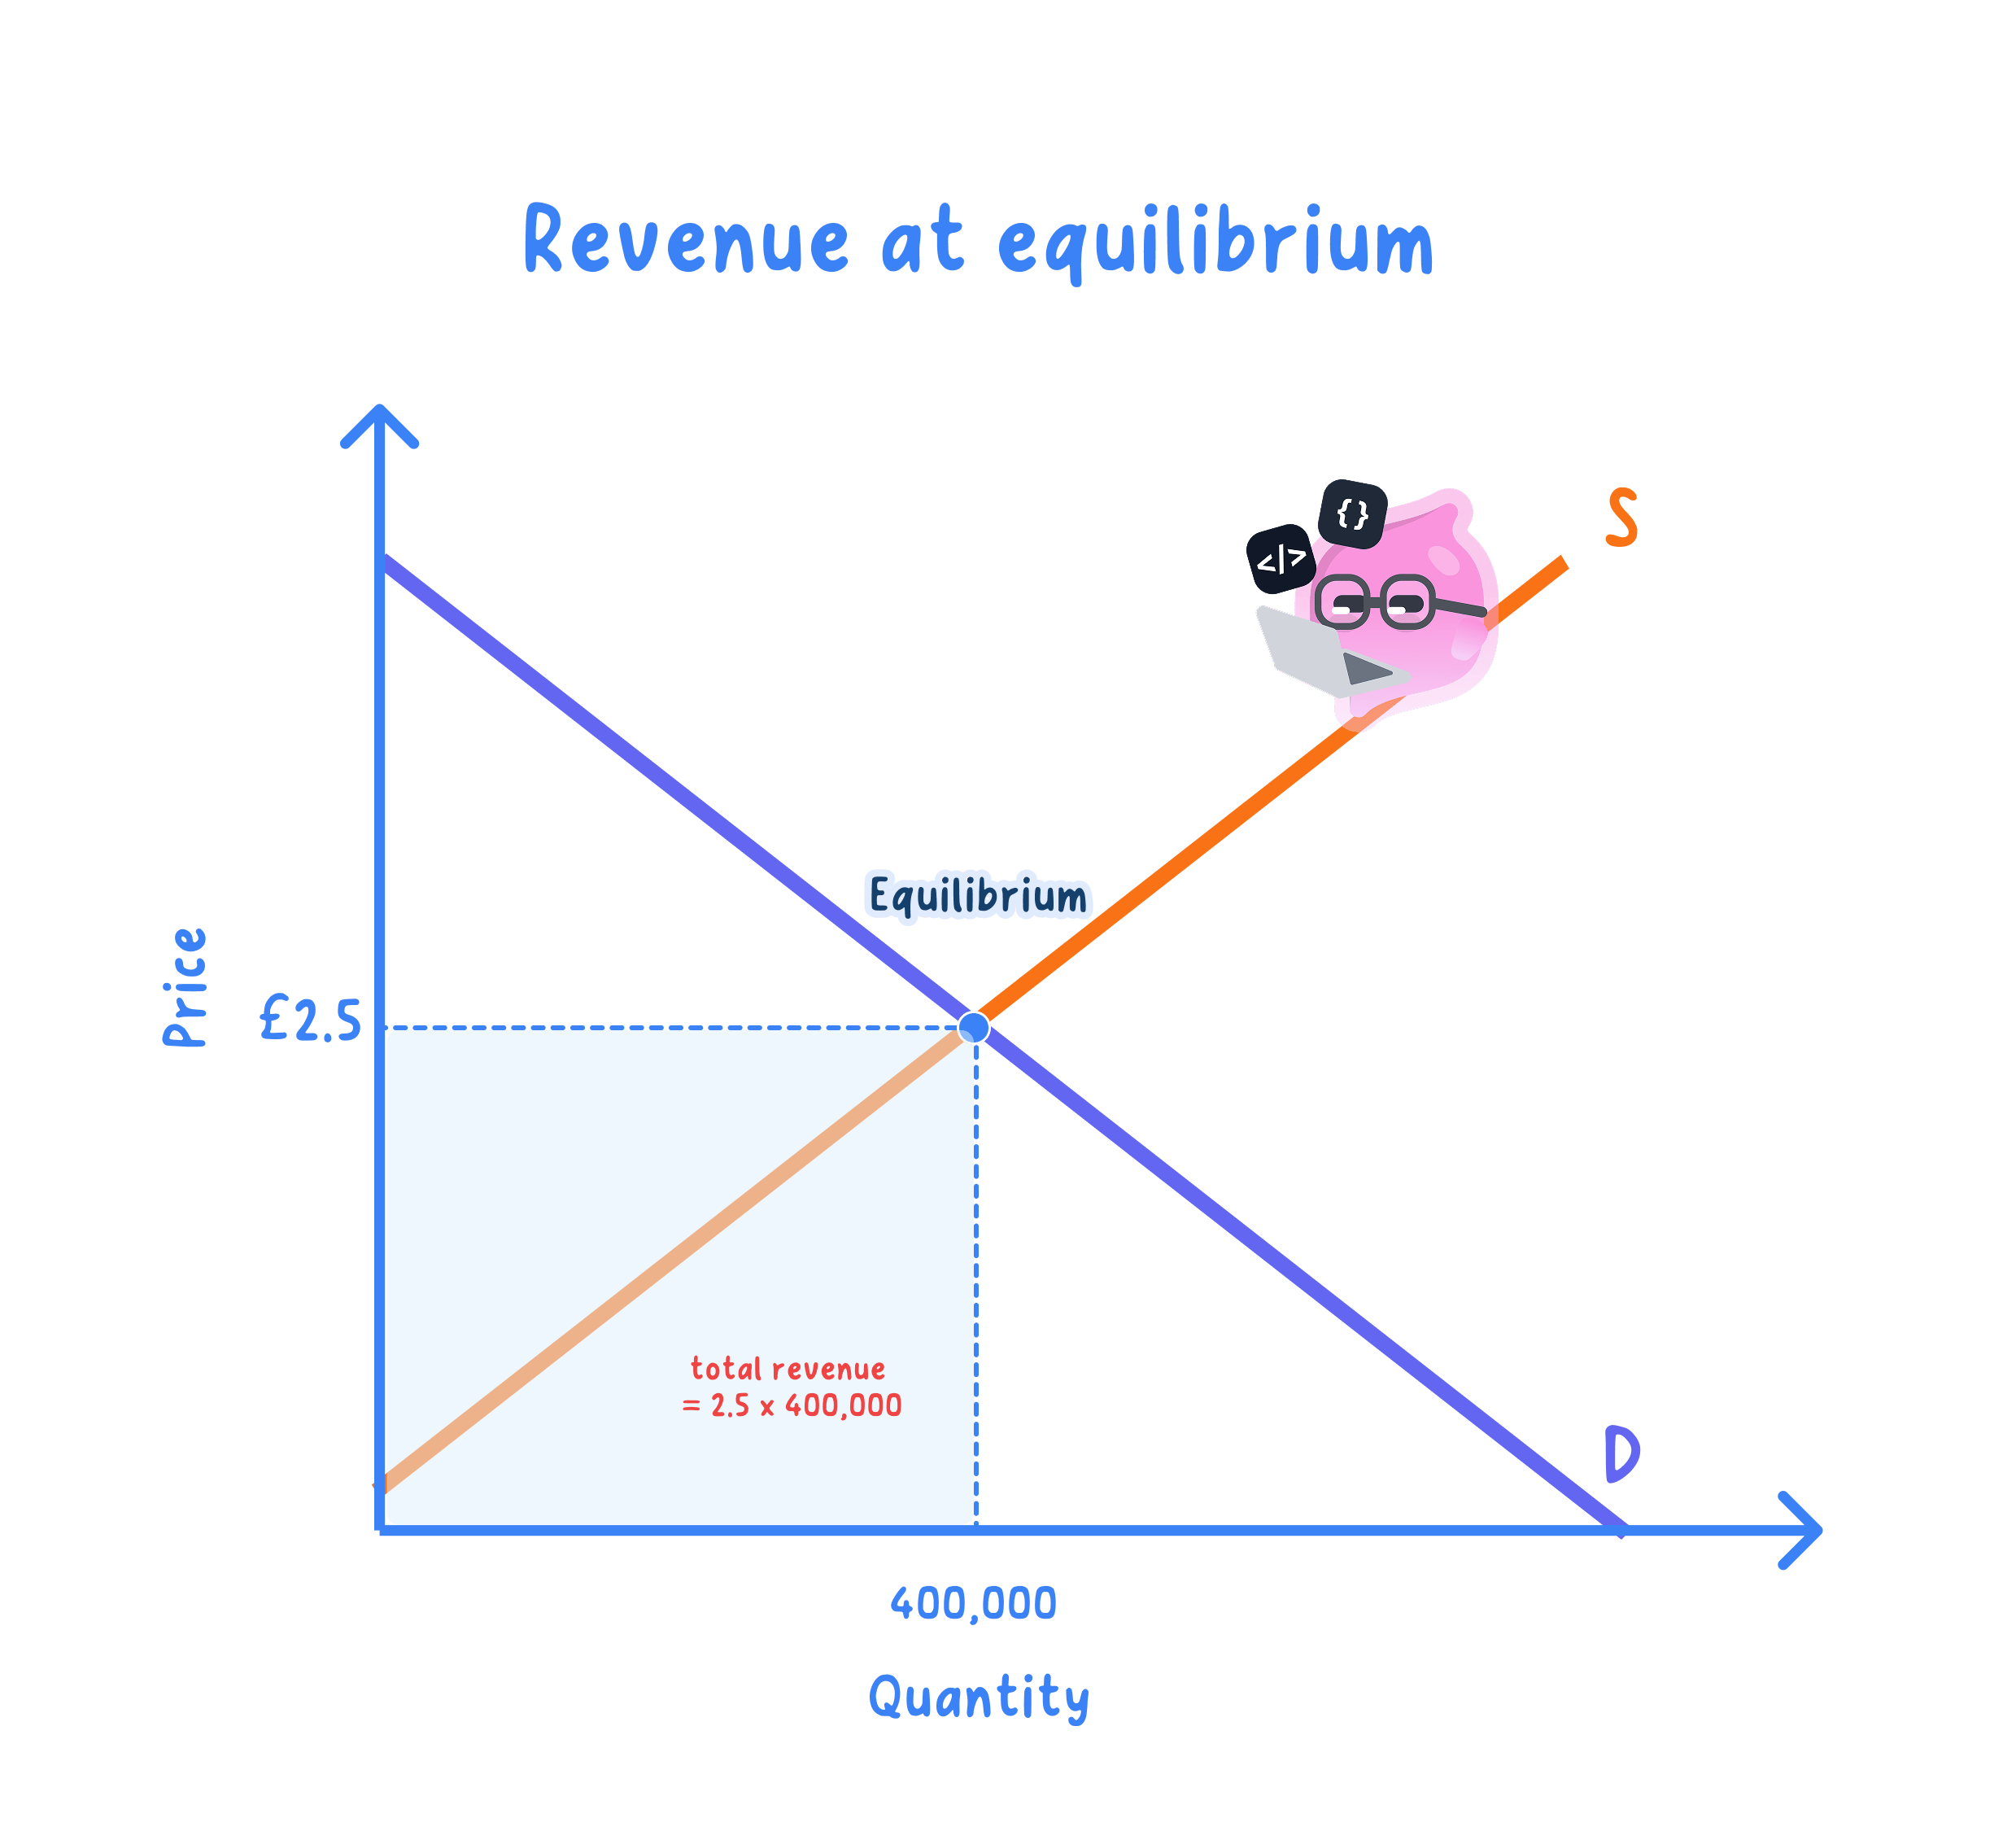
- On a demand-and-supply diagram, total revenue is shown by the rectangle from the origin to the equilibrium point.
- The rectangle’s height is the equilibrium price and its width is the equilibrium quantity.
- When equilibrium changes, both the height and width of the revenue rectangle may change.
- After a demand shift, price and quantity move in the same direction, so total revenue moves in that direction too.
- After a supply shift, price and quantity move in opposite directions, so calculate price × quantity rather than guessing.
- The UK market for British strawberries: initially, strawberries sell for £2.50 and 400,000 punnets are sold each week.
- The first diagram shows this £1,000,000 as the revenue rectangle at the original equilibrium.
- A warm spring produces a heavy crop. Supply shifts right, price falls to £2.00 and quantity sold rises to 550,000 punnets.
- The rectangle becomes shorter but wider; quantity rises enough to make total revenue £100,000 higher.
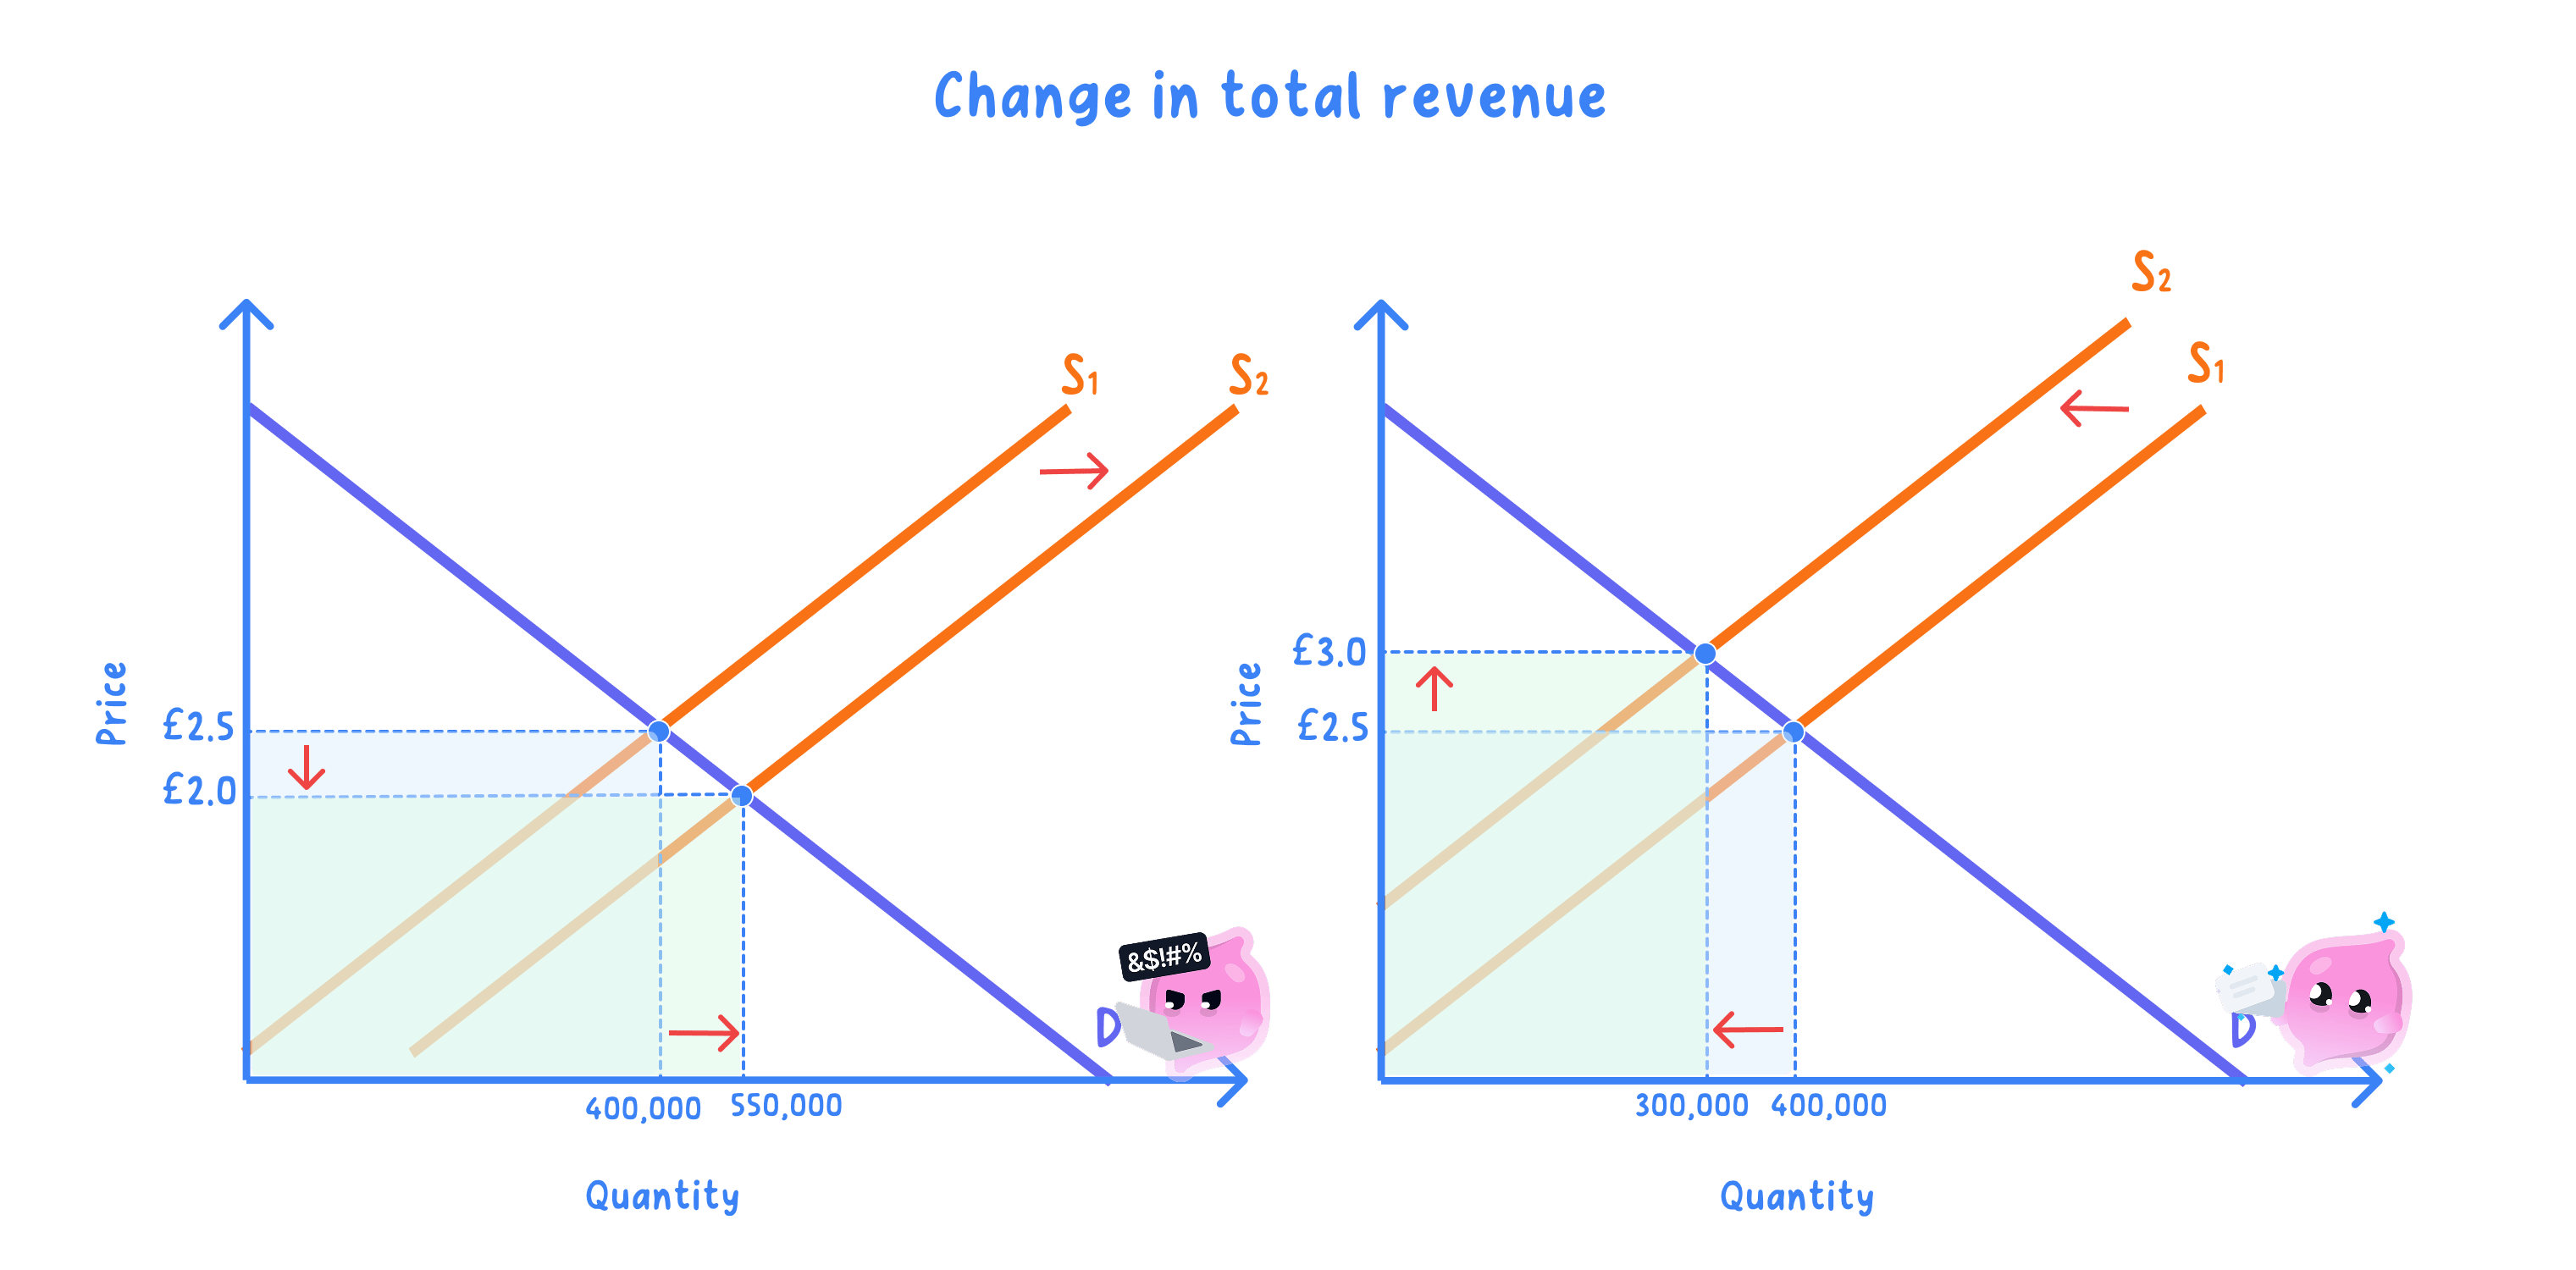
- If a frost shifts supply left instead, price rises to £3.00 and quantity falls to 300,000 punnets.
- Here the rectangle is taller but much narrower, so revenue falls. This is why a supply change must be calculated, not guessed.
Revenue is not the same as profit
- Revenue is the money received from sales before any costs are deducted.
- Profit is revenue minus costs.
- A rise in revenue does not necessarily mean a rise in profit, because costs may also have changed.
- Calculate price × quantity for each equilibrium on separate lines.
- Then subtract and state whether total revenue rose or fell.
- Write revenue, not profit, unless the question gives costs.
- How do you find the new equilibrium after a curve shifts?
- What happens to equilibrium price and quantity when supply increases?
- Which curve shifts when a mild winter reduces demand for gas?
- Which area on a demand-and-supply diagram represents total revenue?
- At £2.50 and 400,000 punnets, what is total revenue?
1.3.4a Complements and substitutes
Related goods are alternatives or pairs
Substitute goods: goods a buyer can use in place of one another to meet the same want, so buying one normally means not buying the other.
Complementary goods: goods a buyer uses together, so buying one makes buying the other more likely.
- The link lives in the buyer's use of the two goods rather than in the goods themselves, so the same pair can be related for one household and unrelated for another.
- An exam question may use the other names, calling substitutes goods in competitive demand and complements goods in joint demand.
- Either link comes in degrees rather than as a yes or no, so a pair can be closely or only loosely linked.
- Two jars of instant coffee on the same Tesco shelf are close substitutes, because they do practically the same job.
- Coffee and orange juice are weak substitutes, because only a few drinkers would swap one for the other at breakfast.
- A games console and its games are tightly complementary, while strawberries and cream are only loosely so.
- Most pairs of goods are neither, so bread and shoelaces are simply unrelated, and spotting that is as much a part of the skill as spotting a link.
Test it with a price rise
- Take the two goods, imagine the price of the first one rising, and ask what happens to demand for the second.
- If demand for the second good rises, the two are substitutes, because buyers put off by the dearer good have moved across to the alternative.
- If demand for the second good falls, the two are complements, because buyers cutting back on the dearer good need less of its partner as well.
- If demand for the second good does not move at all, the two goods are unrelated.

- Bought in the same trip is not a complement: used together means used to do one job.
- Made by rival firms is not a substitute: Nissan and a bakery chain compete for nobody's custom.
- A cheaper version is not a substitute: a smaller loaf is still the same product.
Named UK pairs, side by side
- The clearest substitutes are two versions of the same thing sold beside each other, and the clearest complements are two things that only work as a pair.
- Reading a pair aloud with the words instead of and then as well as usually settles it, because only one of the two phrases makes sense of the pair.
- Unrelated pairs belong in the same table, because a question often includes one to check that the link is being tested rather than assumed.
- Some examples are given below
| Pair | Link | Behaviour |
|---|---|---|
| Heinz beans, Tesco beans | Substitute | One tin, not both |
| Printer, ink | Complement | Buys ink repeatedly |
| Nissan Leaf, petrol | Unrelated | Never buys petrol |
- Testing the first row, dearer Heinz sends some shoppers to the own-label tin, so demand for it rises and the pair are substitutes.
- The same logic covers the rest of the table!
Borderline pairs turn on the buyer's use
- A pair can be substitutes for one buyer and unrelated for another, so a rail season ticket and a car are alternatives for a Leeds commuter but not for somebody who works from home.
- A pair can also change category as technology changes, since a DVD and a streaming subscription only became substitutes once streaming existed in UK homes.
- The same product can even sit on both sides of the line depending on the use in question.
- A mobile phone and a landline are substitutes for making a call, since one call goes down one line or the other.
- A mobile phone and a data plan are complements, since the phone cannot do most of its job without the data.
- Where a pair really is borderline, say which use you are assuming and then answer, because the marks are for the reasoning rather than for the label.
- What is a substitute good, and what is a complementary good?
- Which term goes with joint demand, and which with competitive demand?
- Are a printer and its ink cartridges substitutes or complements, and why?
- State the test that tells you which link a pair of goods has.
- Why are two jars of instant coffee closer substitutes than coffee and orange juice?
1.3.4b Effects of changes on related markets
A change arrives next door as a demand shift
- Every chain has the same four links: something changes in the first market, its equilibrium price moves, buyers' plans change in the related market, and that market settles at a new equilibrium.
- What arrives in the second market is a shift of demand, because it is the price of some other good that has changed, not the price of the good traded there.
- A movement along the second market's demand curve would leave its price exactly where it started.
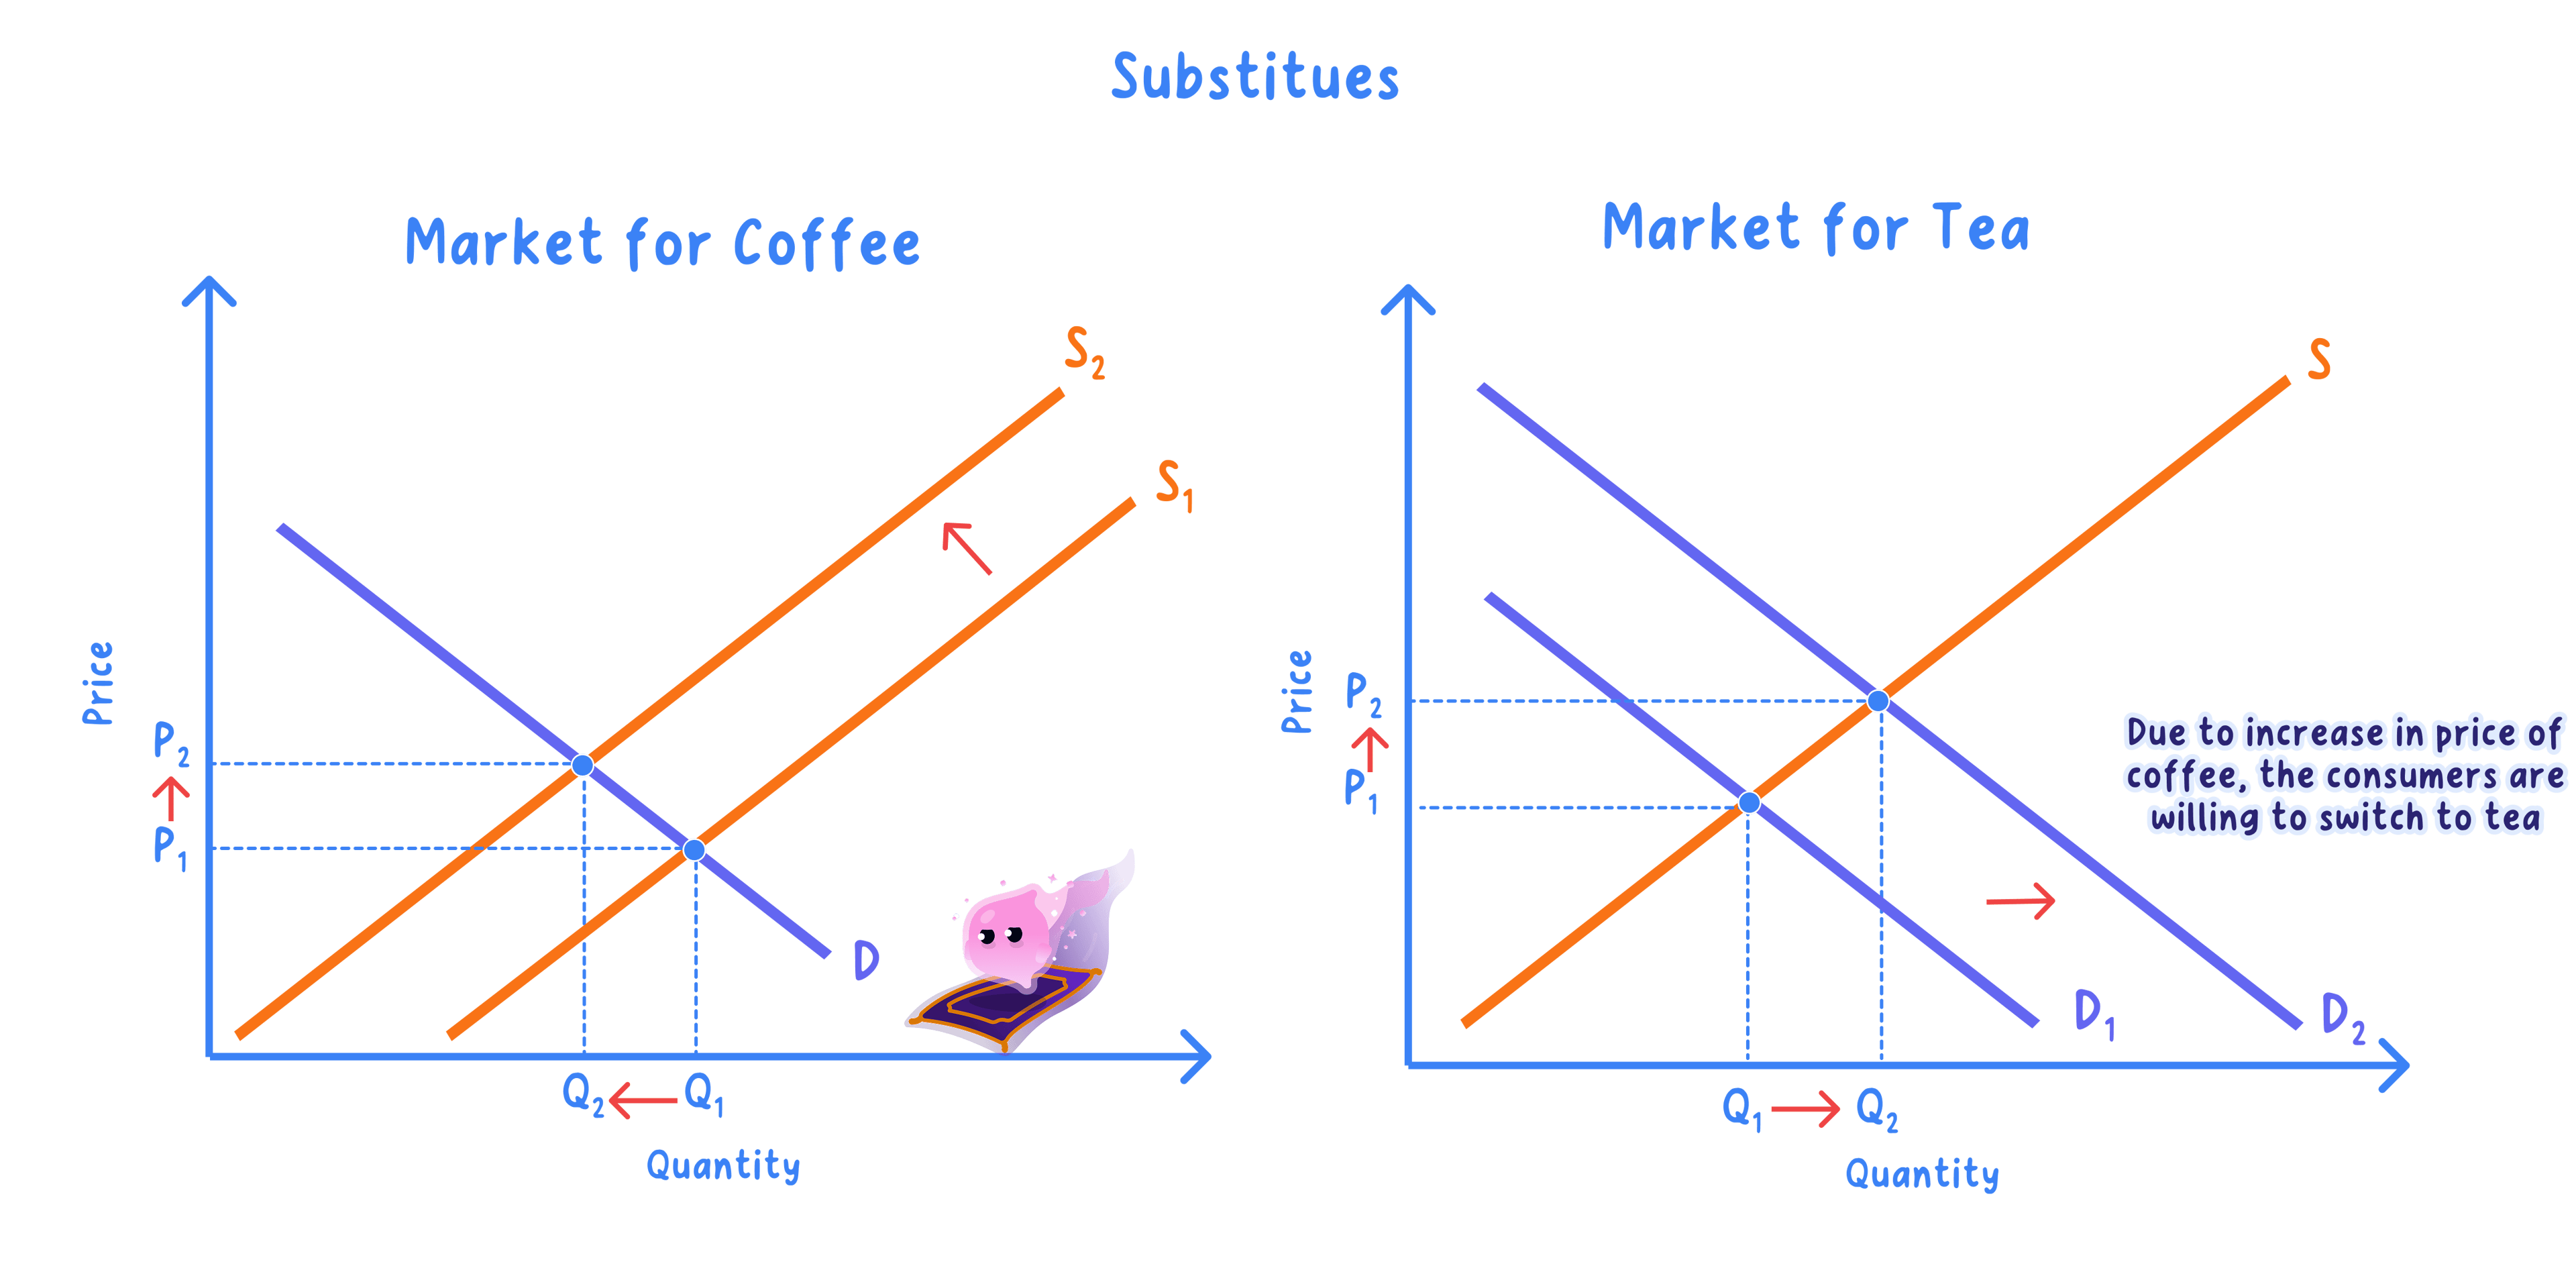
- A rise in the price of one good shifts demand for its substitute to the right, so that market's equilibrium price and quantity both rise.
- A rise in the price of one good shifts demand for its complement to the left, so that market's equilibrium price and quantity both fall.
- The second market can pass the change on again to a third, which is how a shock reaches markets that look entirely unconnected to it.
- Chain one, Brazilian coffee to a UK box of tea: a substitute link.
- Frost damages the Brazilian coffee crop, so the supply of coffee beans shifts left.
- The UK equilibrium price of a jar rises from about £4.00 to about £5.00 and fewer jars are sold.
- The tea is a substitute, so demand for Tea shifts right at every tea price level.
- The new equilibrium / crossing point sits further up that unchanged supply curve, so the equilibrium price of a box of tea rises and the quantity traded rises too.
- Tea became dearer and tea growers gained, which is what economists mean by interdependent markets.
The complement chain reverses the demand shift
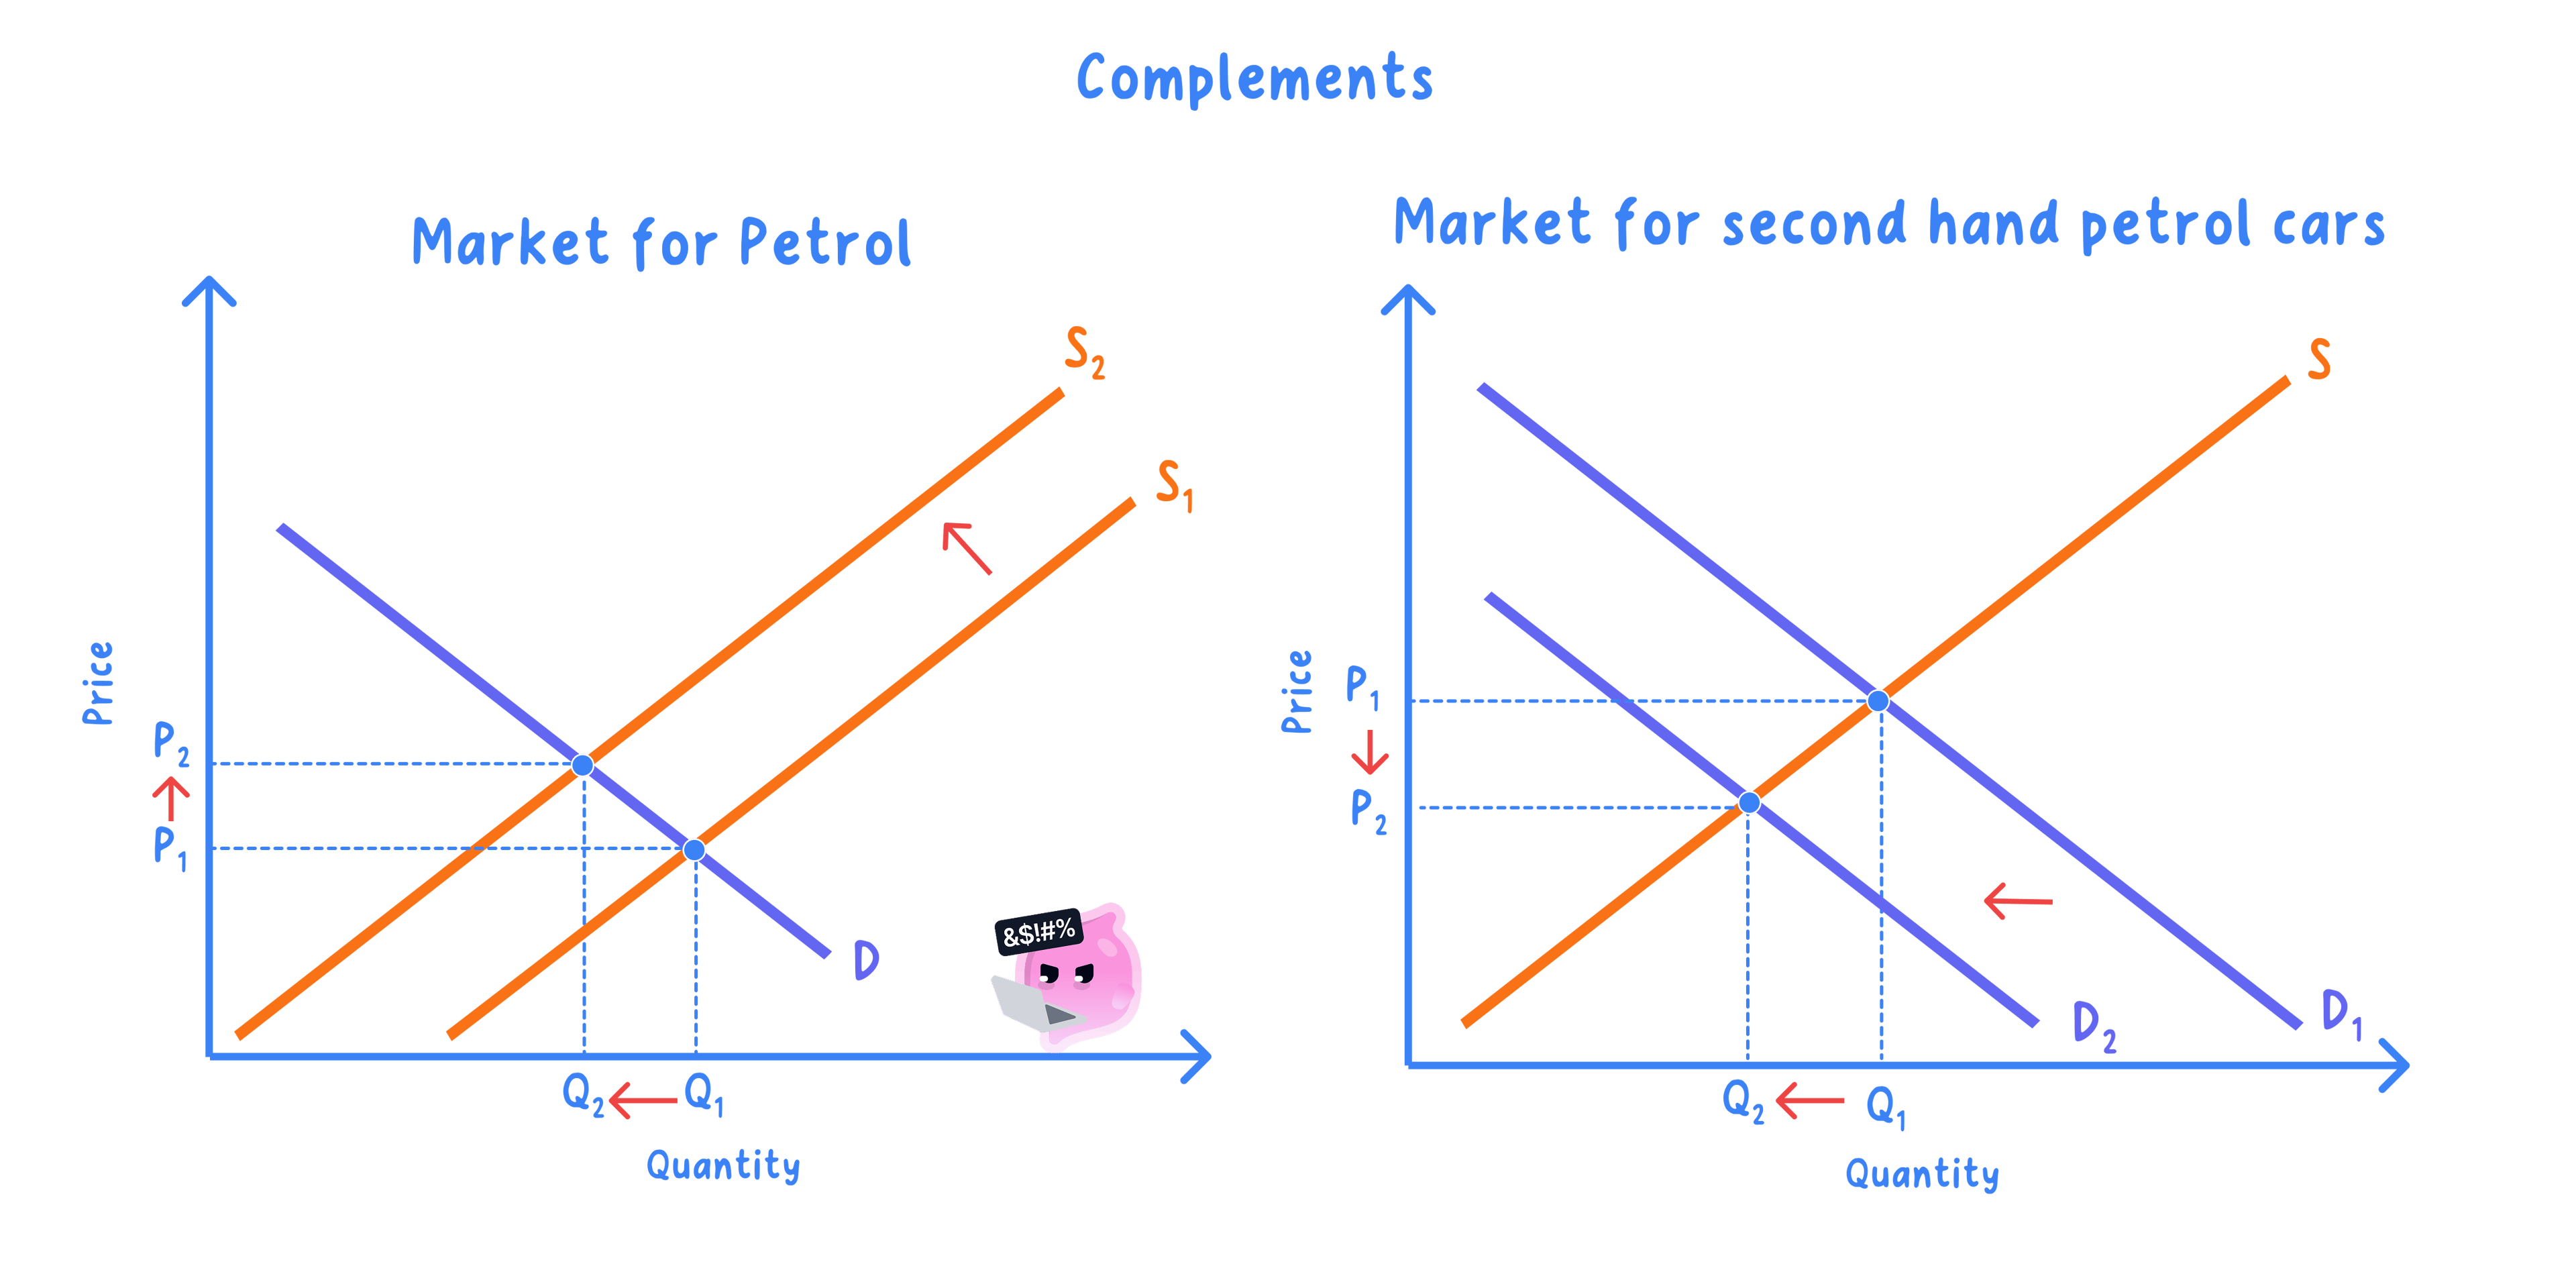
- Chain two, fuel duty to a second-hand petrol car: a complement link.
- The Chancellor raises fuel duty, which adds to the cost of putting petrol on a forecourt, so the supply of petrol shifts left.
- The equilibrium pump price rises from about £1.40 to about £1.55 a litre and the litres sold fall.
- Petrol and a large petrol car are complements, so running one has become dearer and demand for large second-hand petrol cars shifts left at every price.
- The new crossing point sits further down that unchanged supply curve, so the equilibrium price of these cars falls and the quantity traded falls too.
- A duty collected at the pump has cut the price of a used car without touching the car market directly at any point.
Two links work without buyers switching
Derived demand: demand for a good, service or worker that exists only because there is demand for something else they help to produce.
- Derived demand runs down the production chain, so a change in the market for a finished product lands on the markets for everything used to build it.
- Nissan's Sunderland plant is the clearest UK case: fewer car orders there means fewer orders for steel, tyres, paint and assembly hours.
- The demand shift in the input market points the same way as the change in the final market, since the input is wanted for nothing except what it builds.
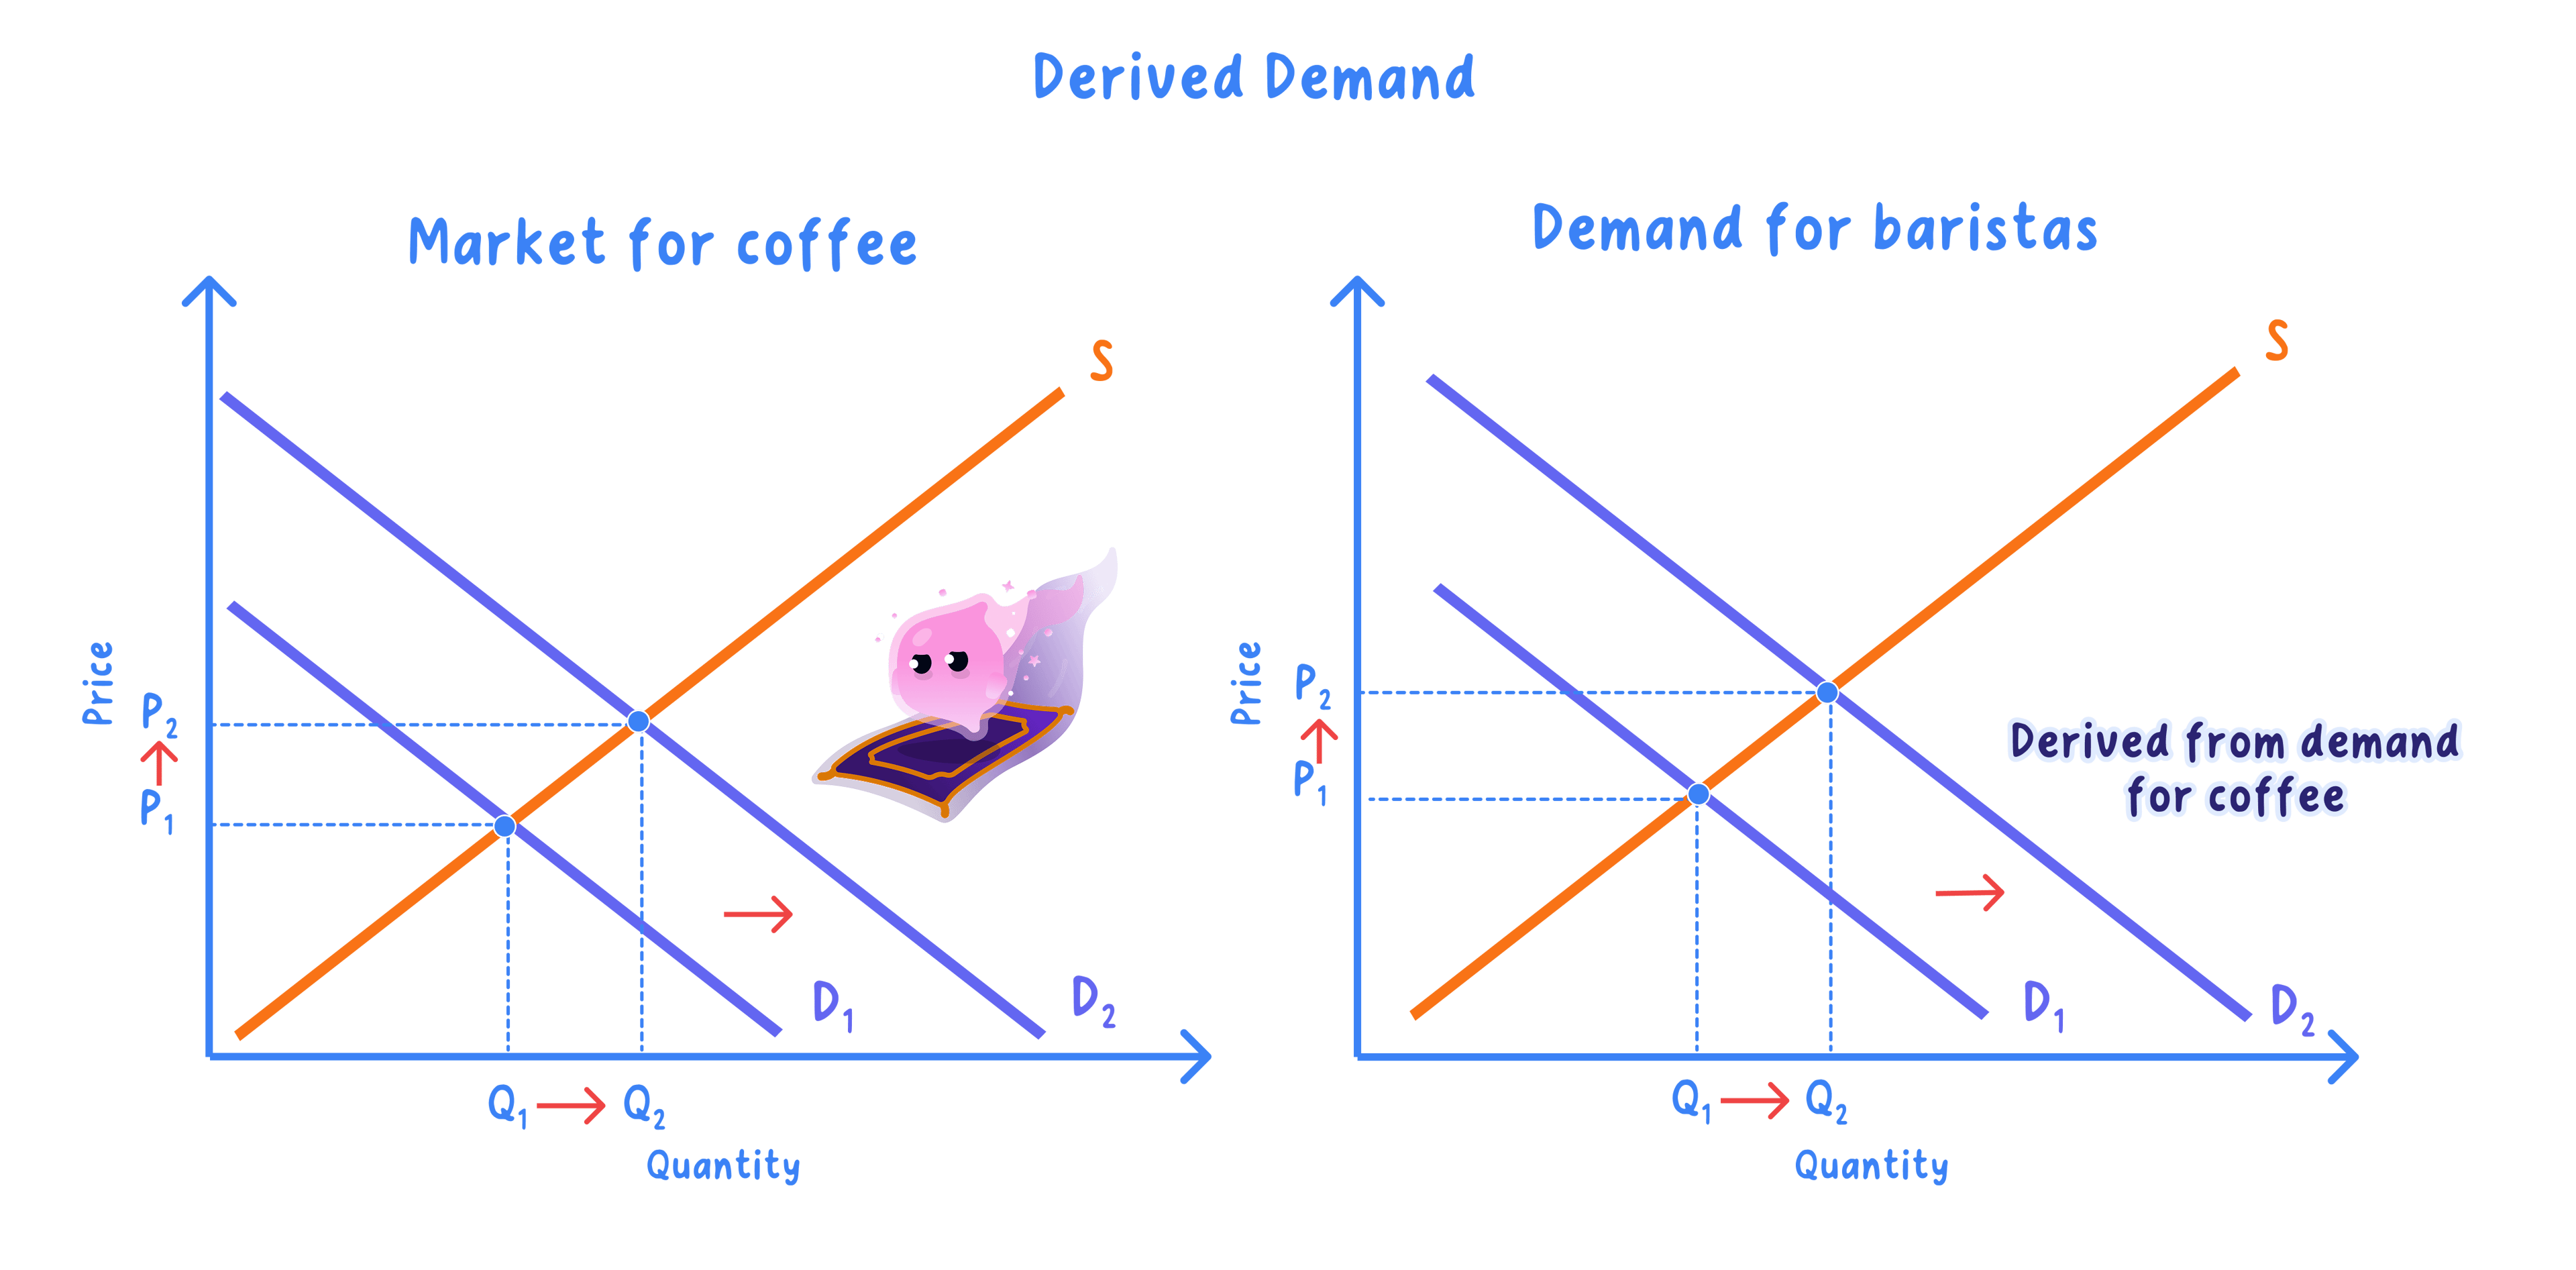
- The second market's supply curve does not move: nothing has changed about the cost of supplying that good.
- It is a shift of demand, not a movement along it: the second good's own price has not changed.
- Check the direction before you draw: a dearer good pulls demand towards its substitutes and away from its complements.
Joint supply shifts the partner's supply
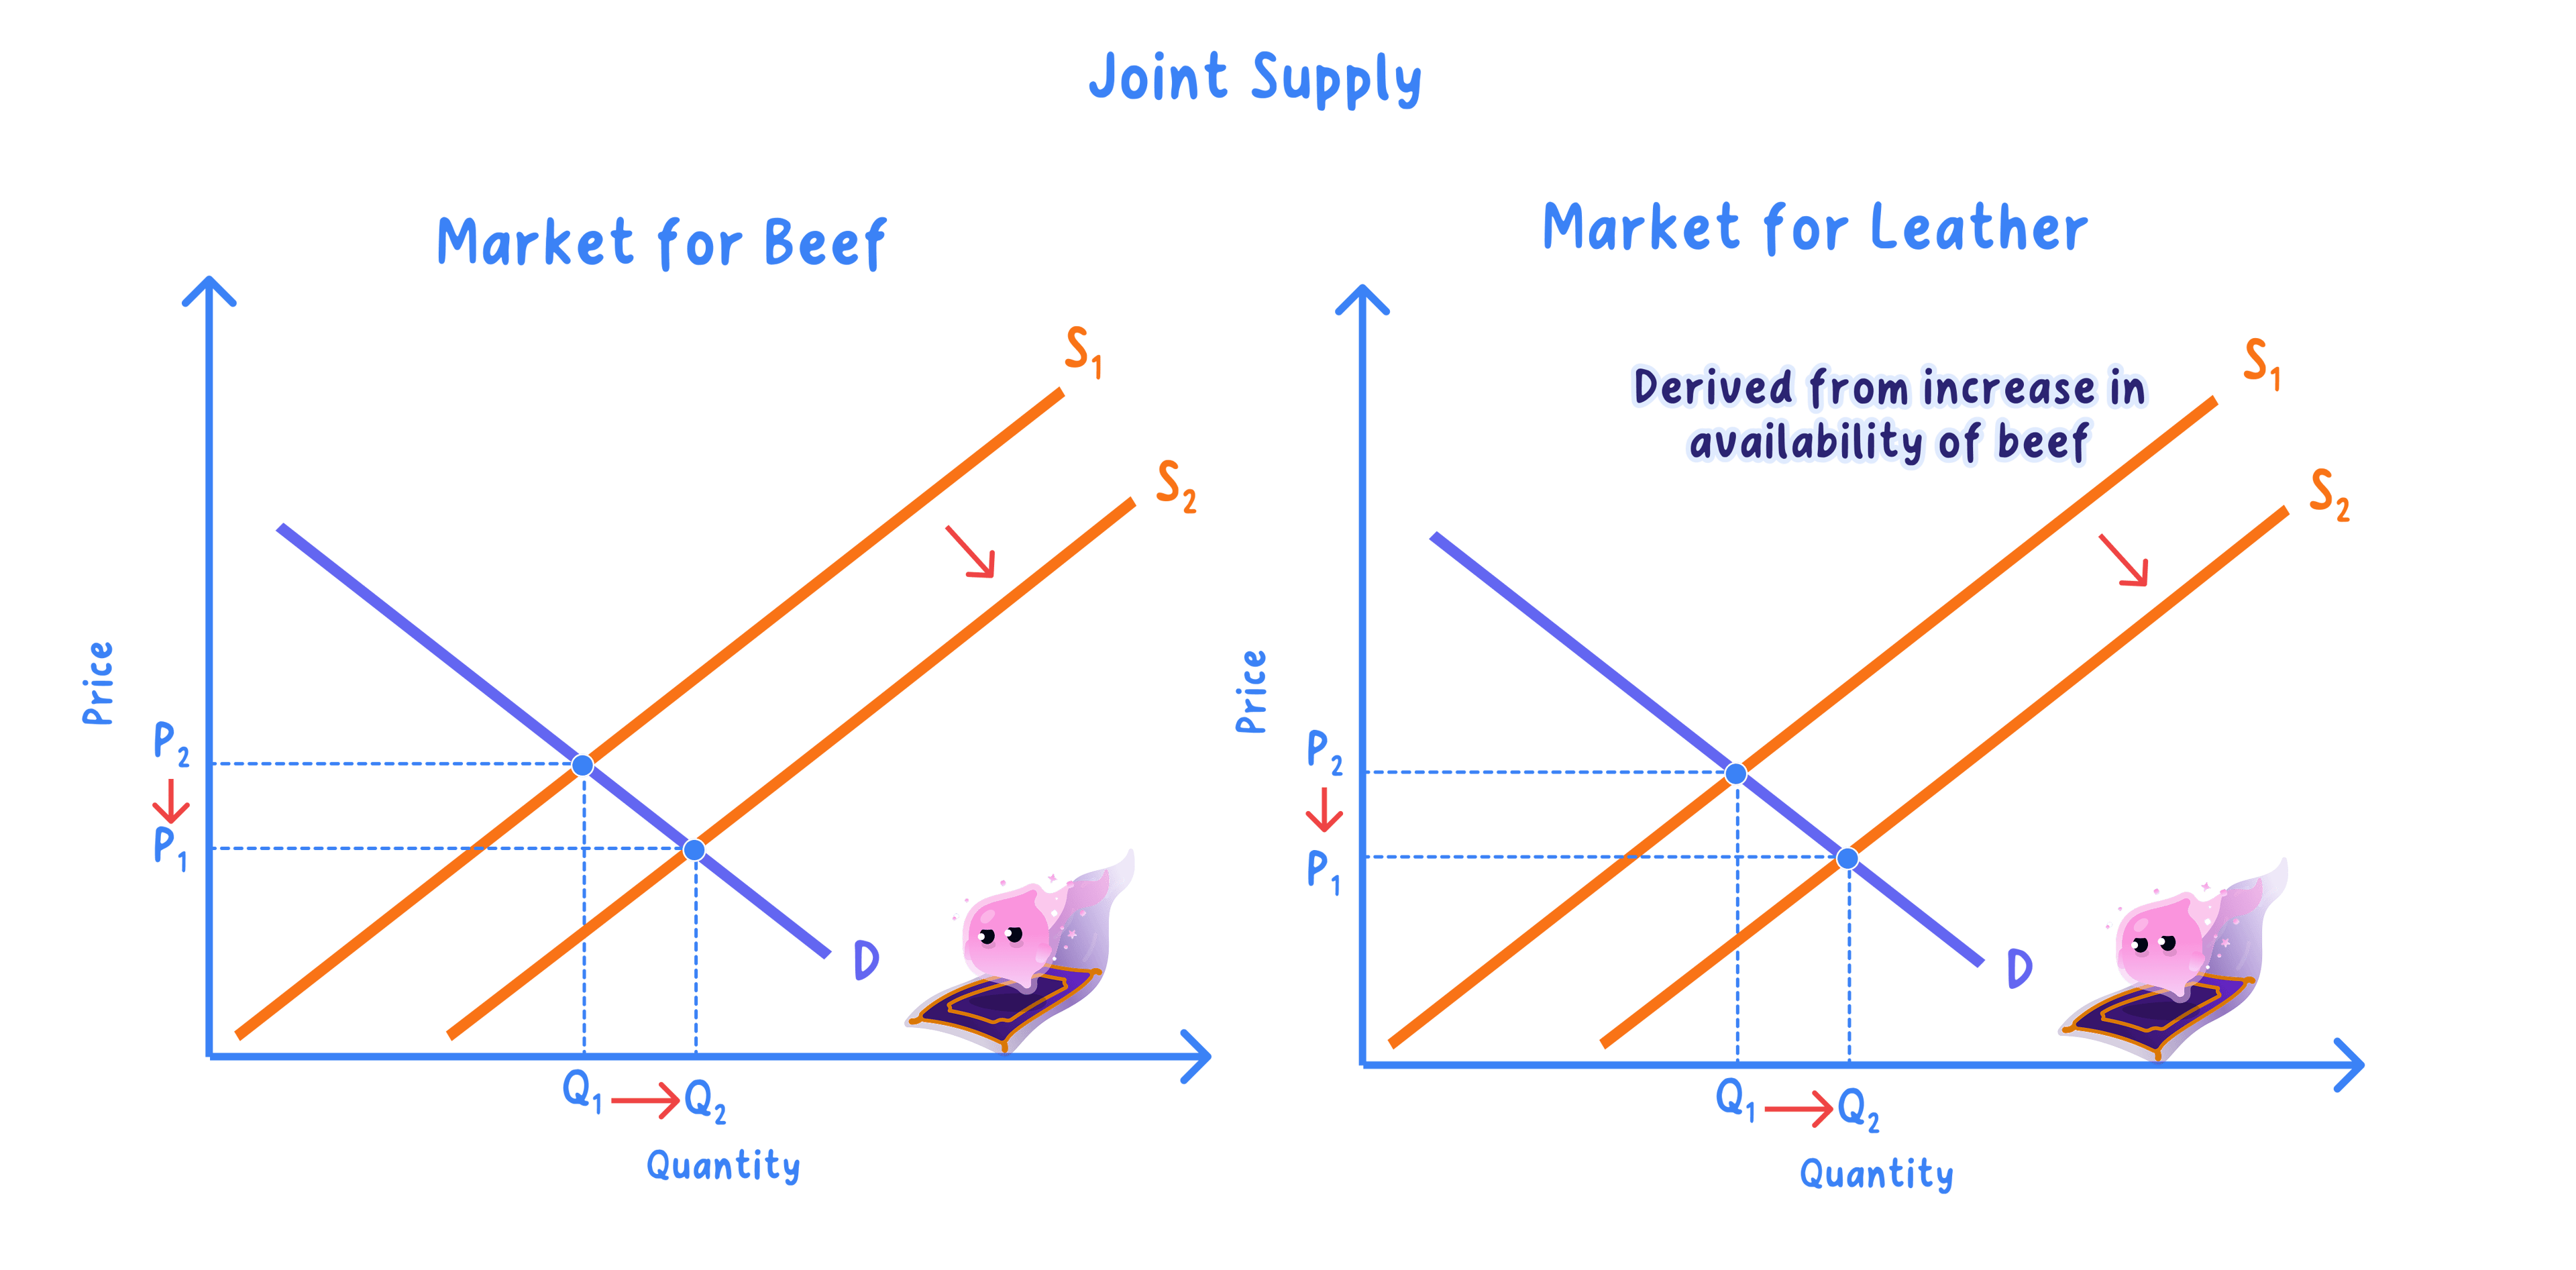
Joint supply: where producing one good automatically produces another, so a change in one of those markets moves the supply of the other.
- A rise in the price of one product brings more of its partner onto the market as an unavoidable by-product, so the partner's supply shifts right and its price falls.
- Beef and cowhide come from the same animal, so a higher beef price brings more hides to the tanneries and pushes the price of leather down.
- Refining crude oil yields petrol and bitumen together, so refining more for the forecourts also puts more bitumen on the market for resurfacing UK roads.
- Both of these links tie two markets together on the production side even when no buyer is choosing between the two goods at all.
- Name the link between the two markets first, because the direction of every later step depends on it.
- Set the chain out as numbered steps with one cause in each; the analysis marks are for the links.
- Finish in the second market with both the new price and the new quantity, not just the shift.
- If the price of coffee rises, what happens to the equilibrium price and quantity of tea?
- Which way does demand shift in the market for a complement when the first good's price rises?
- Why is the change in the second market a shift rather than a movement along the demand curve?
- What is derived demand?
- What happens to the price of leather when the price of beef rises?
1.3.5a Price elasticity of demand
The same price rise, two very different reactions
Price elasticity of demand (PED): a measure of how responsive the quantity demanded of a good is to a change in that good's own price.
- The law of demand gives only the direction of the reaction, that a higher price goes with a lower quantity demanded, never its size.
- Two goods can meet the same percentage price rise and lose completely different shares of their sales.
- Petrol at a UK forecourt keeps almost all of its sales, because most journeys still have to be made.
- One brand of biscuit on a Tesco shelf loses a large share, because the shopper picks up the packet next to it.
- What separates them is the size of the reaction set against the price change, and that is what price elasticity of demand puts a number on.
- Both halves of that comparison are percentage changes, so the answer is a plain number with no units, which lets a loaf of bread be compared with an airline seat.
- The price involved is always the good's own price, so a change in income or in another good's price is a separate idea.
- Petrol, a 10 per cent price rise: the pump price goes from £1.40 to £1.54 a litre and the litres sold across the UK fall by about 3 per cent, because a driver cannot stop commuting this week.
- One brand of biscuit, the same 10 per cent price rise: a packet goes from £1.50 to £1.65 and weekly sales of that brand fall by about 25 per cent, because a rival packet on the same shelf does the same job.
- Identical price changes, opposite outcomes, which is what it means to say that a change in price does not always cause an equivalent change in the quantity demanded.
Elastic and inelastic are one scale
- Price elastic demand is the biscuit case, where buyers walk away in large numbers over a small price change.
- Price inelastic demand is the petrol case, where buyers grumble and pay.
- The two words describe a reaction, not the size of a market, so petrol has inelastic demand even though it sells in billions of litres a year.
- Inelastic never means no reaction at all, only a reaction proportionally smaller than the price change behind it.
- Most real goods sit somewhere along the scale rather than at either end of it.
- A price rise lowers the quantity demanded, not demand.
- A price change moves buyers along the demand curve; only income, tastes and the like shift it.
The size of the reaction is what decisions need
- A firm setting a price needs to know how many sales a price rise would cost it, since knowing only that sales would fall settles nothing.
- The Treasury raising fuel duty needs the same number, because what the duty collects depends on how far motorists cut back.
- A reaction is measured between two particular prices, so the same good can react weakly around today's price and strongly if that price were doubled.
- It also matters how narrowly the good is described, because one brand of biscuit and biscuits as a whole are two different measurements.
- So elastic and inelastic belong to one market over one range of prices, never permanently to a good.
What pushes a good towards the elastic or the inelastic end of the scale is set out in 1.3.5b, and how the reaction is measured as a number is set out in 1.3.5c.
- What does price elasticity of demand measure?
- Which price does it respond to?
- Petrol rises in price by 10 per cent and the litres sold fall by 3 per cent: is the quantity reaction proportionally bigger or smaller than the price change?
- Why is demand for petrol called inelastic even though petrol sells in enormous quantities?
- Why is it wrong to say that a price rise reduces demand?
1.3.5b Factors affecting price elasticity of demand
Elastic and inelastic are judgements about proportions
Price elastic demand: demand where the quantity demanded changes by proportionally more than the price that caused the change.
Price inelastic demand: demand where the quantity demanded changes by proportionally less than the price that caused the change.
- The test is a comparison of two percentage changes, never a judgement about how many units moved.
- Twenty fewer loaves out of 500 is a tiny reaction, while twenty fewer new cars out of 40 is an enormous one.
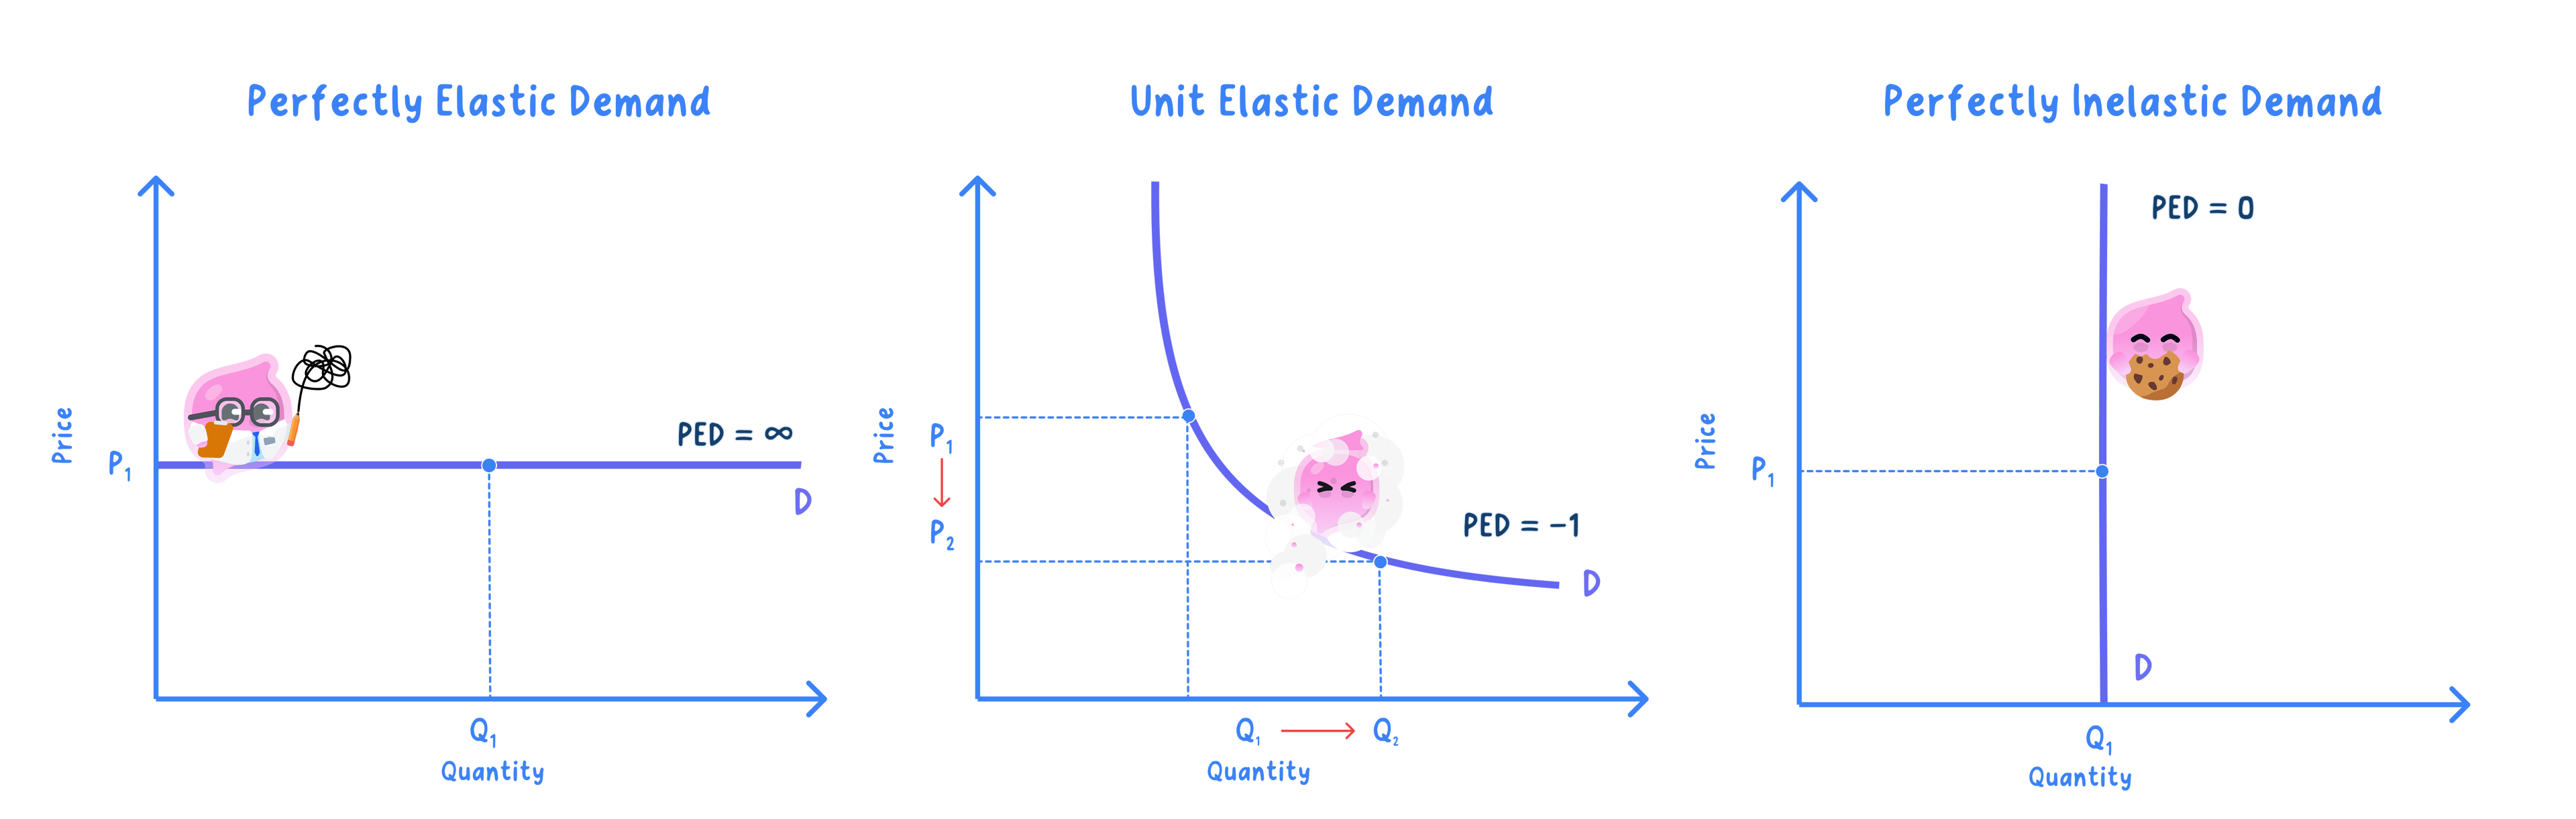
- On a demand diagram, with price on the vertical axis and quantity demanded on the horizontal axis, the difference shows up as steepness: a steep demand curve is inelastic and a flat one is elastic.
- The extreme cases are a vertical curve for perfectly inelastic demand and a horizontal one for perfectly elastic demand.
- Compare steepness only on the same axes and the same scale, since stretching an axis can make an identical curve look steeper than it is.
- The same good can be elastic over one stretch of its curve and inelastic over another, so neither label is ever permanent.
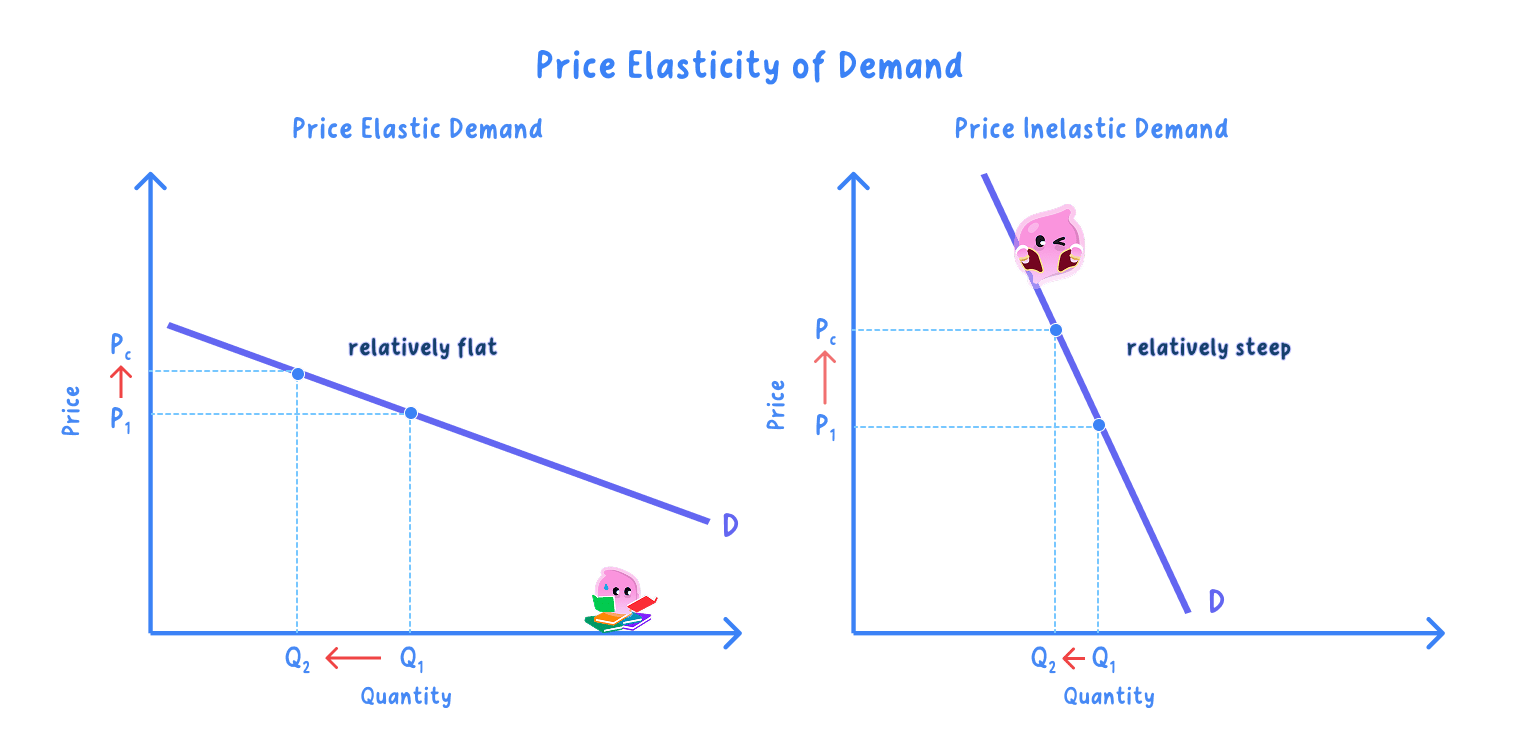
- Tesco own-label baked beans, price up 5 per cent: the tin goes from 40p to 42p and weekly sales of that label fall by about 20 per cent, four times the size of the price change, so demand for that label is price elastic.
- Baked beans across every brand, the same 5 per cent price rise: total tins sold in the UK fall by about 1 per cent, one fifth of the price change, so demand for beans as a whole is price inelastic.
- Nothing about the bean has changed between the two rows, only how widely the market was drawn.
Close substitutes settle most cases
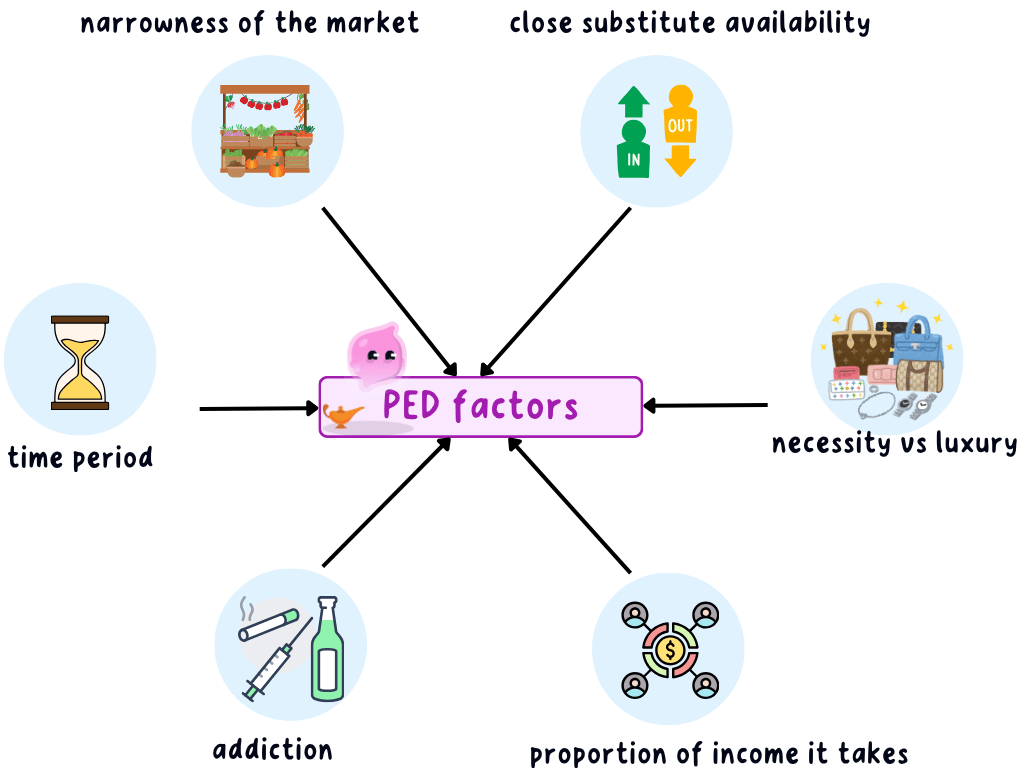
- The availability and closeness of substitutes settles more cases than any other factor, because a price rise sends the buyer to a rival instead of costing them the purchase.
- Demand for Walkers crisps is elastic, since a shopper who spots the higher price can drop a bag of Pringles or an own label into the trolley instead.
- Demand for crisps as a whole is far less elastic, since nothing else fills quite the same place in a lunchbox.
Necessity, luxury and the share of income
- Whether the good is a necessity or a luxury decides whether the purchase can be dropped at all.
- A necessity such as bread, salt or a prescription medicine has inelastic demand, because the buyer cannot go without it whatever the price does.
- A luxury such as a week in Spain or a meal out has elastic demand, because the whole purchase can simply be abandoned.
- Water supplied by Thames Water sits near the limit of this, since a household cannot stop drinking and washing when the bill rises.
- The proportion of income the good takes decides whether the price rise is even noticed.
- A good taking a large share of income, such as a new car or a summer holiday, has more elastic demand, because a price rise costs real money.
- A good taking a tiny share, such as a box of matches or a first-class stamp, has inelastic demand, because the extra pence are hardly felt.
- Judge the share of income rather than the price on the label, since a cheap item bought every day can still take a large share.
Habit, time and market width
- Habit and addiction remove the buyer's willingness to react at all.
- Cigarettes are the standard UK case, where rising duty pushes the price up year after year and the quantity sold falls only slightly.
- Brand loyalty is a milder version of the same thing, which is why firms advertise so heavily to build it.
- The time period decides how many escape routes the buyer has found, so demand becomes more elastic the longer the period allowed.
- A driver meeting a 10p rise in the pump price can do almost nothing this week, so demand looks inelastic.
- Over five years that driver buys a smaller or electric car, works from home more often, or moves closer to work, so demand looks far more elastic.
- How narrowly the market is defined can flip the answer for what is physically the same purchase.
- Demand for petrol from one Shell forecourt is elastic, because a BP station a mile away is a very close substitute.
- Demand for petrol across the UK is inelastic, because widening the definition makes the substitutes vanish.
- Spare capacity and stock levels decide the elasticity of supply, not of demand.
- Judge the share of the buyer's income, not the price on the label.
- Naming a factor earns nothing until you say which way it pushes.
Name the factor that dominates
- Cigarettes take a large share of a smoker's income, which on its own points to elastic demand, yet demand stays inelastic because addiction outweighs that.
- A Sainsbury's own-label loaf is a necessity, which points to inelastic demand, yet demand for that particular loaf is elastic because rival loaves sit on the same shelf.
- So weigh the factors and name the one doing the most work, rather than counting how many point each way.
- Insulin for a diabetic patient is strongly inelastic, with no substitute, no way of waiting and no real choice about buying.
- A cinema ticket is elastic, since streaming, television and a night in are all substitutes and the outing is easy to drop.
- Petrol splits the factors, coming out inelastic over a week and considerably more elastic over a decade.
- State the difference between price elastic and price inelastic demand.
- Name six factors that affect the price elasticity of demand for a good.
- A tin of own-label beans rises in price by 5 per cent and sales of that label fall by 20 per cent: is demand for it price elastic or price inelastic?
- Why is demand for petrol from one Shell forecourt more elastic than demand for petrol across the UK?
- Why does a longer time period make demand more elastic?
1.3.5c Measuring PED and its implications
Divide the buyers’ reaction by the price change
Percentage change=changeoriginal figure×100% \text{Percentage change}=\frac{\text{change}}{\text{original figure}}\times100\% Percentage change=original figurechange×100% PED=percentage change in quantity demandedpercentage change in price \text{PED}=\frac{\text{percentage change in quantity demanded}}{\text{percentage change in price}} PED=percentage change in pricepercentage change in quantity demanded- Calculate each percentage change from the original price or quantity, then divide the quantity-demanded change by the price change.
- PED is normally negative because price and quantity demanded move in opposite directions. Use its size when deciding whether demand is elastic or inelastic.
- Do not invert the fraction.
- Use the original figures as the denominators.
The same three steps work every time
- Find the percentage change in quantity demanded. 2. Find the percentage change in price. 3. Divide the first by the second.
- A loaf rises from £1.20 to £1.32 and weekly sales fall from 4,000 to 3,840.
- The size is 0.4, so demand is price inelastic over this range.
Read the coefficient against 1
- Ignore the negative sign and compare the size of PED with 1.
- 0 < PED < 1 means demand is inelastic: quantity demanded changes proportionally less than price.
- PED = 1 means demand is unit elastic: the two percentage changes are equal.
- PED > 1 means demand is elastic: quantity demanded changes proportionally more than price.
- PED = 0 is perfectly inelastic; a vertical demand curve.
- Perfectly elastic demand is shown by a horizontal demand curve.
Elasticity decides whether a price rise raises revenue
- Total revenue = price × quantity sold.
- If demand is inelastic, a price rise increases total revenue; if demand is elastic, it decreases total revenue. At unit elasticity, total revenue is unchanged.
- The opposite applies to a price cut.
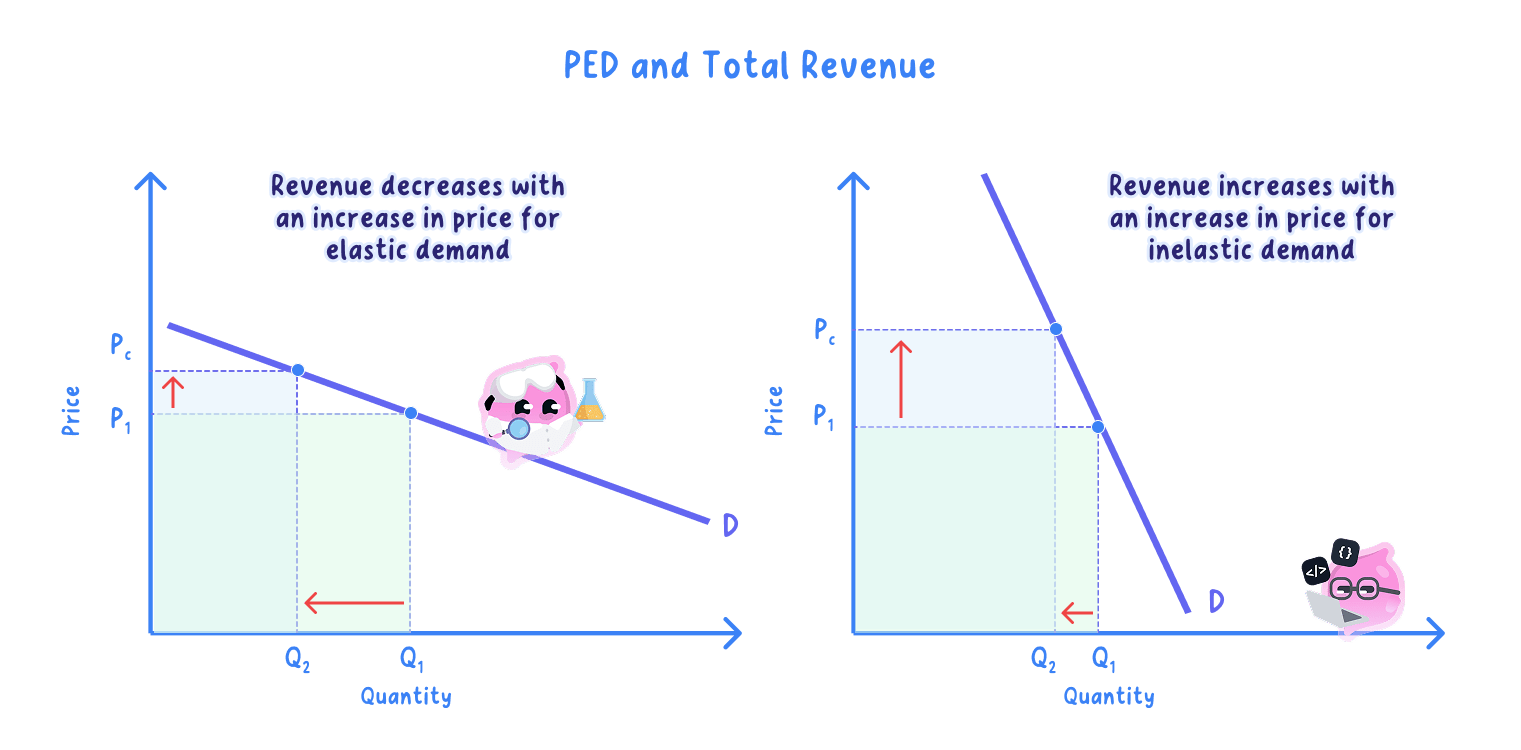
- A good sells 400 units at £2.00. With PED = 0.5, a 10% price rise cuts quantity demanded by 5% to 380.
- Revenue rises from £800 to £836 because demand is inelastic.
Implications for consumers, producers and government
- With inelastic demand, consumers have fewer close substitutes, so a price rise reduces quantity demanded by relatively little.
- A producer may raise revenue by raising price only when demand is inelastic over the relevant price range; costs and competitors still matter for profit.
Taxing inelastic demand raises revenue but hits poorer households
- Taxes on goods with relatively inelastic demand can raise substantial revenue because sales fall by relatively little.
- However, demand is rarely perfectly inelastic, and a tax may affect lower-income households more heavily.
- Show both percentage changes using the original figures, then state the size of PED and the correct elastic/inelastic verdict.
- If revenue is asked for, confirm the direction by calculating price × quantity.
- State the PED formula in words.
- If price rises by 10% and quantity demanded falls by 4%, calculate PED and classify demand.
- What happens to total revenue after a price rise when demand is elastic?
- Why might a government tax a good with inelastic demand?
1.3.6a Price elasticity of supply
The same price rise, two very different producers
Price elasticity of supply (PES): a measure of how responsive the quantity supplied of a good is to a change in that good's own price.
- The upward slope of the supply curve already settles the direction of the reaction, so the open question is how big that reaction is.
- Two British producers can meet the same 10 per cent price rise and end up in completely different positions.
- The Nissan plant in Sunderland can put an extra shift on within days, so more cars reach dealers inside the same month.
- A wheat farm in Lincolnshire cannot add a single tonne until next August, because the crop already in the ground is this year's whole output.
- What separates them is ability rather than willingness, since both producers would happily sell more at the higher price.
- A price signal is therefore only as powerful as the producer's ability to answer it.
- This is what it means to say that a change in price does not always cause an equivalent change in supply, where equivalent means matching in proportion, not in units.
- The car plant, a 10 per cent price rise: a Saturday shift can be arranged, components ordered within the week and finished cars released at once, so output rises quickly and by proportionally more than the price.
- The wheat farm, the same 10 per cent price rise: the acreage was drilled last autumn and grain cannot be made to ripen faster, so only what is left in the grain store can be sold and the reaction is tiny.
- Identical price signals, opposite outcomes, so the whole of the difference lies in what each producer is physically able to do.
Elastic and inelastic supply are one scale
- Supply is price elastic when quantity supplied reacts strongly, so the car plant is the elastic case.
- Supply is price inelastic when quantity supplied barely reacts, so the wheat farm is the inelastic case.
- Inelastic supply never means output is frozen, only a reaction proportionally smaller than the price change behind it.
- The Lincolnshire farmer can still release grain from the store, and a fishing boat can still stay out an extra day.
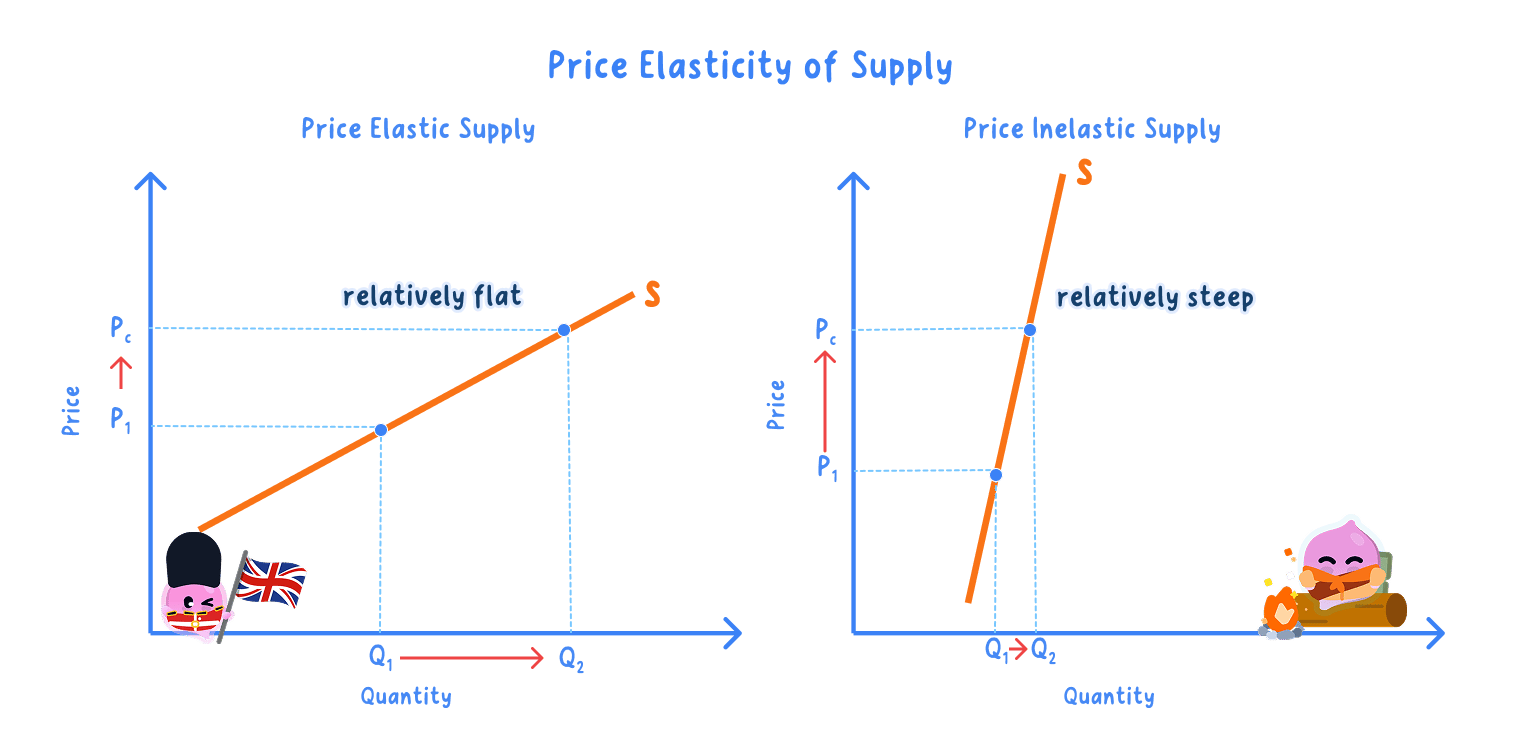
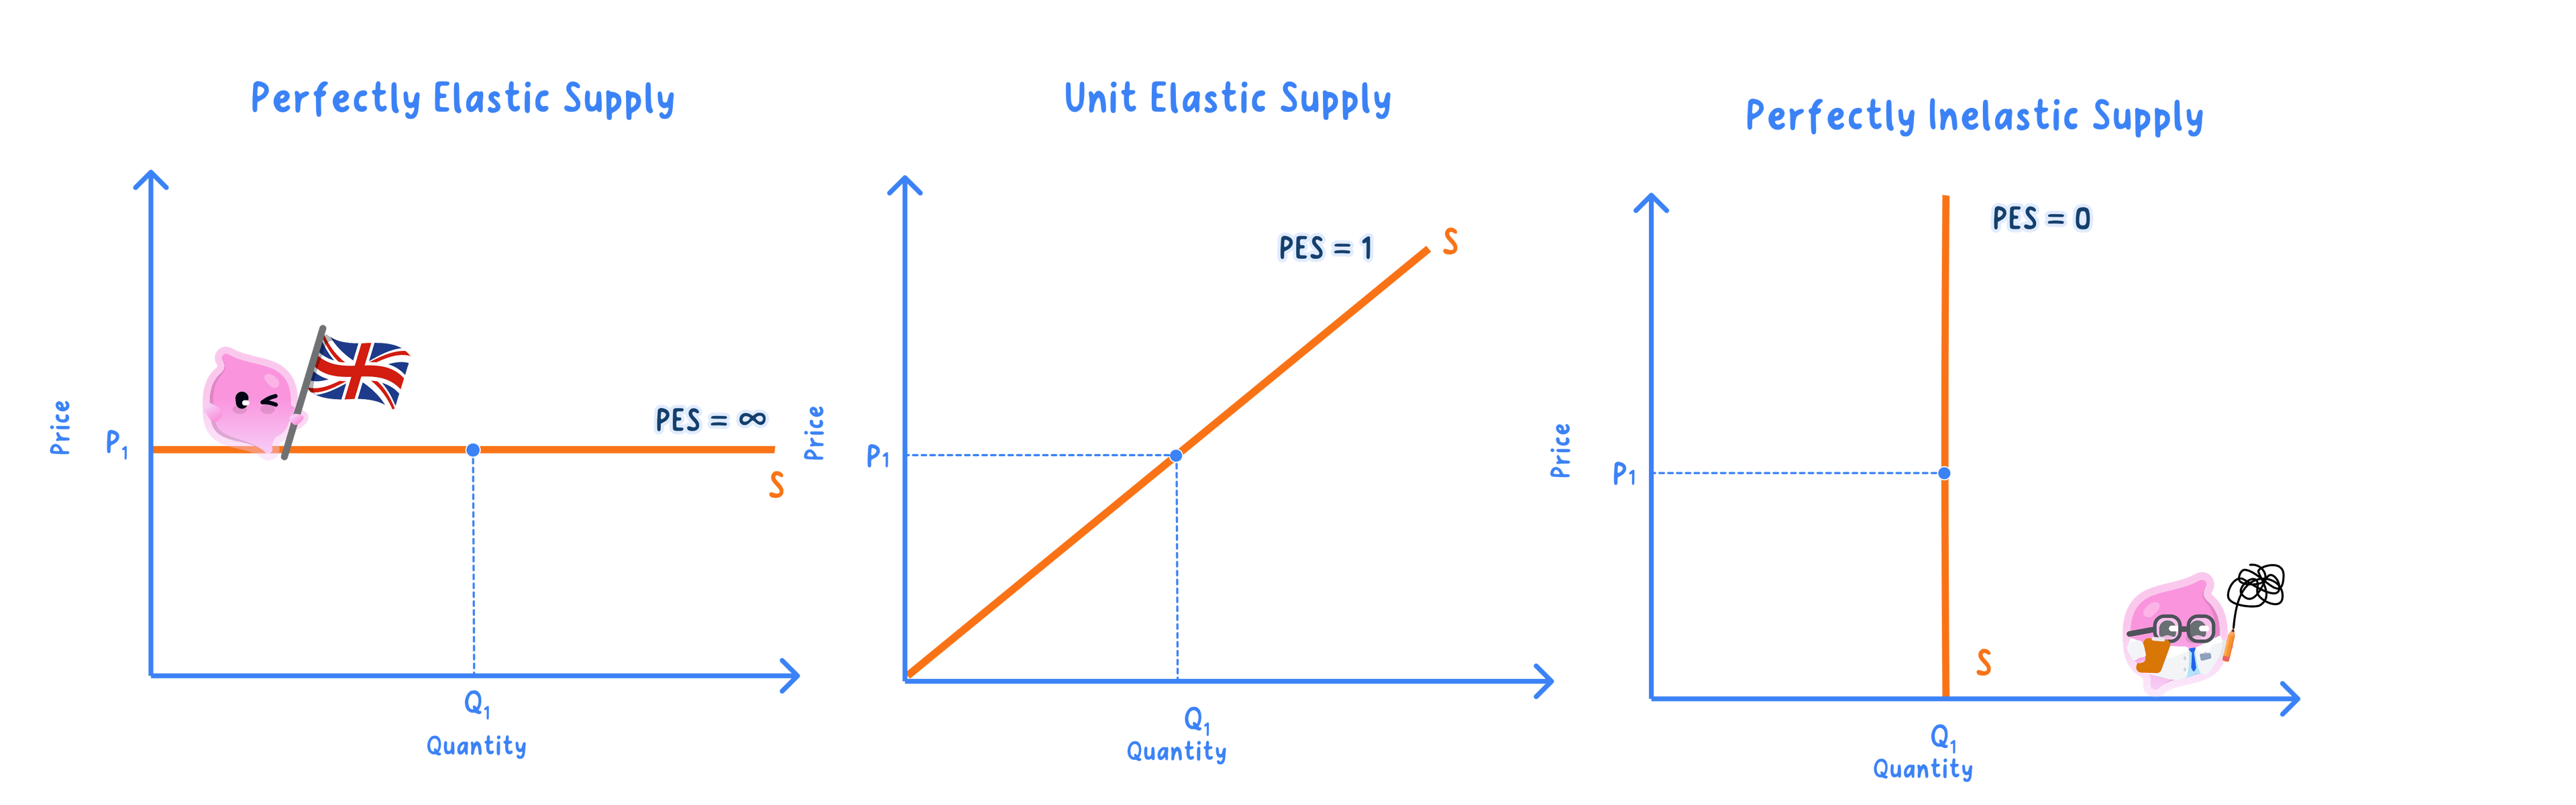
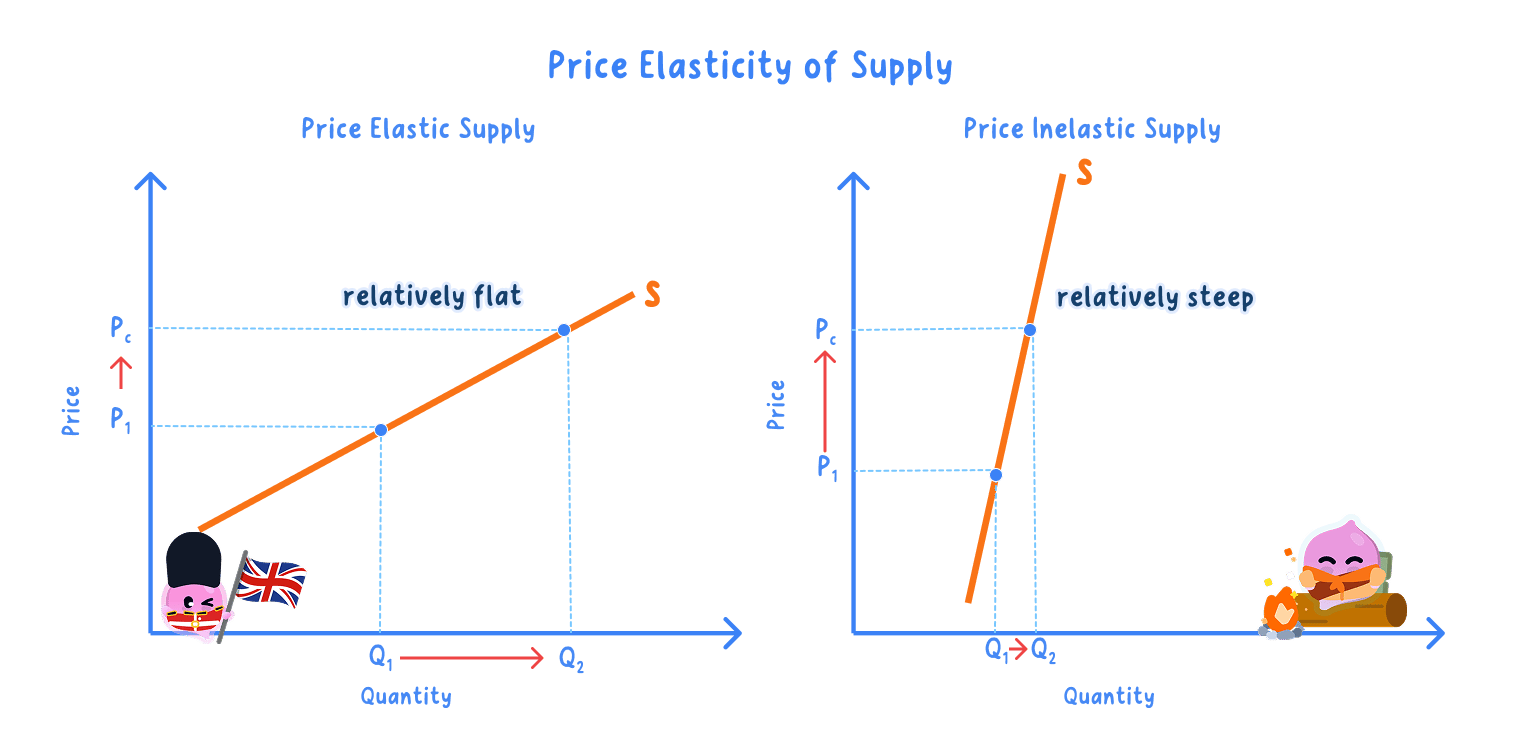
- On a supply diagram, with price on the vertical axis and quantity supplied on the horizontal axis, the difference shows up as steepness: a steep supply curve is inelastic and a flat one is elastic.
- The extreme cases are a vertical curve for perfectly inelastic supply and a horizontal one for perfectly elastic supply.
- Compare steepness only on the same axes and the same scale, since stretching an axis can make an identical curve look steeper than it is.
- This measures what producers do about a price change, not what buyers do.
- Write quantity supplied, not supply, since supply alone means the whole schedule.
- A wage, tax or weather change shifts the curve; this measures a movement along it.
The output response can lag by years
- The weakest reactions come where extra output needs something built, grown or discovered first.
- A new North Sea oil field has to be surveyed, licensed, drilled and connected to a pipeline before a single extra barrel is landed.
- Because the reaction is delayed, the high price that triggered it has often fallen back long before the extra output arrives.
- The 2021 and 2022 gas price spike: wholesale gas prices in the UK rose steeply and every producer in the North Sea wanted to sell more.
- Existing platforms were already running close to their limits, so the extra output available in the short term came to very little.
- A new field takes several years from licence to first production, far longer than the spike lasted, so a very large price change sat beside a very small output change.
- Set that beside a Bournville chocolate line or a printing works in Leeds, where an extra shift can lift output the week the order arrives.
A large industry is not automatically a responsive one
- Size and responsiveness are different things, so a very large industry can still have a very weak reaction.
- UK gas and oil production runs into millions of tonnes a year and is still barely able to move within twelve months.
- Neither label is a permanent property of a good, so the same producer can be inelastic this week and elastic in five years' time.
What decides where a producer sits on that scale is set out in 1.3.6b, and how the reaction is measured as a number is set out in 1.3.6c.
- What does price elasticity of supply measure, and which price does it respond to?
- Why can the same 10 per cent price rise bring a large output rise at a car plant and almost none on a wheat farm?
- A producer's weekly output rises from 500 units to 515 after a 10 per cent price rise: what is the percentage rise in quantity supplied, and is it proportionally bigger or smaller than the price change?
- Does price inelastic supply mean quantity supplied does not change at all?
- Does a steep supply curve show elastic or inelastic supply?
1.3.6b Factors affecting price elasticity of supply
Elastic and inelastic supply are judgements about proportions
Price elastic supply: supply where the quantity supplied changes by proportionally more than the price that caused the change.
Price inelastic supply: supply where the quantity supplied changes by proportionally less than the price that caused the change.
- The test is a comparison of two percentage changes, so the raw number of extra units settles nothing.
- A steelworks making 50,000 tonnes that adds 500 has barely moved, since that is a rise of 1 per cent.
- A guitar workshop making 600 instruments that also adds 500 has almost doubled its output.
- Both labels work downwards as well as upwards, because a price fall makes producers cut output and that reaction can also be strong or weak.
- Neither label belongs permanently to a good, so the same producer can be inelastic over a fortnight and elastic over five years.
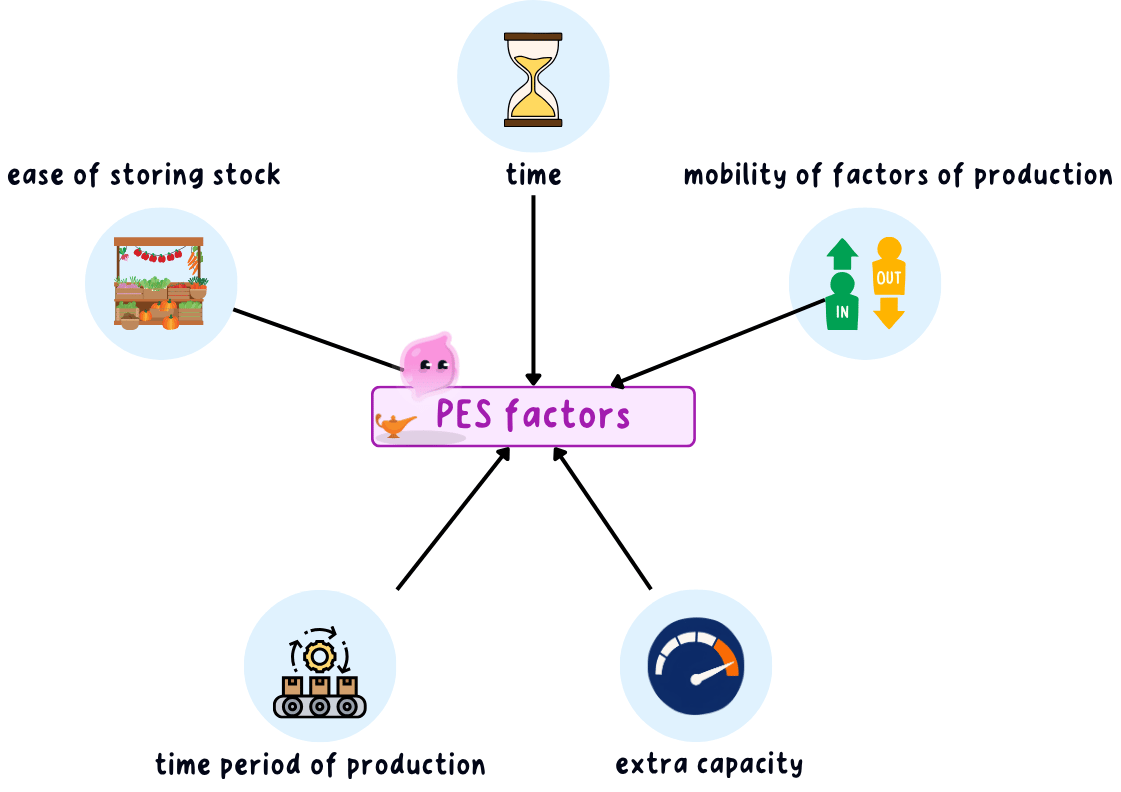
- Every factor below therefore has to be judged against the period the question gives you.
- Close substitutes, necessities and the share of income belong to demand, not supply.
- A large producer is not automatically elastic, since a firm running flat out is as stuck as a small one.
- Stock releases output that already exists; spare capacity makes output that does not.
Time matters more than every other factor
- Supply becomes more elastic the longer the period allowed, because every way of raising output takes time to arrange.
- Over a few days a producer can sell only what already exists, so the reaction is close to nothing.
- Over several months it can recruit staff, order more materials and run extra shifts, so the reaction grows.
- Over several years it can build another factory, sink another mine or plant another orchard, so the reaction is at its strongest.
- Each of those arrangements carries its own lead time.
- A Kent apple orchard is the clearest case, since new trees take several years to bear fruit and nothing a grower does in 2026 changes the 2026 crop.
- A single figure for a good is meaningless without the period attached to it.
- UK wheat in 2022: prices rose sharply after exports from the Black Sea were disrupted, and every arable farmer in the country wanted to sell more grain.
- The 2022 crop had been drilled in the autumn of 2021, so the acreage was already decided before the price was known.
- Inside that harvest year the only extra grain available was whatever was still sitting in farm stores, which made supply strongly price inelastic.
- Farmers answered by drilling more wheat that autumn, so the extra output arrived with the 2023 harvest, a full year after the signal.
- Stretch the period from one season to two and the same crop moves from very inelastic to noticeably more elastic.
Spare capacity decides whether more can be made
- Spare productive capacity means idle machines, unused floor space and workers who are not yet on full hours.
- The chain runs from the higher price to an extra shift, then to more machine hours, then to more units leaving the loading bay within weeks.
- A firm already running every machine flat out has no such chain available, so its supply is inelastic however large the firm is.
- A Jaguar Land Rover plant working one shift can add a second within weeks, while the same plant already running three shifts can add nothing until it builds more capacity.
- Spare capacity also runs out as output rises, which is why many supply curves grow steeper the further right you go along them.
- A clothing factory at half capacity: the price of its garments rises, so it moves from one shift to two, buys more cloth within days and nearly doubles weekly output, so its supply is price elastic.
- The same factory a year later: both shifts run, every machine is in use and the building is full, so the next price rise brings almost no extra output and its supply has turned price inelastic.
- Nothing about the garment changed between those two years, so the answer describes the producer's position rather than the product.
Stock is output already made and waiting
- Ease of storing stock decides whether extra output can reach the market on the day the price rises.
- The chain is short, running from the higher price straight to a warehouse door with no production needed at all.
- Tinned food, coal, bottled water and bricks all keep for months, so a producer can hold them back and release them when the price suits.
- A good that will not keep cannot be held back at all, so the whole of today's output has to be sold today whatever the price is.
- Fresh milk, cut flowers and fish landed at Peterhead are the standard cases, and their supply is inelastic for that reason alone.
- Stock is a one-off cushion rather than a permanent answer, so supply turns inelastic again as soon as the store room is empty.
Mobile factors let a firm switch output
- Mobility of the factors of production means how easily land, labour and capital can be switched from one use to another.
- Where the same premises, machines and workers can turn to a different product, a higher price brings a changeover and extra output within hours.
- A commercial printing works moves between leaflets, posters and packaging in an afternoon, so the supply of each is elastic.
- Highly specialised land, capital and skills have nowhere else to go, so nothing can be redirected into the product whose price has risen.
- A copper smelter can produce nothing but copper, and a workshop of six violin makers cannot recruit a seventh skilled maker in a hurry.
- A firm can raise its own responsiveness deliberately, so buying machinery that makes two products is a decision to make future supply more elastic.
A long production period fixes quantity in advance
- The longer a single unit takes to make or grow, the more inelastic supply is, because a higher price today cannot shorten the process.
- A moulded plastic bucket takes seconds, so output can follow the price almost immediately.
- UK wheat arrives once a year, Scottish whisky has to mature for at least three years, and a new North Sea field takes several years from licence to first oil.
- This is why farming, fishing, mining and oil extraction have inelastic supply while most manufacturing is far more elastic.
- Primary producers also depend on land and natural conditions that cannot be added to, which reinforces the same result.
Name the factor that binds first
- The factors pull against each other, so a producer is held back by whichever of them binds soonest.
- A Greggs bakery has spare oven capacity but cannot store bread, so its supply is elastic within a day and no more elastic over a month.
- No amount of spare capacity or factor mobility gets a crop out of the ground before it has grown.
- Naming the binding factor is what turns a list into an explanation, since the rest of the list is then beside the point.
- Bottled water from a plant on a single shift is elastic, because a second shift can start within a week and the bottles keep indefinitely.
- A crop of Lincolnshire onions a fortnight from harvest is inelastic, because the quantity is already in the ground.
- Parking spaces along a seafront are perfectly inelastic, because the number is fixed whatever the charge.
- Printed T-shirts from a firm that also prints mugs are elastic, since the same presses and staff move between the two jobs in hours.
- State the difference between price elastic and price inelastic supply.
- Why is supply more elastic over five years than over five days?
- A steelworks raises output from 50,000 tonnes to 50,500 while a guitar workshop raises output from 600 instruments to 1,100: what is each percentage rise, and which producer has the more elastic supply?
- Why is the supply of fresh milk more inelastic than the supply of tinned soup?
- Why does a firm running every machine flat out have inelastic supply even if it is very large?
1.3.6c Measuring PES and its implications
Divide the output reaction by the price change
Percentage change=changeoriginal figure×100% \text{Percentage change}=\frac{\text{change}}{\text{original figure}}\times100\% Percentage change=original figurechange×100% PES=percentage change in quantity suppliedpercentage change in price \text{PES}=\frac{\text{percentage change in quantity supplied}}{\text{percentage change in price}} PES=percentage change in pricepercentage change in quantity supplied- Calculate each percentage change from the original price or quantity, then divide the quantity-supplied change by the price change.
- PES is normally positive because price and quantity supplied move in the same direction.
- Do not invert the fraction.
- Use the original figures as the denominators.
The same three steps work every time
-
- Find the percentage change in quantity supplied. 2. Find the percentage change in price. 3. Divide the first by the second.
- The price of a chair rises from £40 to £42 and weekly output rises from 500 to 600 chairs.
- PES of 4 means supply is price elastic over this range.
Read the coefficient against 1
- Compare PES with 1.
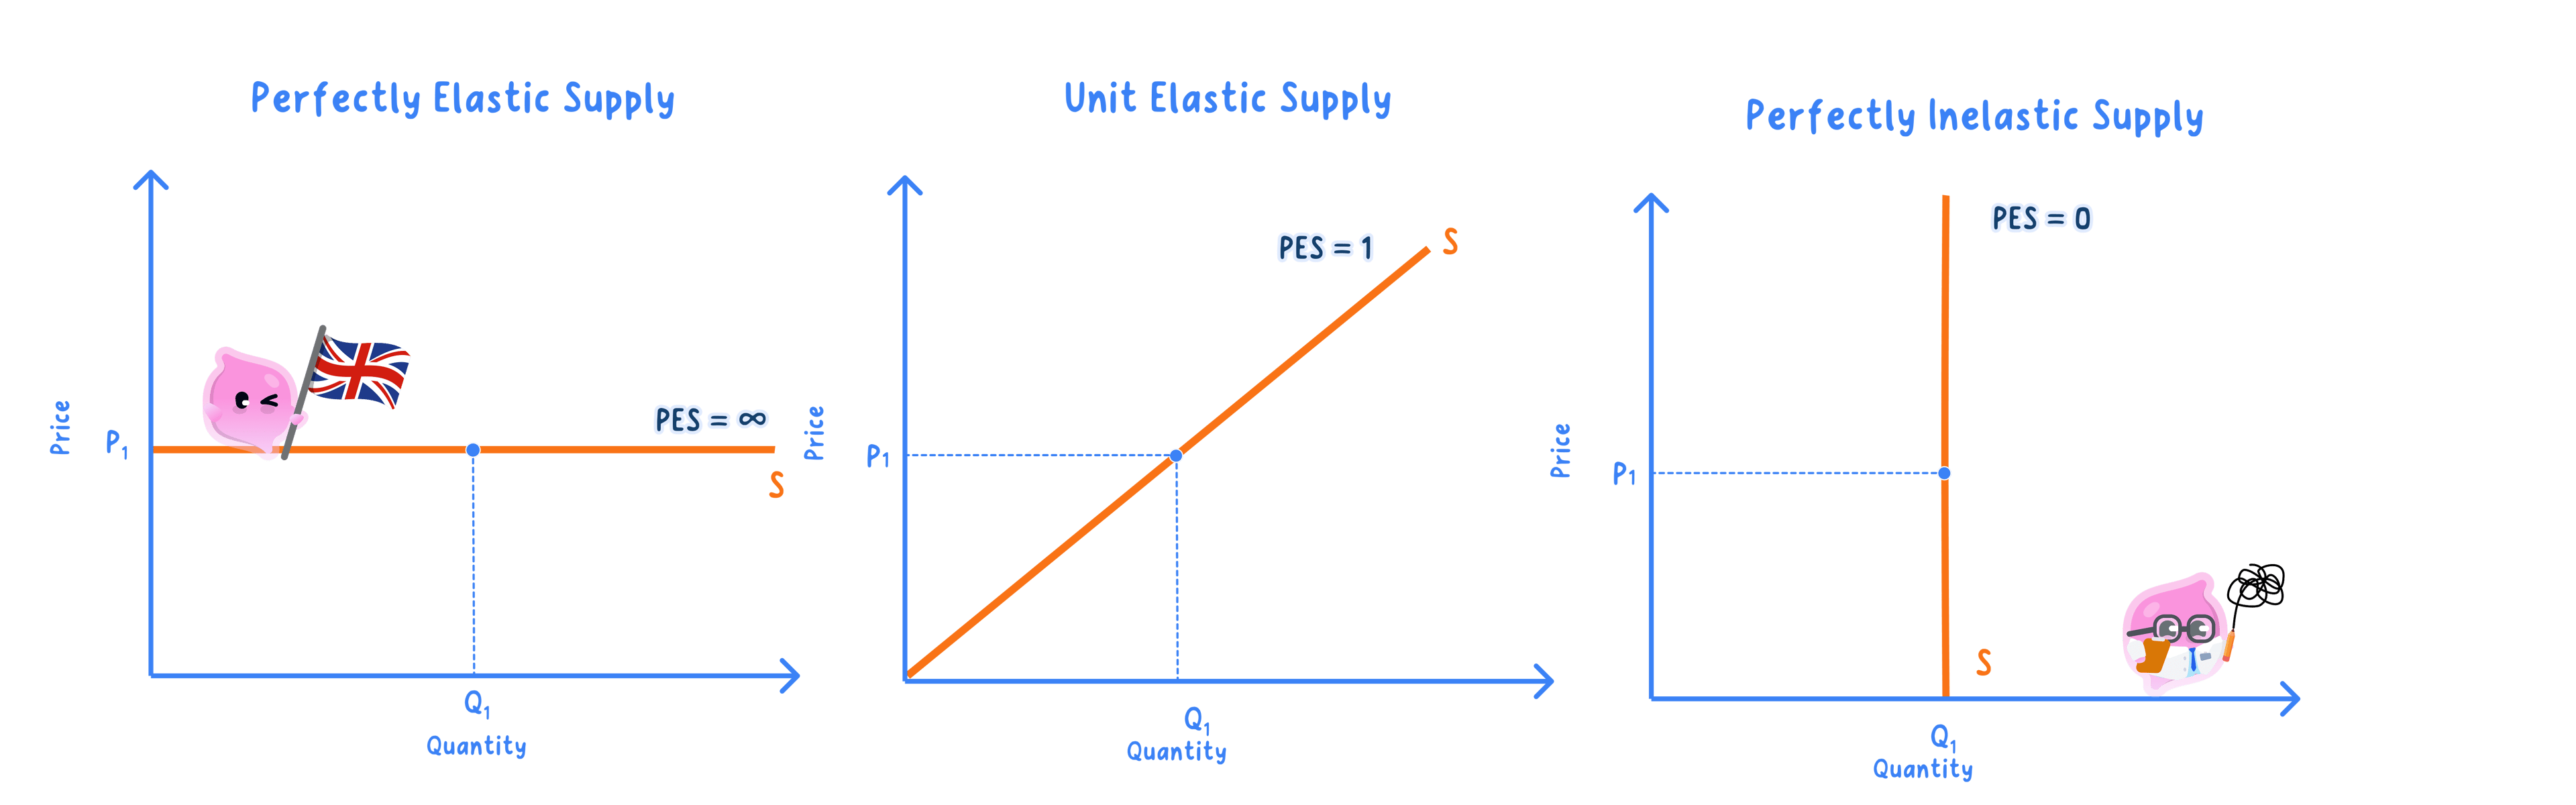
- 0 < PES < 1 means supply is inelastic: quantity supplied changes proportionally less than price.
- PES = 1 means supply is unit elastic: the two percentage changes are equal.
- PES > 1 means supply is elastic: quantity supplied changes proportionally more than price.
- PES = 0 is perfectly inelastic; a vertical supply curve.
- Perfectly elastic supply is shown by a horizontal supply curve.
- A steep supply curve is usually less elastic than a flatter one, but use the calculation when values are given.
Implications for producers and consumers
- After a rise in demand, inelastic supply tends to produce a larger rise in price and a smaller rise in quantity than elastic supply.
- A producer with inelastic supply can increase output only a little when price rises; spare capacity, stocks and time make supply more elastic.
- If price rises by 10%, PES of 0.3 gives a 3% rise in quantity supplied; PES of 4 gives a 40% rise.
- This predicts the supply response only. The exact new market price also depends on demand.
Supply becomes more elastic over a longer time period
- Supply is often more inelastic in the short run because firms cannot quickly add workers, machinery or capacity.
- Over a longer period, firms may be able to expand capacity, so supply can become more elastic.
- Housing illustrates short-run inelastic supply: building more homes takes time, so a demand increase can put stronger upward pressure on price.
- It does not allow an exact new house price to be calculated from PES alone; the demand curve also matters.
Every coefficient belongs to one range and period
- PES can change across different price ranges.
- PES also changes over time as firms gain capacity, stocks or workers.
- It depends on how the market is defined: one firm’s supply may be less elastic than the supply of the whole industry.
- Quote the period and price range when interpreting a PES figure.
- Show both percentage changes using the original figures, then state the PES and the correct elastic/inelastic verdict.
- Use PES × percentage price change to find the percentage change in quantity supplied.
- State the PES formula in words.
- If price rises by 20% and quantity supplied rises by 4%, calculate PES and classify supply.
- Why is supply often more elastic in the long run?
- Why cannot PES alone calculate the exact new equilibrium price?
