1.3 How prices are determined
123456789101112131415161718192021222324252627282930313233343536373839404142434445464748495051525354555657585960616263646566676869707172737475767778798081828384858687888990919293949596979899100101102103104105106107108109110111112113114115116117118119120121122123124125126127128129130131132133134135136137138139140141142143144145146147148149150151152153154155156157158159160161162163164165166167168169170171172
Question 168
Table 1 shows the quantity of reusable water bottles an individual consumer is willing and able to buy each month at different prices.
| Price per bottle | Quantity demanded per month |
|---|---|
| £18 | 2 |
| £14 | 4 |
| £10 | 6 |
| £6 | 8 |
Figure 1 is a blank grid for the student's answer.
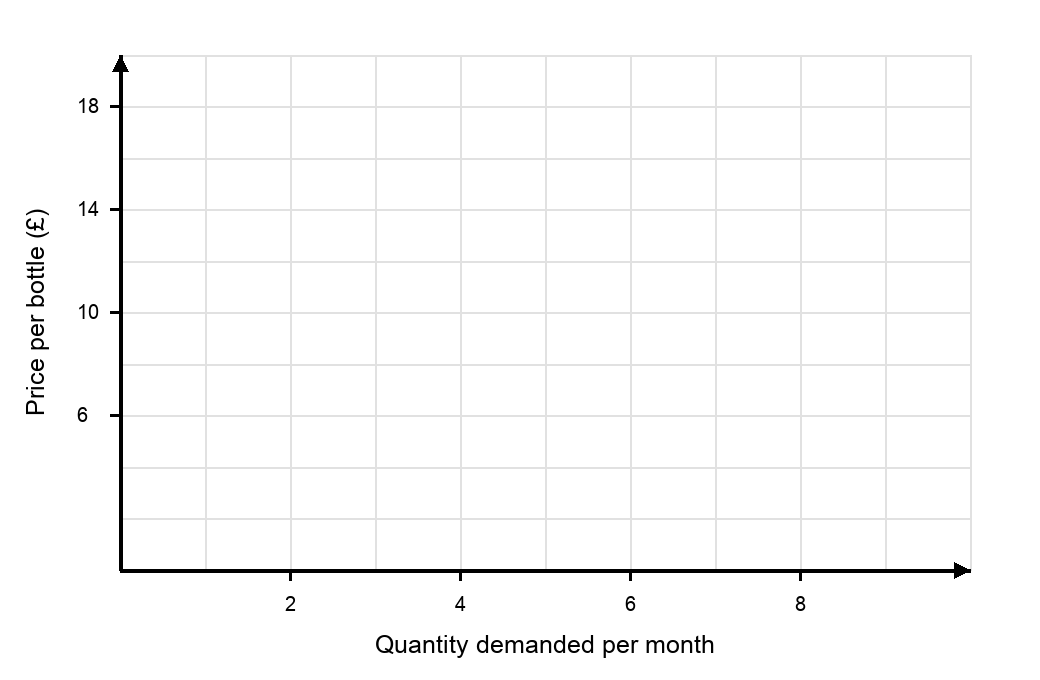 On Figure 1, draw and label the consumer's demand curve using the data in Table 1.
1.3 How prices are determined Questions
236 exam-style questions on AQA GCSE Economics 1.3 How prices are determined, covering 1.3.1a Demand and the factors that influence it, 1.3.1b The demand curve, 1.3.2a Supply and the factors that influence it, 1.3.2b The supply curve, 1.3.3a Determining equilibrium price, 1.3.3b Applying diagrams and showing revenue, 1.3.4a Complements and substitutes, 1.3.4b Effects of changes on related markets, 1.3.5a Price elasticity of demand, 1.3.5b Factors affecting price elasticity of demand, 1.3.5c Measuring PED and its implications, 1.3.6a Price elasticity of supply, 1.3.6b Factors affecting price elasticity of supply, and 1.3.6c Measuring PES and its implications. Each one has a worked solution and a mark scheme showing where the marks go.