Question 4
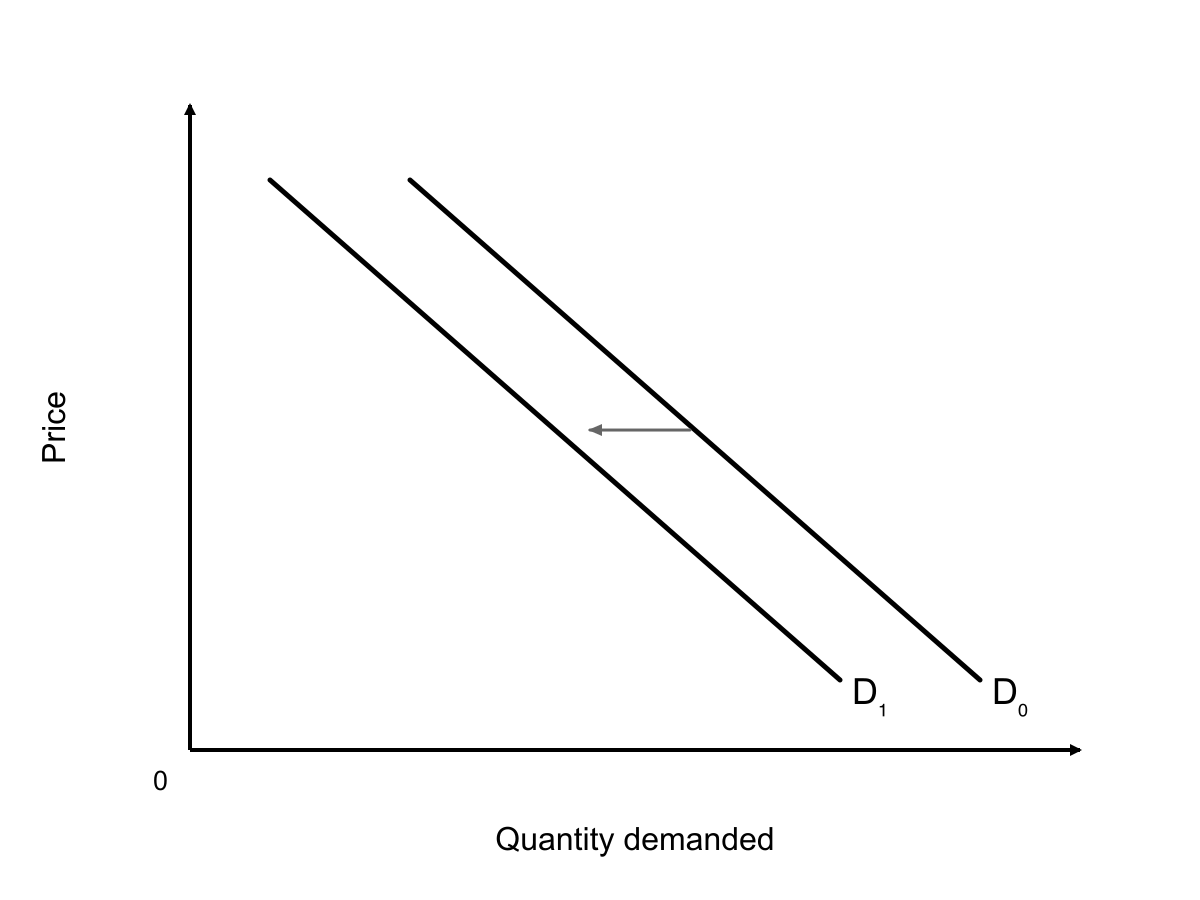 The diagram shows the demand curve changing from D₀ to D₁. What does this change represent?
A decrease in demand, so less is demanded at every price
A movement down along the demand curve caused by a fall in price
An extension in quantity supplied caused by a rise in price
An increase in demand, so more is demanded at every price
1.3 How prices are determined Questions
236 exam-style questions on AQA GCSE Economics 1.3 How prices are determined, covering 1.3.1a Demand and the factors that influence it, 1.3.1b The demand curve, 1.3.2a Supply and the factors that influence it, 1.3.2b The supply curve, 1.3.3a Determining equilibrium price, 1.3.3b Applying diagrams and showing revenue, 1.3.4a Complements and substitutes, 1.3.4b Effects of changes on related markets, 1.3.5a Price elasticity of demand, 1.3.5b Factors affecting price elasticity of demand, 1.3.5c Measuring PED and its implications, 1.3.6a Price elasticity of supply, 1.3.6b Factors affecting price elasticity of supply, and 1.3.6c Measuring PES and its implications. Each one has a worked solution and a mark scheme showing where the marks go.