2.2.1a The main economic objectives
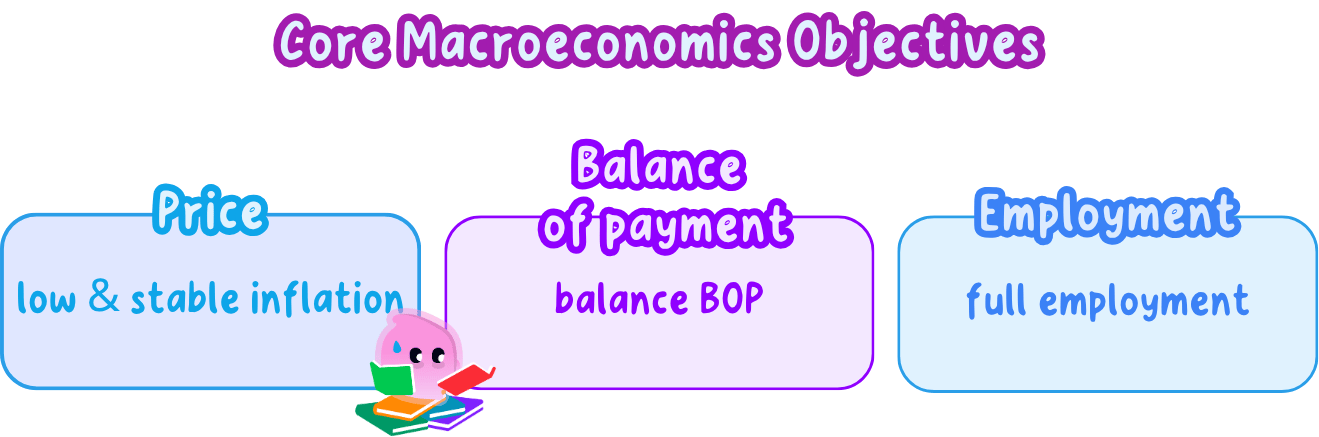
Economic growth is a core macroeconomic objective
- Economic growth means an increase in the real output of goods and services a country produces over time, and governments treat steady growth as one of their main macroeconomic objectives, aiming for national output to keep rising year after year rather than standing still.
- Growth is about producing more, not just spending more.
- A growing economy makes a larger amount of goods and services each year.
Growth raises incomes, employment and living standards
- When firms produce more, they usually need more workers, so employment tends to rise, and higher output means people earn higher incomes and can afford more goods and services.
- Rising output over many years is linked to better living standards for the population as a whole.
- If UK car factories increase production, they may take on extra staff and pay more wages.
- Those workers then spend in local shops, so the benefits of growth spread through the economy.
Governments aim for growth that is steady and sustainable
- Steady growth: output rises at a fairly even pace instead of in sudden booms and slumps.
- Sustainable growth: growth that can be kept going in the future without using up resources or badly harming the environment.
- Governments prefer steady, sustainable growth because it is easier for households and firms to plan around, and because very fast, unsteady growth is harder to maintain and can create problems later.
- When output and incomes rise, the government usually collects more tax revenue, which can help fund public services such as the NHS, schools and roads.
Price stability and full employment are also core objectives
Price stability: the government's aim of keeping inflation low and stable, so the price level rises slowly and predictably rather than quickly or unevenly.
Full employment: the government's aim of using the labour force as fully as possible, so that as few willing workers as possible are without jobs.
- Price stability does not mean prices never change. It means prices rise gently and steadily, so people are not surprised by sudden jumps.
- Full employment and low unemployment describe the same healthy labour market. The objective is about putting willing workers into productive jobs, not necessarily reaching zero unemployment.
Stable prices support confidence, saving and planning
- When inflation is low and stable, households and firms can plan ahead with confidence about future prices and costs, and firms feel more able to invest and hire.
- Stable prices also protect the value of savings, because money keeps most of its purchasing power over time.
- A family saving £200 a month for a deposit can plan sensibly when prices are stable.
- If prices rose quickly and unpredictably, their savings would buy far less than they expected.
The UK targets two per cent inflation
- In the UK the Bank of England is set a target of keeping CPI inflation at around 2 per cent a year, giving households, firms and the government a clear, predictable benchmark to plan around.
- UK CPI inflation stood at 2.9 per cent in July 2026, above the 2 per cent target, showing that hitting the target is not automatic.
Low inflation does not mean prices are falling. The aim is a small positive rate such as 2 per cent, not zero and not falling prices, so do not confuse low inflation with no price rises.
Unemployment means output the economy never gets back
- When people who want to work cannot find a job, their labour is wasted and the goods and services they could have made are lost for good, so the whole economy is poorer.
- Using the labour force fully helps the economy produce as much as it can, and long spells without work can also harm people's health, confidence and skills.
- If a skilled builder is out of work for a year, the homes they could have built are simply never made.
- That output is gone for good, which is why idle labour is so costly.
High employment raises incomes and eases pressure on government
- People in work earn incomes, which supports their living standards and spending, and when more people work the government pays out less in unemployment benefits while collecting more tax.
- In April to June 2026 the UK unemployment rate stood at 4.9 per cent, with an employment rate of 75.1 per cent, illustrating that even a healthy labour market keeps some frictional unemployment as people move between jobs.
A stable balance of payments is a core objective
- Governments aim for a stable balance of payments on the current account, avoiding a deficit that is so large or long-lasting that the country cannot keep financing it. The balance of payments records money flowing into and out of the country from trade and other transactions with the rest of the world, and is covered in full in 2.2.5.
- A current account deficit means a country pays out more to the rest of the world than it receives from it.
- A deficit is not automatically a crisis, but a very large or persistent one is harder to sustain.
The UK runs a goods deficit and services surplus
- In the first quarter of 2026 the UK ran a current account deficit of £15.1 billion, equal to 1.9 per cent of GDP, made up of a trade in goods deficit of £59.5 billion but a trade in services surplus of £51.8 billion.
- This goods deficit, services surplus pattern is the standard shape of UK trade: the country imports more goods than it exports, while exporting more services, such as financial and business services, than it imports.
A persistent deficit forces a country to borrow abroad
- To finance a current account deficit, a country must borrow from or sell assets to the rest of the world, which is why the UK's net international investment position stood at a liability of £122.1 billion at the end of March 2026.
- For this reason a stable balance of payments matters alongside growth, price stability and full employment as one of the government's principal objectives.
- What does economic growth mean, and why do governments prefer it to be steady and sustainable?
- What is the UK's inflation target, and which institution is responsible for hitting it?
- Why is the objective described as full employment rather than zero unemployment?
- What does a current account deficit mean?
- Name the four principal economic objectives of UK government policy.
2.2.1b Conflicts between government objectives
A conflict is when achieving one objective harms another
Conflict: when making progress on one government objective makes another objective worse.
Trade-off: giving up some of one aim in order to gain more of another.
- Because the principal objectives, growth, price stability, full employment and a stable balance of payments, do not always move together, governments cannot pursue every aim as strongly as they would like at the same time.
Faster growth can push demand ahead of supply
- When an economy grows quickly, households and firms spend more, and if that demand rises faster than firms can supply, prices tend to be pushed up, so a push for faster growth can conflict with the aim of low, stable inflation.
- Between August 2024 and December 2025 the Bank of England cut Bank Rate six times, from 5.25 per cent to 3.75 per cent, partly to support growth.
- By July 2026 CPI inflation had ticked back up to 2.9 per cent, above the 2 per cent target, so the Bank held Bank Rate at 3.75 per cent rather than cutting further.
A tight labour market can add to inflation
- As more people find work, they earn and spend more, adding to demand across the economy, and firms may also have to offer higher wages to attract scarce workers, adding to their costs.
- Both effects can push prices up, so pursuing very low unemployment can conflict with the aim of low inflation.
- In April to June 2026 the UK unemployment rate was 4.9 per cent, a fairly tight labour market by recent standards.
- With the National Living Wage also rising to £12.71 an hour from April 2026, firms facing higher wage costs may pass some of that on in higher prices.
Whether growth and jobs conflict with price stability
- It depends on how much spare capacity the economy has, because if firms have unused capacity, such as idle machinery or workers who could do more hours, they can meet extra demand by producing more rather than raising prices, so growth need not fuel inflation.
- It depends on how tight the labour market already is, because if unemployment is already low, as in 2026 at 4.9 per cent, pushing it lower forces firms to compete harder for scarce workers, raising wages and costs, whereas an economy with more slack can create jobs without much wage pressure.
- It depends on how the Bank of England responds, because holding or raising Bank Rate can cool demand and contain the inflationary side effect of growth, though usually at some cost to growth and jobs in the short run.
Judgement: growth and job creation are most likely to conflict with price stability when the economy is already close to full capacity and the labour market is already tight, which was closer to the UK's position in 2026, with unemployment at 4.9 per cent and inflation above target, than to an economy with plenty of spare room to grow.
Faster growth can cost the environment and trade
- Faster growth often means making and using more, which can create more pollution and use up more resources, harming the environment.
- As incomes rise with growth, people also tend to buy more imports, which can worsen the current account.
- In the first quarter of 2026 the UK ran a goods deficit of £59.5 billion, far bigger than its £51.8 billion services surplus, leaving an overall current account deficit of £15.1 billion.
- Faster consumer spending growth tends to pull in even more imported goods, which can widen a deficit like this further.
How growth conflicts with the environment and trade
- It depends on how the extra output is produced, because growth built on renewable energy and efficient technology creates far less pollution than growth built on burning more fossil fuels, so the environmental cost of a given amount of growth can vary widely.
- It depends on what households spend their extra income on, because if rising incomes are spent mainly on UK-made goods and services the current account is barely affected, but if they are spent on imported goods, as the UK's large goods deficit suggests is common, the current account deficit widens.
- It depends on the time frame considered, because a short burst of import-heavy growth may only briefly widen the deficit, whereas years of growth built on rising imports can leave a persistent, harder to finance deficit.
Judgement: growth is most likely to conflict with the environment and the current account when it is driven by rising consumption of imported, resource-intensive goods, and least likely to when it is driven by cleaner production and UK-made output, which is why governments try to shape how growth happens and not just how fast it happens.
Governments must prioritise and accept some trade-offs
- Because objectives conflict, a government cannot pursue every aim as strongly as it would like at once, so it must decide which objectives matter most given the state of the economy at the time.
- Different governments can reasonably weigh the same trade-off differently, for example prioritising jobs over inflation in a downturn but the reverse when prices are rising quickly.
- When a question asks you to explain a conflict, name both objectives and show the chain of reasoning by which improving one worsens the other, using the term trade-off explicitly.
- For evaluate questions, use the phrase it depends on and name a real factor, such as spare capacity or how growth is produced, before giving a supported verdict rather than a vague on the other hand.
- A common trap is claiming a government can meet every objective at once. Acknowledge that gains on one objective usually cost something on another.
- What is meant by a conflict between government objectives?
- Explain how faster growth can lead to higher inflation.
- Why might very low unemployment conflict with low inflation?
- Give one way growth can conflict with the environment or the current account.
- What does the seriousness of the growth versus inflation conflict depend on?
2.2.1c Other objectives and ethical considerations
Governments pursue other objectives beyond growth, jobs and prices
- Alongside the four principal objectives, growth, price stability, full employment and a stable balance of payments, governments hold other objectives too.
- These include reducing inequality and managing environmental change, reflecting a wish for an economy that is fair and sustainable, not just large.
Reducing inequality is another government objective
- An unequal distribution of income or wealth across the population, covered fully in 2.2.6, means fewer people live in poverty when that gap between richest and poorest households is smaller.
- Government policy can narrow this gap through progressive taxation and through benefits and public services targeted at lower-income households, covered in more depth elsewhere.
- The UK's Gini coefficient for disposable income was 32.9 per cent in the year to March 2024, a standard measure of how unequally income is spread.
- In the same year, the richest fifth of households had around 5.6 times the disposable income of the poorest fifth.
- Median household disposable income was £36,700 a year in the same period.
Managing environmental change is another objective
Sustainable development: meeting the needs of the present without compromising the ability of future generations to meet their own needs.
- Using resources today should not leave future generations worse off, so development is only sustainable if it can continue over the long term.
- A country that plants new trees to replace the ones it cuts down can keep using timber for years to come.
- A country that clears its forests without replanting gains wood now but leaves nothing for the future.
Growth can deplete resources and damage the environment
- Depleting resources: using non-renewable resources such as oil, coal and metals means less is left for future generations.
- Pollution: more production and transport can raise air and water pollution, which harms health and the natural world.
- Environmental damage: overfishing and burning fossil fuels can cause lasting harm such as deforestation and climate change.
Sustainable development does not mean stopping growth. It means making growth cleaner and longer lasting, so resources and the environment are not used up faster than they can recover.
Countries can take steps to make growth more sustainable
- Countries can make growth more sustainable by switching to renewable energy such as wind and solar, conserving resources through recycling, and controlling pollution with rules and taxes.
- These steps can cost more or slow growth in the short term, so governments must weigh the benefits to the future against the costs today.
Moral and ethical considerations underpin these objectives
Ethical considerations: ideas about what is right and fair that guide the choices a government makes.
- These include a duty to look after the poorest people in society and a duty to protect the planet for future generations.
- For many governments, reducing inequality and protecting the environment are valued as objectives in their own right, not only because they support growth.
Pursuing one objective can harm a specific group
- A policy aimed at one objective can help the country overall while still making a particular group of people worse off.
- Raising interest rates to fight inflation: raises monthly repayments for people with a variable-rate or newly fixed mortgage, even though it helps savers and slows inflation for everyone.
- Taxing carbon-heavy industries to protect the environment: can raise costs and put jobs at risk in specific industries, such as steel or oil and gas, even though it benefits the wider population through a cleaner environment.
- Raising the minimum wage to reduce in-work poverty: raises pay for low-paid workers who keep their jobs, but can make some low-skilled jobs too expensive for firms to keep, risking job losses for a smaller group.
Judgement: a policy that harms a specific group is not automatically wrong, since it can still be worth it if it raises wellbeing overall, but who bears the cost is still part of judging how fair or acceptable the policy is.
Weighing costs to one group against wider gains
- This weighing up applies to each example above, from mortgage holders facing higher repayments to workers in carbon-heavy industries and low-skilled workers priced out of jobs, since each is a specific group bearing a cost while the wider population gains.
Name the specific group harmed by a policy, not just that it has downsides, then weigh the size of that harm against the wider benefit.
- Name two government objectives other than growth, price stability, full employment and the balance of payments.
- Define sustainable development.
- Give two ways economic growth can harm the environment.
- What are ethical considerations, and how do they shape government objectives?
- Give one example of a policy that helps the economy overall but harms a specific group of people.
2.2.2a The significance of economic growth
Economic growth means an increase in real output
Economic growth: an increase in a country's real output over a period of time, usually a year, so the economy is producing more than before.
- Growth is measured for the whole economy, not for a single firm or household.
- Real output means the actual quantity of goods and services produced, once the effect of rising prices has been stripped out.
- A rise only counts as growth if more is genuinely produced, not just if prices have gone up; the full real GDP calculation is covered in 2.2.2c.
- When more is produced each year, the economy is said to be growing.
- UK real GDP grew by 1.2 per cent in the year to Q2 2026 (April to June 2026), the latest published figure.
- Quarter on quarter, real GDP rose by 0.4 per cent in April to June 2026 alone.
Growth can speed up, slow down or turn negative
- Positive growth means real output is higher than it was in the previous period.
- Growth can be faster in some years and slower in others, even while output is still rising.
- Negative growth means real output has fallen, so the economy has become smaller.
- Over the long run most economies grow, but the rate of growth changes from year to year.
- Slower growth is not the same as the economy shrinking; if the growth rate falls from 3 per cent to 1 per cent, output is still rising, just more slowly.
- The economy only shrinks when growth turns negative.
Higher output raises incomes and living standards
- Producing more goods and services usually means firms need more workers, so employment tends to rise.
- As firms sell more, they pay out more in wages and profits, so household incomes tend to rise.
- Higher incomes let people buy more goods and services, raising material living standards.
- Growth also gives the government more tax revenue, which can fund public services such as schools and hospitals.
- With the UK's employment rate at 75.1 per cent (April to June 2026, ages 16 to 64), most working-age adults are sharing in the income that growth generates.
- Real GDP per capita rose by 1.0 per cent in the year to Q2 2026, meaning average output, and roughly income, per person increased.
Economic growth is a central goal for governments
- Because growth raises incomes and employment, most governments treat it as an important economic aim.
- Steady growth helps a country reduce poverty by giving more people access to paid work.
- Growth can improve living standards over the long term, as output per person tends to rise.
- For these reasons, policymakers watch quarterly GDP releases from the ONS closely, and growth is one of the government's main macroeconomic objectives.
- What is meant by economic growth?
- Explain the difference between slower growth and negative growth.
- Give two reasons why economic growth matters for living standards.
- What has happened to the UK's real GDP per capita over the year to Q2 2026?
2.2.2b Causes, costs, benefits and policies for growth
Growth comes from more or better factors of production
- An economy grows when it can produce more, which needs more or better factors of production.
- A larger or more skilled workforce (labour) allows more goods and services to be made.
- More capital, such as machines and factories, lets each worker produce more.
- Discovering or using more natural resources (land) can also raise output.
- Growth can come from using more resources, or from using the same resources more effectively.
- Both routes raise the total output an economy can produce.
Investment builds up the economy's capital
- Investment is spending by firms on capital goods such as equipment, tools and buildings.
- More capital means workers have better tools, so output per worker can rise.
- Investment in infrastructure, such as roads and broadband, helps the whole economy produce and trade more.
- Because it expands productive capacity, investment is one of the main drivers of long-term growth.
- The rollout of full-fibre broadband and 5G networks across the UK is a real example of infrastructure investment intended to raise the economy's long-run output.
- A firm that buys new machinery can produce more each day with the same staff; across a whole economy, this kind of investment adds up to higher output.
Better skills and technology raise productivity
- Productivity is output per worker or per hour, and rising productivity is a key cause of growth.
- Education and training improve workers' skills, so they produce more and better output.
- Technological change, such as new machines or software, lets firms produce more from the same inputs.
- Improvements in health also raise productivity, because healthier workers miss less work and work more effectively.
- Growth can come from producing more (quantity of factors) or from producing more efficiently (quality of factors).
- Productivity gains are especially powerful because they raise output without needing more resources.
Government policy can support the causes of growth
- Governments can encourage growth by funding education and training to improve skills.
- Spending on infrastructure gives firms the roads, ports and networks they need to expand.
- Policies that encourage firms to invest, such as grants or stable conditions, help build capital.
- These are examples of supply-side policy, which is covered in full in 2.3.3; here it matters because it raises the economy's capacity to produce.
Growth raises incomes, jobs and living standards
- Economic growth usually raises average incomes, letting people buy more goods and services.
- As firms expand, they hire more workers, so employment tends to rise and unemployment to fall.
- Higher output gives the government more tax revenue to spend on public services.
- Over time, growth tends to raise material living standards and reduce poverty.
- Between August 2024 and December 2025, as the UK economy kept growing, the Bank of England cut Bank Rate six times from 5.25 per cent to 3.75 per cent, and by April to June 2026 the UK's employment rate stood at 75.1 per cent (Source: Bank of England; ONS).
- This shows growth, jobs and policy moving together: as output and confidence held up, the labour market stayed strong.
Fast growth can cause inflation and use up resources
- If demand grows faster than the economy can produce, prices may rise, causing inflation.
- Rapid growth can use up non-renewable resources, such as oil and minerals, more quickly.
- This raises the question of whether current growth is sustainable for future generations.
- Growth is not always good for everyone; the benefits and costs are often shared unevenly.
- A rising average income can hide the fact that some groups gain far more than others.
Growth can widen inequality and damage the environment
- The gains from growth may go mainly to owners of firms and skilled workers, widening inequality.
- Increased production often causes more pollution and greenhouse gas emissions.
- Growth can lead to loss of green space, congestion and other environmental costs.
- These social and environmental effects are not shown in the GDP figures themselves.
- Whether growth is worthwhile depends on how the gains are shared and on the size of the costs.
- Many economists argue for growth that is environmentally and socially sustainable.
How far growth's benefits outweigh its costs
- It depends on how fast the economy grows, because slow, steady growth is less likely to trigger inflation than a rapid boom that outstrips the economy's capacity to produce.
- It depends on how the gains are shared, because growth concentrated among firm owners and skilled workers widens inequality, while broad-based wage growth raises living standards for most people.
- It depends on whether the growth is environmentally sustainable, because growth built on depleting non-renewable resources or high emissions creates costs that future generations must bear.
- It depends on the state of the economy beforehand, because growth that reduces high unemployment brings large benefits, whereas growth in an economy already close to full employment mainly pushes up prices.
- Overall, therefore, steady, broad-based and environmentally sustainable growth benefits an economy far more than growth that is rapid, unevenly shared or environmentally costly.
- Name three factors of production whose increase can cause economic growth.
- Explain how investment leads to economic growth.
- Give two benefits and two costs of economic growth.
- Explain why growth might not make everyone better off.
- What factors would you weigh up when judging whether a period of growth was a good thing?
2.2.2c GDP measures and calculations
GDP measures the value of what a country produces
Gross Domestic Product (GDP): the total value of all goods and services produced within a country in a given period, usually a year, added up using current prices.
- Because output is hard to add up in units, GDP adds it up in money terms, using the prices of the goods and services.
- A rising GDP suggests the economy is producing more, so GDP is the main measure used to track economic growth.
- GDP counts production inside the country's borders, whoever owns the firms.
- GDP is a flow, measured over a period of time such as a quarter (three months) or a year.
- It is usually reported as a total figure, for example in billions of pounds.
Real GDP strips out the effect of rising prices
Nominal GDP: GDP measured using the prices of goods and services in the current year.
Real GDP: GDP measured using prices from a fixed base year, so it removes the effect of price changes.
- If prices rise, nominal GDP can go up even when the actual quantity produced has not changed.
- Because it ignores price rises, real GDP is the figure used to judge genuine economic growth.
- A rise in nominal GDP does not always mean more has been produced; it may just mean prices have risen.
- Always use real GDP to judge whether output has truly grown.
Converting nominal GDP to real GDP removes price rises
- To convert nominal GDP into real GDP, divide nominal GDP by the price index for that year, expressed as a fraction of 100.
- The formula is:
- A worked example economy has nominal GDP of £2,142bn in the current year, when the price index is 105 (base year = 100).
- So although nominal GDP was £2,142bn, once the 5 per cent rise in prices is removed, real GDP is only £2,040bn.
- The £2,142bn nominal GDP and price index of 105 here are invented figures chosen to make the method clear. They are not the UK's real GDP.
- In an exam, never invent a UK total. Use an official published figure, such as a growth rate given elsewhere in this article, or describe the direction and scale of change in words.
GDP per capita shows output for each person
GDP per capita: a country's GDP divided by its population, showing the average value of output, and roughly income, per person.
- GDP per capita is useful for comparing countries of different population sizes.
- A large country can have a high total GDP but a low GDP per capita if its population is very large.
- When comparing living standards between countries, GDP per capita is usually more useful than total GDP.
- It answers the question how much output there is for each person, rather than how big the economy is.
GDP per capita is GDP divided by population
GDP per capita=GDP÷population \text{GDP per capita} = \text{GDP} \div \text{population} GDP per capita=GDP÷population- Keep the units consistent on the top and bottom of the division, for example pounds and people.
- Using the invented real GDP of £2,040bn from the worked example above, and a made-up population of 34 million:
- So on average, each person in this invented example economy has £60,000 of output available to them, a result of the method, not a real UK figure.
The growth rate is real GDP's percentage change
- Economic growth is worked out as the percentage change in real GDP from one year to the next.
- Using real GDP means the result shows a true change in output, not just a change in prices.
- Suppose, for a made-up economy (not the UK's actual GDP level), real GDP rises from £2,000bn to £2,024bn in one year.
Step 1: find the change:
£2,024bn−£2,000bn=£24bn \pounds2{,}024\text{bn} - \pounds2{,}000\text{bn} = \pounds24\text{bn} £2,024bn−£2,000bn=£24bnStep 2: divide by the original value and multiply by 100:
Growth rate=242,000×100=1.2 per cent \text{Growth rate} = \dfrac{24}{2{,}000} \times 100 = 1.2\text{ per cent} Growth rate=2,00024×100=1.2 per cent- This invented economy happens to give the same rate as the UK's real annual real GDP growth of 1.2 per cent in the year to Q2 2026, April to June 2026, but the £2,000bn and £2,024bn starting figures are not the UK's real GDP (Source: ONS, GDP first quarterly estimate, UK: April to June 2026).
A falling real GDP gives a negative growth rate
- If real GDP falls, the percentage change is negative, showing the economy has shrunk.
- For example, continuing the invented figures above, if real GDP fell from £2,040bn to £2,020bn, the change is about:
A negative growth rate means output is lower than the year before.
- Always divide the change by the starting value, not the final value.
- Using the wrong base gives a slightly wrong growth rate.
Always finish by saying what the number means
- A calculated figure is only useful once it is interpreted.
- A growth rate of 1.2 per cent means real output, and roughly average incomes, rose by that much over the year.
- A rise in GDP per capita suggests the average person has more goods and services available than before.
- Ending with an interpretation sentence turns a calculation into an economic conclusion.
- State whether a figure is real or nominal GDP, and whether the question asks for GDP, GDP per capita or the growth rate, since each answers a different question.
- Show your working line by line and substitute the numbers into the formula before you calculate, since a clear method still shows you understand it even if the final figure ends up wrong.
- Attach the correct unit to your final answer: a percentage for a growth rate, and pounds per person for GDP per capita.
- What does GDP measure, and what is the difference between real and nominal GDP?
- How is GDP per capita calculated and what does it show?
- Real GDP rises from £500bn to £515bn. Calculate the growth rate.
- Why must you always divide by the original value, not the final value, when finding a growth rate?
- A country's nominal GDP rises but its price index rises by the same percentage. What happens to real GDP?
2.2.3a Measuring employment and unemployment
Employment means doing paid work
Employment: when a person of working age is doing paid work, either for an employer or for themselves, whether full-time, part-time or self-employed.
- In the UK the working-age population is usually taken as those aged 16 to 64.
- A person counts as employed even after only a small amount of paid work in the week, such as a few hours.
- A nurse working 37 hours a week for a hospital is employed.
- A plumber who runs their own firm is self-employed and still counts as employed.
- A sixth-former with a Saturday job of six hours is also counted as employed.
Unemployment means wanting work but having none
Unemployment: when a person is out of work, available to start a job, and actively looking for one.
- A person must meet all three parts of this test at the same time:
- they have no paid work,
- they are ready to start work soon,
- they have looked for work recently.
- Someone who fails any part of the test is not classed as unemployed.
- The test is about what a person is doing, not just about lacking a job.
- A person can be without a job yet not unemployed if they are not looking or not available.
The labour force is the employed plus the unemployed
Labour force (economically active): everyone who is employed plus everyone who is unemployed.
Economically inactive: people of working age who are neither employed nor unemployed, for example because they are not looking for work.
- The economically inactive include students, retired people, those caring for family and the long-term sick.
- Discouraged workers, who have given up looking, are counted as inactive rather than unemployed.
- Someone who is not looking for work is economically inactive, not unemployed.
- Only people who are both available and looking are counted as unemployed.
Employment patterns have changed over time
- Full employment does not mean everyone has a job; it means nearly everyone who wants a job at going wages can find one.
- The share of part-time and flexible jobs has grown over recent decades.
- More women have joined the labour force, raising the participation rate.
- Employment has shifted from manufacturing towards service industries.
Unemployment is measured in two main ways
- The UK measures unemployment using the Claimant Count and the Labour Force Survey.
- Each method counts a slightly different group of people, so the two figures rarely match exactly.
- Both methods try to count people who are out of work and want a job.
- They differ in how they gather the information and who they include.
The Claimant Count records people claiming benefits
Claimant Count: the number of people claiming unemployment-related benefits, mainly Universal Credit or Jobseeker's Allowance in the searching for work group, because they are out of work and looking for a job.
- It is cheap and quick because the figures come from records the government already keeps.
- It can undercount because some jobless people do not qualify for benefits or choose not to claim.
- In July 2026 the UK Claimant Count stood at 1.665 million (Source: ONS).
Because it only counts claimants, a change to benefit rules can move the figure even when the real number of jobless people has not changed.
The Labour Force Survey uses the international ILO measure
Labour Force Survey (LFS): a large survey of UK households that measures unemployment using the international ILO (International Labour Organization) definition.
- It counts someone as unemployed if they are without a job, available to start within two weeks, and have actively looked for work in the last four weeks.
- Because it uses an international standard, the survey lets us compare unemployment between countries.
- It is more expensive and slower than the Claimant Count, and as a survey it carries a margin of sampling error.
- Do not treat the Claimant Count and the LFS/ILO measure as the same number.
- The LFS figure usually gives a higher total because it includes jobless people who are not claiming benefits.
The two measures give different figures
- The ILO measure from the Labour Force Survey is the headline figure used in official reports and international comparisons.
- For April to June 2026, the UK's headline (LFS/ILO) unemployment rate was 4.9 per cent, a different measure from the Claimant Count of 1.665 million for July 2026, so the two should not be compared directly (Source: ONS).
The un/employment rate and economic activity
Unemployment rate: the number of unemployed people as a percentage of the economically active population (those in work plus those seeking work), not of the whole population.
Employment rate: the number of people in work as a percentage of the working-age population (aged 16 to 64).
Economic inactivity rate: the number of economically inactive people as a percentage of the working-age population (aged 16 to 64).
Because the employment, unemployment, inactivity rates are percentages, they can be compared over time and between countries of different sizes.
Working out the unemployment rate from raw numbers
- The formula is:
- A town has an economically active population of 40,000, of whom 2,000 are unemployed.
- This worked example gives a rate of 5 per cent, close to the UK's actual unemployment rate of 4.9 per cent for April to June 2026 (Source: ONS).
A rate needs its base and period stated
- Always state which population a rate is a percentage of: the economically active population for the unemployment rate, or the working-age population for the employment and inactivity rates.
- Always name the time period, such as April to June 2026, since labour market figures are updated with each ONS release.
- In your own words, what three conditions make a person unemployed?
- Who belongs to the labour force, and who is economically inactive?
- How does the Claimant Count differ from the Labour Force Survey measure?
- A town's economically active population is 20,000 and 800 people are unemployed. Calculate the unemployment rate.
- What is the difference between the unemployment rate and the economic inactivity rate?
2.2.3b Types and causes of unemployment
The same word covers several different kinds of unemployment
- Economists sort unemployment into types so that each can be understood and tackled.
- Each type has a different cause and typical length, so telling them apart is an important skill.
- In 2026, four very different UK workers might all be counted as unemployed: a graduate from Leeds still job-hunting a few weeks after finishing university, a former Port Talbot steelworker whose skills no longer match local vacancies, a seasonal worker laid off once Blackpool's tourist season ends, and a construction worker made redundant during a downturn in house-building.
- Same word, four different situations, which is why the types are worth separating.
The four main types each have a clear meaning
- Frictional and seasonal unemployment are usually short-lived and exist even in a healthy economy.
- Structural unemployment can last a long time because workers need to retrain or move.
- Cyclical unemployment appears in a downturn and fades in a recovery.
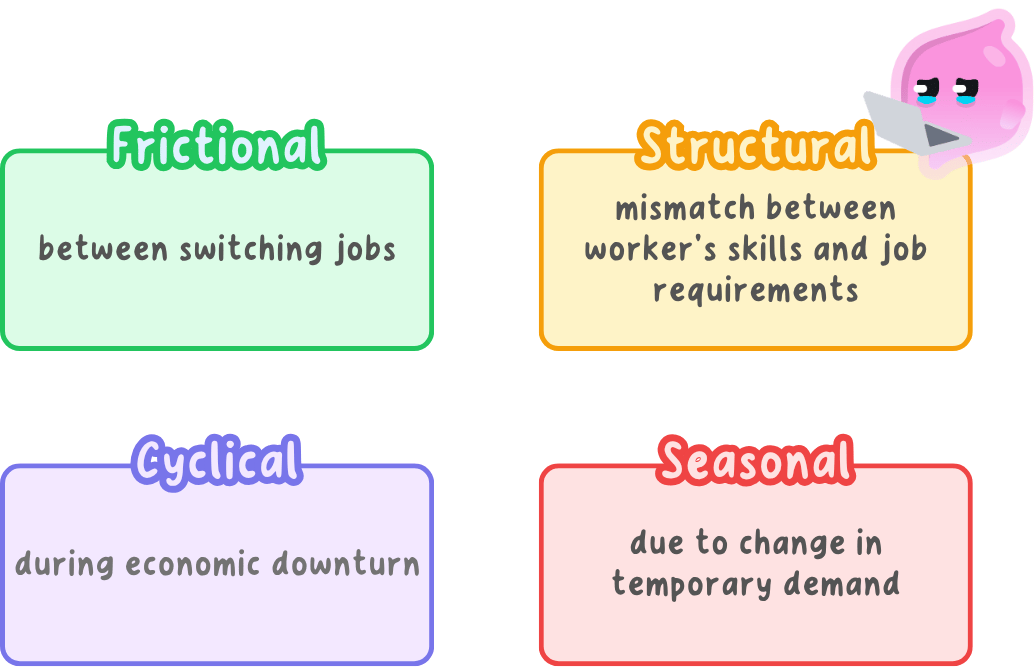
- Do not treat all unemployment as the same thing.
- Being briefly between jobs (frictional) is not the same as being out of work because demand has collapsed (cyclical).
Frictional unemployment happens between jobs
Frictional unemployment: short-term joblessness while people move between jobs, searching for a suitable vacancy.
- Frictional unemployment is caused by imperfect information: workers and employers take time to find each other, and finding a suitable vacancy takes time even when jobs exist.
- A university graduate from Leeds spends six weeks applying for graduate schemes before accepting a marketing role in Manchester.
- This is frictional unemployment: the cause is the normal time it takes to search for and match to a suitable job, not a lack of vacancies.
Seasonal unemployment follows the time of year
Seasonal unemployment: unemployment that rises and falls with the time of year as demand for certain work changes.
- Seasonal unemployment is caused by regular changes in demand across the year, for example in tourism, farming and construction.
- Seasonal workers at Blackpool's seaside attractions are laid off each autumn when the tourist season ends and visitor numbers fall, then rehired the following spring.
- This is seasonal unemployment: the cause is the predictable yearly change in demand for that work, not the state of the wider economy.
Structural unemployment follows long-term change
Structural unemployment: unemployment caused by a long-term mismatch between workers' skills or location and the jobs available.
- New technology and automation can replace workers with machines.
- Globalisation can move production to countries with lower costs.
- The decline of industries leaves workers with skills that are no longer needed.
- A geographical mismatch means jobs exist, but not where the unemployed live.
- When Tata Steel closed the blast furnaces at its Port Talbot steelworks in 2024, thousands of steelworkers lost jobs whose specific skills were no longer needed locally.
- This is a clear case of structural unemployment, caused by the long-term decline of a major local industry.
Cyclical unemployment follows the ups and downs of demand
Cyclical (demand-deficient) unemployment: unemployment caused by a fall in the total demand for goods and services during an economic downturn.
- Cyclical unemployment is caused by a fall in total spending in the economy during a downturn.
- When sales fall, firms produce less and cut jobs; as incomes fall, spending falls further, so still more jobs can be lost.
- During the COVID-19 lockdowns in 2020, spending collapsed as pubs, shops and hotels closed, and unemployment rose as firms cut jobs and hours.
- This is a clear case of cyclical, demand-deficient unemployment, caused by a sudden fall in total spending across the economy rather than by workers' skills.
The types differ in how long they typically last
- Voluntary unemployment, where specified, is when a person chooses not to take a job at the going wage, rather than being unable to find one.
- Matching a cause to a type is the key skill: ask what the person's situation is, and the type usually becomes clear.
Do not label someone unemployed when they are in fact economically inactive, for example if they have stopped looking for work altogether.
Naming the type is the key exam skill
- In the exam you often need to match an example to its type and justify your choice by linking it to the cause.
- Support your choice of type with the specific detail in the scenario, such as the season, the industry, or whether demand across the whole economy has changed.
- Name the four main types of unemployment and give one cause of each.
- Which type tends to last longest, and why?
- A fruit picker has no work in winter. Which type is this, and why?
- Explain why the closure of the Port Talbot blast furnaces is an example of structural unemployment.
- Why is being briefly between jobs not the same as cyclical unemployment?
2.2.3c Consequences and policies for unemployment
Unemployment harms the people without work
- The unemployed lose their income, so their living standards fall.
- Longer spells can lead to poverty and debt.
- Skills can fade the longer someone is out of work, making it harder to get a job.
- Unemployment can damage physical and mental health and confidence.
- A worker made redundant may struggle to pay rent and fall behind on bills.
- After a long spell out of work, their skills and confidence may have slipped.
Firms and local communities feel the effects too
- With fewer people earning, firms sell less, so their revenue falls.
- Some firms may then cut jobs of their own, spreading the problem.
- High local unemployment can lead to falling spending in the community, with shops closing.
- Areas of high unemployment can suffer more crime and other social problems.
- Think in ripples: one job loss cuts spending, which can cost other people their jobs.
- This is why unemployment can spread through a town, not just one household.
The government and the whole economy lose out
- The government pays more in benefits to support the unemployed.
- It also collects less in tax, because fewer people earn income and spend.
- This can push the government's budget into deficit.
- The economy loses the output those workers could have produced, so total output is lower than it could be.
- Welfare and benefit spending, which includes unemployment-related benefits, was the UK government's largest single spending area at around £313.6 billion in 2024 to 25.
- A rise in unemployment adds directly to this bill while shrinking the tax revenue that pays for it.
The size of the impact depends on the situation
- Short spells of unemployment do less harm than long-term unemployment.
- A strong benefits system can soften the impact on living standards.
- The wider damage is greater when unemployment is high and widespread.
- Do not treat unemployment as a cost only to the jobless person.
- Taxpayers, firms, communities and the whole economy also bear the cost.
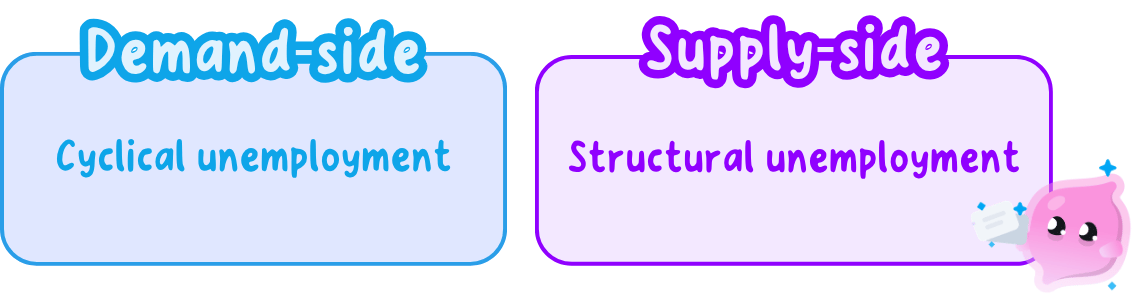
Demand-side policy targets cyclical unemployment
- Cyclical unemployment is caused by weak demand, so governments can use fiscal policy: increasing government spending or cutting taxes to raise spending in the economy.
- The Bank of England can use monetary policy: cutting Bank Rate to make borrowing cheaper, encouraging firms and households to spend and invest more.
- As demand recovers, firms need more workers, so cyclical unemployment falls.
Fiscal policy is covered in full in 2.3.1a, 2.3.1b and 2.3.1c, and monetary policy in 2.3.2a and 2.3.2b.
- Between August 2024 and December 2025 the Bank of England cut Bank Rate six times, from 5.25 per cent to 3.75 per cent, to support demand as inflation eased.
- This is a real example of monetary policy responding to the economic cycle, with Bank Rate held at 3.75 per cent through 2026.
Supply-side policy targets structural unemployment
- Structural unemployment is caused by a mismatch between workers' skills or location and the jobs available, so it needs policies that improve the workforce rather than simply raising demand.
- Government-funded training and retraining schemes help workers whose old skills are no longer in demand gain skills employers want.
- Job centres and careers advice help match unemployed workers to available vacancies, including in other areas.
- These are examples of supply-side policy, which is covered in full in 2.3.3; here they matter because they reduce the mismatch behind structural unemployment.
How far unemployment policies work depends on the type
- It depends on which type of unemployment is being tackled, because demand-side policy can quickly cut cyclical unemployment but does little for structural unemployment caused by a skills mismatch.
- It depends on time lags, because interest rate changes and training schemes both take months or years to change spending and skills, so policies do not fix unemployment overnight.
- It depends on the risk of side effects, because demand raised too far can cause inflation, and spending on training and benefits must be paid for through taxes or borrowing.
- It depends on how well policy is targeted, because retraining and job centre support work best when aimed at the specific skills and locations where structural unemployment is highest.
- Overall, therefore, no single policy solves every type of unemployment: demand-side policy suits a cyclical downturn, while supply-side policy is needed for the longer-term mismatch behind structural unemployment.
- Match the policy to the type of unemployment named in the question, since a demand-side answer to a structural unemployment question is answering a different problem from the one asked about.
- When asked to judge how effective a policy is, refer to time lags and cost rather than simply describing what the policy does.
- Where a question gives data such as the Claimant Count or unemployment rate, use the actual figures to judge the scale of the problem before evaluating the policy.
- Give two ways unemployment harms the person without work.
- Explain how unemployment affects the government's budget.
- Why is long-term unemployment usually more damaging than a short spell?
- Which type of policy, demand-side or supply-side, is better suited to cyclical unemployment, and why?
- Give one reason why a policy to reduce unemployment might not work quickly.
2.2.4a What inflation is
Inflation is a sustained rise in prices
- Prices for individual goods and services rise and fall all the time, for all sorts of different reasons.
- Inflation is about what happens to prices on average across the whole economy, not the price of any single item.
Inflation: a sustained rise in the general price level of an economy, so the average of all prices ends up higher than it was before.
Rate of inflation: the percentage increase in the general price level over a period of time, usually a year.
- A single price shock, such as a bad harvest pushing up the price of potatoes, is not inflation on its own.
- It only counts as inflation once it feeds through into a sustained rise across prices generally, not just one product.
- The Office for National Statistics (ONS) announces the UK rate of inflation each month.
- In July 2026, the UK's CPI rate of inflation was 2.9 per cent, so the general price level was 2.9 per cent higher than a year earlier.
- If a weekly shop cost £50 in July 2025 and £51.45 in July 2026, that 2.9 per cent rise matches the economy-wide figure.
Falling inflation is not falling prices
- The rate of inflation can rise or fall from month to month, and this often confuses the word falling.
- If the rate falls from, say, 6 per cent to 3 per cent, prices are still rising, just more slowly than before.
Disinflation: a fall in the rate of inflation, so prices are still rising but more slowly than before.
Deflation: a sustained fall in the general price level, so prices are actually falling on average and the rate of inflation is negative.
- UK CPI inflation fell from 2.8 per cent in May 2026 to 2.6 per cent in June 2026: prices were still rising each month, just at a slightly slower annual pace, so this was disinflation, not deflation.
- Deflation is rare in the UK. It would show up as a negative CPI rate, for example minus 1 per cent, meaning the general price level had actually fallen.
- A falling rate of inflation (disinflation) is not the same as falling prices (deflation).
- Only a negative rate of inflation means the general price level is genuinely falling.
Price stability keeps the economy predictable
- Governments and central banks aim for price stability: low and steady inflation, rather than rapid swings in either direction.
- Very high inflation makes it hard for households and firms to plan, because money loses its value quickly and unpredictably.
- Deflation can also cause problems, because if people expect prices to keep falling they may delay spending, which can weaken the economy further.
- For this reason, a small, stable, positive rate of inflation is usually judged healthier than either high inflation or deflation.
- State in one sentence what is meant by inflation.
- State what is meant by the rate of inflation.
- Explain the difference between deflation and disinflation.
- Explain why a falling rate of inflation does not mean prices are falling.
- Give one reason why governments aim for price stability.
2.2.4b Measuring inflation with the CPI
The CPI tracks a basket of typical spending
- UK inflation is measured using the Consumer Prices Index, published every month by the ONS.
- It is built from the changing cost of a fixed list of goods and services that a typical household buys.
CPI: the Consumer Prices Index, the UK's main measure of inflation, which tracks the changing cost of a basket of goods and services over time.
Basket of goods and services: a fixed list of the goods and services that a typical household buys, used to track how the cost of living changes.
- Items added to the 2026 basket include houmous, alcohol-free beer, pet grooming services, motorhomes, dashcams, croissants and baby food.
- Items removed include wrapping paper sold in sheets and bottled premium lager bought in pubs and restaurants.
Items in the basket are weighted by spending
Weight: a number that shows how much importance an item is given in the CPI, based on the share of household spending it represents.
- Each item in the basket is given a weight based on how much of their income households spend on it.
- Items households spend a lot on, such as housing and food, carry a larger weight than items bought rarely.
- A price rise in a heavily weighted item moves the CPI more than the same rise in a lightly weighted item.
- The weights are updated each year from surveys of what households actually spend their money on.
- Housing costs carry one of the largest weights in the CPI basket.
- A change in rents or mortgage-related costs therefore moves the CPI far more than the same percentage change in, say, the price of stationery.
A price index turns basket cost into one number
Price index: a single number, based on the cost of the basket of goods and services, used to compare price levels between different time periods.
Base year: the year chosen as the starting point for a price index, which is given an index value of 100.
- The total cost of the basket is turned into a price index, a single number that makes it easy to compare years.
- An index above 100 means prices are higher than in the base year; an index below 100 means they are lower.
- For example, an index of 105 means prices are 5 per cent higher than in the base year.
- A price index can be calculated directly from the cost of the same basket in two different years.
- A basket of goods and services costs £200.00 in the base year and £205.80 in the year being compared.
Step 1: write down the cost of the basket in the base year and in the year being compared:
Base year basket cost=£200.00 \text{Base year basket cost} = \pounds 200.00 Base year basket cost=£200.00 This year’s basket cost=£205.80 \text{This year's basket cost} = \pounds 205.80 This year’s basket cost=£205.80Step 2: divide this year's cost by the base year cost and multiply by 100:
Price index=This year’s costBase year cost×100 \text{Price index} = \dfrac{\text{This year's cost}}{\text{Base year cost}} \times 100 Price index=Base year costThis year’s cost×100 Price index=205.80200.00×100=102.9 \text{Price index} = \dfrac{205.80}{200.00} \times 100 = 102.9 Price index=200.00205.80×100=102.9- A price index of 102.9 means the basket cost 2.9 per cent more this year than in the base year.
Two CPI index numbers give the inflation rate
- The rate of inflation can be calculated directly from the CPI index for two different periods, without needing the basket cost itself.
- CPIH is a similar measure that also includes the costs of owning and living in your own home; CPIH inflation was 3.1 per cent in July 2026, slightly higher than CPI.
- A country's CPI index number rises from 132.0 in an earlier period to 135.8 in a later period.
Step 1: write down the CPI index for the earlier period and the later period:
CPI, earlier period=132.0 \text{CPI, earlier period} = 132.0 CPI, earlier period=132.0 CPI, later period=135.8 \text{CPI, later period} = 135.8 CPI, later period=135.8Step 2: find the change, divide by the earlier index, and multiply by 100:
Rate of inflation=Later index−Earlier indexEarlier index×100 \text{Rate of inflation} = \dfrac{\text{Later index} - \text{Earlier index}}{\text{Earlier index}} \times 100 Rate of inflation=Earlier indexLater index−Earlier index×100 Rate of inflation=135.8−132.0132.0×100≈2.9 per cent (to 1 d.p.) \text{Rate of inflation} = \dfrac{135.8 - 132.0}{132.0} \times 100 \approx 2.9\text{ per cent (to 1 d.p.)} Rate of inflation=132.0135.8−132.0×100≈2.9 per cent (to 1 d.p.)CPI figures show whether people are truly better off
- Comparing cash figures across years can be misleading, because £1 today does not buy what it did a year ago.
- Dividing a cash value by the price index, then multiplying by 100, adjusts it for inflation so it can be fairly compared between years.
- If wages rise by 2 per cent while CPI inflation is 2.9 per cent, workers can afford less even though their pay has gone up in cash terms.
- Match your answer to the command word: describe wants the method, while calculate wants a worked figure with units.
- To find the inflation rate from two index numbers, show your working as (new index minus old index), divided by old index, times 100.
- State whether figures are cash amounts or inflation-adjusted before deciding whether someone is genuinely better off.
- Describe what the CPI basket is and why it is updated each year.
- Explain why items in the CPI are weighted.
- State what a price index number tells you compared with the base year.
- Calculate the rate of inflation given two CPI index numbers.
- Explain why a wage rise does not always mean someone is better off.
2.2.4c Causes, consequences and control of inflation
Demand-pull inflation comes from too much spending
Demand-pull inflation: a rise in the general price level caused by total spending in the economy rising faster than the economy's ability to supply goods and services.
- Demand-pull inflation happens when total spending in the economy rises faster than firms can supply goods.
- When many buyers compete for a limited supply of goods, sellers can raise their prices.
- Lower interest rates can trigger this by making borrowing and spending cheaper, motivating the people in the economy to spend more.
- Rising incomes, greater confidence and higher demand for exports can also push total spending up.
- UK real GDP grew by 1.2 per cent over the year to Q2 2026, showing households and firms were spending more.
- When spending across the economy grows faster than firms can expand supply, sellers find they can raise prices without losing many customers.
Cost-push inflation comes from rising business costs
Cost-push inflation: a rise in the general price level caused by firms facing higher costs of production and passing these costs on as higher prices.
- Cost-push inflation happens when firms face higher costs and pass them on as higher prices.
- Higher wages: raise the cost of employing workers.
- Higher raw material and energy prices: make it dearer to produce goods.
- A weaker pound: raises the price of imported materials, and higher taxes on firms add to costs too.
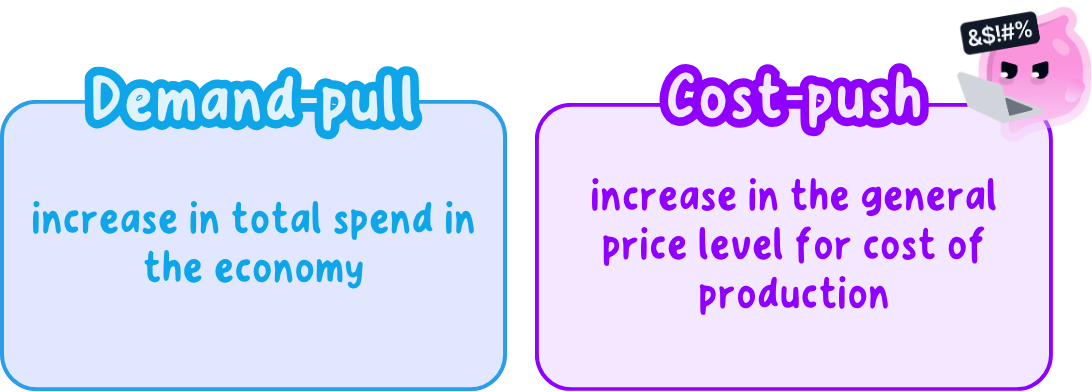
- When world energy prices jump, firms face much higher gas and electricity bills.
- Many pass these costs on, so prices across the shops rise even though demand has not grown.
Spot the cue that signals each type
- To identify the cause in an exam question, ask whether the pressure is coming from demand or from costs.
- A booming economy with heavy spending and low interest rates points to demand-pull inflation.
- A sudden spike in wages, energy or import costs, with spending otherwise steady, points to cost-push inflation.
Inflation creates winners and losers
- Savers: tend to lose, because the money they have saved buys less over time.
- This is worst when the interest earned on savings is lower than inflation.
- Borrowers: can gain, because they repay a fixed debt with money that is worth less than when they borrowed it.
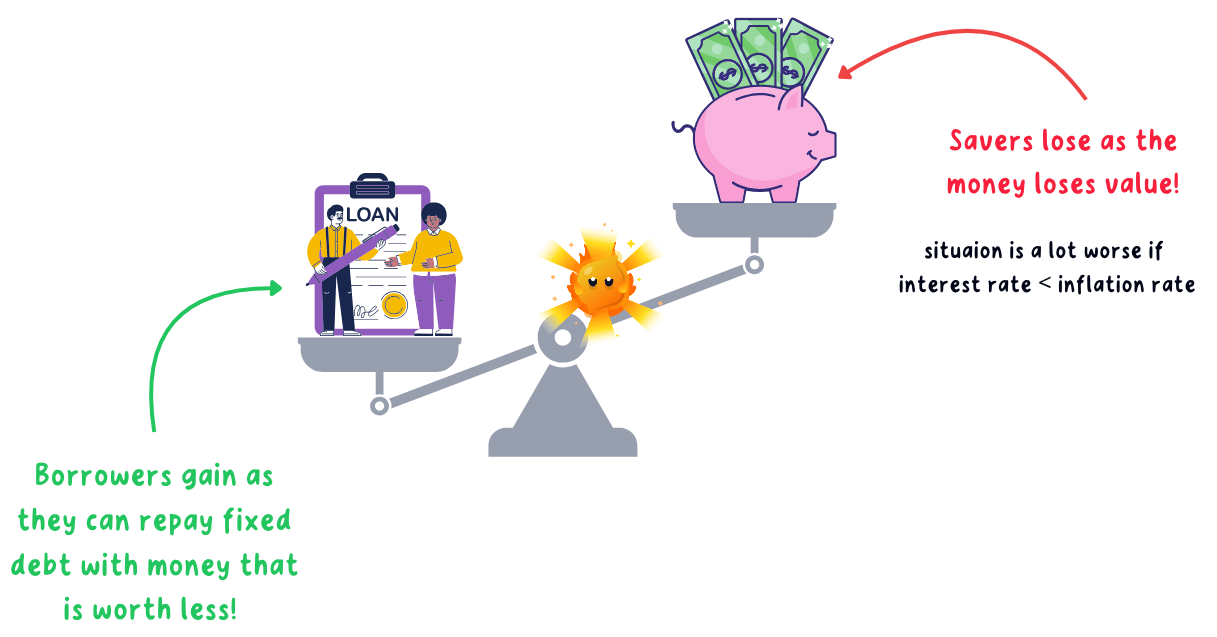
A borrower who takes out a £10,000 loan still repays £10,000 in total, but each of those pounds buys less by the time it is repaid, so the real burden of the debt falls.
Workers and those on fixed incomes feel the squeeze
- If wages rise more slowly than prices, real wages fall and workers can afford less.
- People on fixed incomes, such as some pensioners, lose out because their income does not rise with prices.
- Workers may respond by demanding pay rises to keep up with the cost of living.
- A worker gets a 2 per cent pay rise while CPI inflation is 2.9 per cent.
- Their pay has gone up in cash terms but they are worse off, because prices rose faster than their wage.
Firms face extra costs and uncertainty
Menu costs: the time and money firms spend updating prices, price lists, labels and menus when the general price level changes.
Shoe-leather costs: the extra time and effort people and firms spend moving money around to protect its value when inflation is high.
- Firms face extra costs when they have to change their prices often.
- High inflation also creates uncertainty, which makes it harder for firms to plan and invest for the future.
- Low and stable inflation avoids most of these costs, which is why it is generally preferred to high inflation.
Exporters can lose competitiveness abroad
- If UK prices rise faster than prices abroad, UK goods become more expensive for foreign buyers.
- This can cause exports to fall as customers overseas switch to cheaper suppliers.
- Cheaper imports may also become more attractive than UK-made goods, hurting domestic firms.
- The overall impact depends on how high and how predictable the inflation is, since low steady inflation causes far fewer problems than rapid rises.
The Bank of England and the Government can act
- The main tool for controlling inflation in the UK is monetary policy, where the Bank of England raises interest rates to cool spending. Monetary policy is covered fully in 2.3.2.
- Higher interest rates make borrowing dearer and saving more rewarding, which slows demand-pull inflation by reducing total spending.
- The Government can also use fiscal policy (2.3.1), such as raising taxes or cutting its own spending, to reduce demand in the same way.
- These demand-side policies work best against demand-pull inflation. Cost-push inflation, driven by rising costs rather than excess spending, is much harder for them to fix quickly.
How well anti-inflation policy works depends on the cause
- It depends on the cause of the inflation, because higher interest rates slow demand-pull inflation well, but do little to stop cost-push inflation caused by rising energy or import prices.
- It depends on who is affected, because higher interest rates help savers and squeeze borrowers, the opposite of what unchecked inflation does to each group.
- It depends on the size of the change needed, because a small rate rise may be absorbed easily, while a large rise needed to control high inflation can slow growth and cost jobs.
- It depends on time lags, because interest rate changes can take many months to feed through the economy, so policy may be acting on out-of-date information.
Monetary policy is a reasonably effective brake on demand-pull inflation, but a blunt and slow tool against cost-push inflation, and it always creates winners and losers along the way.
- Explain in one sentence what causes demand-pull inflation.
- Explain in one sentence what causes cost-push inflation.
- Explain why savers tend to lose and borrowers can gain from inflation.
- Explain how high inflation can harm exporters.
- Explain why interest rate rises are a poor tool against cost-push inflation.
2.2.5a Balance of trade and balance of payments
The balance of payments records dealings with the world
- The balance of payments is a record of all the money flowing between one country and the rest of the world over a period of time.
- Money coming into the country counts as an inflow, and money leaving the country counts as an outflow.
- At GCSE level this is studied mainly through its current account, which covers trade and income.
Balance of payments: a record of all the transactions between a country and the rest of the world over a period of time.
Current account: the part of the balance of payments that records trade in goods and services, plus income and transfers, between a country and the rest of the world.
The current account is built from four parts
Trade in goods: exports and imports of physical, visible products such as cars, oil, machinery and food.
Trade in services: exports and imports of invisible services such as tourism, banking, insurance and shipping.
Primary income: income earned from investing or working abroad, such as interest, profits, dividends and wages.
Secondary income: transfers where nothing is exchanged in return, such as government aid, grants and money sent home by workers.
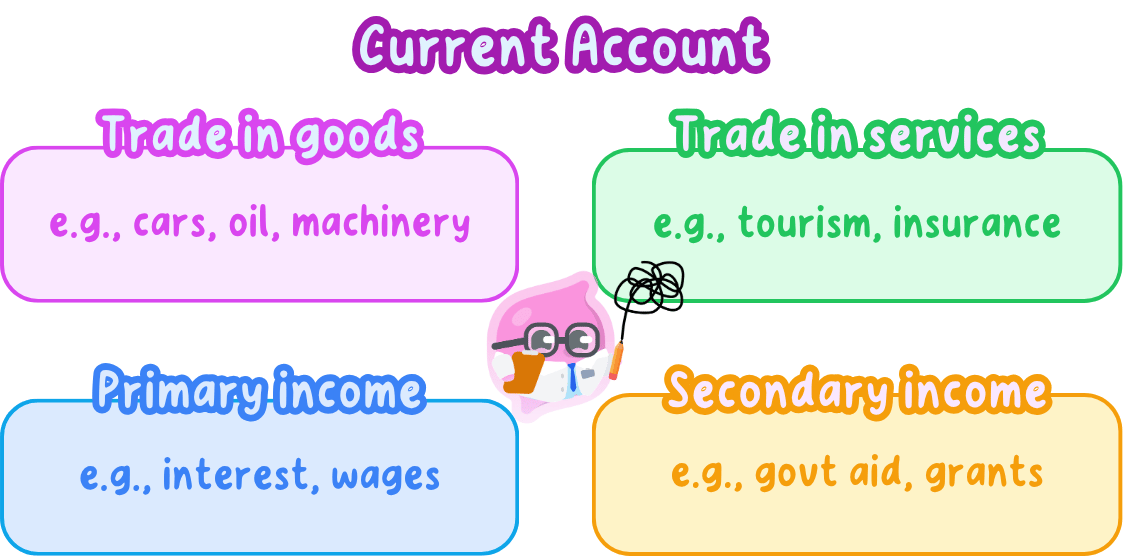
- Trade in goods is usually the largest component for a manufacturing economy: money changes hands whenever cars, oil, machinery or food cross the border, whether coming in as an import or going out as an export.
- Trade in services covers money earned or spent on invisible products, such as a UK bank charging fees to an overseas client, or a British tourist paying for a hotel room abroad.
- Primary income flows from owning assets or working abroad, such as the dividends a UK shareholder receives from a foreign company, or the wages earned by a UK resident working temporarily overseas.
- Secondary income covers transfers with nothing given in return, such as UK government aid paid to another country, or money a foreign worker living in the UK sends home to their family.
- Adding the four parts together gives the current account balance for that period.
Goods are visible trade and services are invisible
- Trade in goods is often called visible trade because the physical products can be seen crossing the border.
- Trade in services is often called invisible trade because no physical item moves, even though money still changes hands.
Balance of trade: the difference between the value of a country's exports and imports of goods and services, not including primary and secondary income.
- The balance of trade only covers goods and services; the current account balance additionally includes primary and secondary income.
- A foreign tourist staying in a UK hotel is an export of services, even though nothing physical crosses the border.
- Money a worker abroad sends home is secondary income, not trade, because no product is bought in return for it.
The current account balance compares inflows with outflows
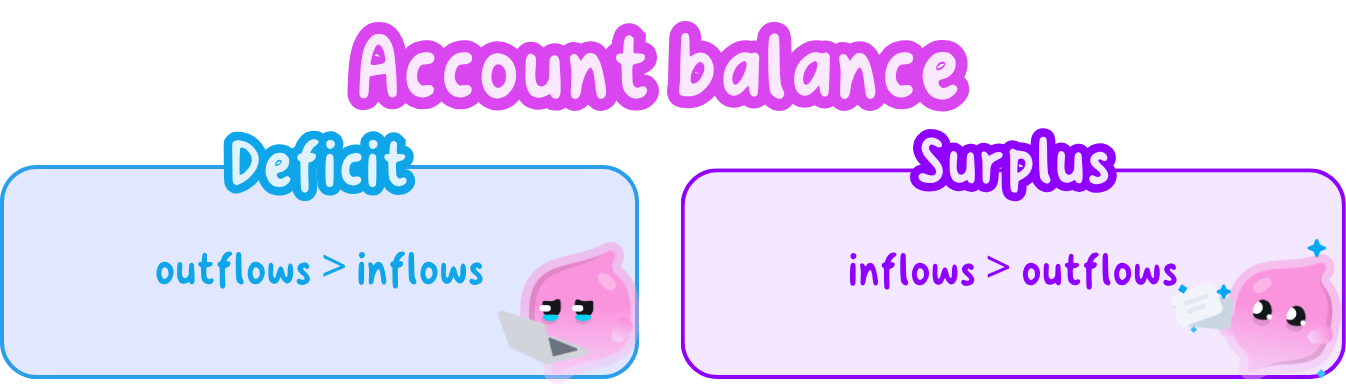
- The current account balance for a period is total inflows minus total outflows.
- A positive balance is called a surplus; a negative balance is called a deficit; their fuller meaning is covered in 2.2.5b.
- The balance is often shown as a percentage of GDP so that economies of different sizes can be compared fairly.
Adding the four parts gives the overall balance
- The overall current account balance is found by adding the balances of all four parts together.
Step 1: write down the balance of trade in goods (a deficit) and trade in services (a surplus):
Trade in goods=−£59.5bn \text{Trade in goods} = -\pounds 59.5\text{bn} Trade in goods=−£59.5bn Trade in services=+£51.8bn \text{Trade in services} = +\pounds 51.8\text{bn} Trade in services=+£51.8bnStep 2: add these two together to find the balance of trade:
Balance of trade=−59.5+51.8=−£7.7bn \text{Balance of trade} = -59.5 + 51.8 = -\pounds 7.7\text{bn} Balance of trade=−59.5+51.8=−£7.7bnStep 3: add the net primary and secondary income to find the current account balance:
Primary and secondary income (net)=−£7.4bn \text{Primary and secondary income (net)} = -\pounds 7.4\text{bn} Primary and secondary income (net)=−£7.4bn Current account balance=−7.7+(−7.4)=−£15.1bn \text{Current account balance} = -7.7 + (-7.4) = -\pounds 15.1\text{bn} Current account balance=−7.7+(−7.4)=−£15.1bn- This matches the UK's actual current account deficit of £15.1bn (1.9 per cent of GDP) in the first quarter of 2026: a goods deficit only partly offset by a services surplus, with a net income outflow adding to the shortfall.
- Show your working as a sum of signed figures, not just the final total, and label each part of the sum.
- Keep the correct sign throughout, since dropping a minus sign turns a deficit into a surplus in your answer.
- Where a question gives a percentage of GDP, use it to judge the scale of the balance, not just its direction.
- Name the four parts that make up the current account.
- Explain the difference between the balance of trade and the current account balance.
- State whether a positive current account balance is called a surplus or a deficit.
- Calculate the current account balance given the balance of trade and net income and transfers.
- Explain why a service can count as trade even though nothing physical crosses a border.
2.2.5b Current account surpluses and deficits
Surplus and deficit describe opposite imbalances
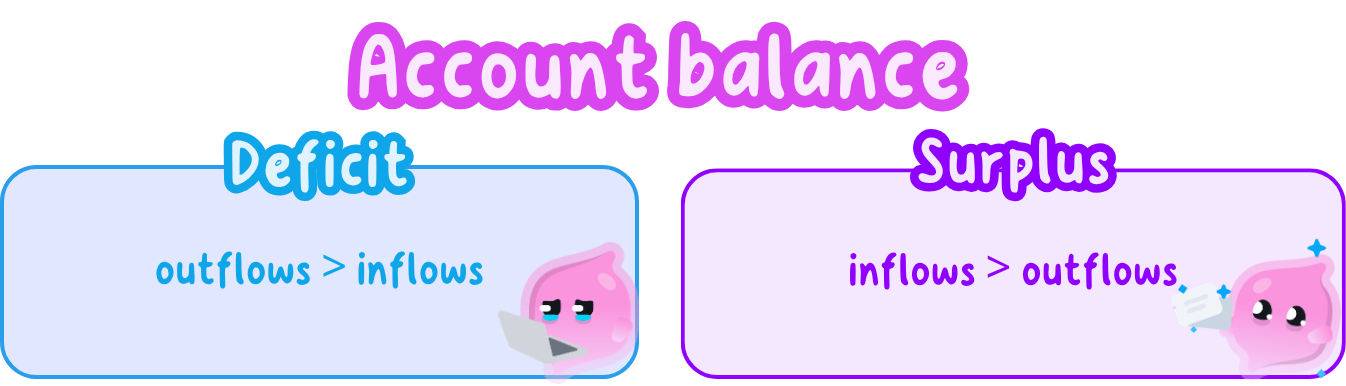
Surplus: a current account position where total inflows are greater than total outflows, so the balance is positive.
Deficit: a current account position where total outflows are greater than total inflows, so the balance is negative.
- A surplus arises when inflows exceed outflows: a country that earns £600bn from foreigners and pays out £550bn to foreigners has inflows above outflows, so it runs a surplus.
- A deficit arises when outflows exceed inflows: a country that pays out more than it earns over the same period runs a deficit.
A balanced position means inflows exactly equal outflows
Balanced: a current account position where inflows and outflows are equal, so the balance is exactly zero.
A balanced position is rare in practice, since a country's inflows and outflows so rarely land on exactly the same figure.
The causes of an imbalance work through trade
- A deficit or surplus depends on the value of what a country sells abroad compared with the value of what it buys.
- Relative prices and costs: matter, because if a country's goods become dearer than rivals' goods, exports fall and imports rise.
- Quality and competitiveness: matter, because poor design, reliability or service makes goods harder to sell abroad and easier for rivals to beat at home.
- The exchange rate: matters, because a strong currency makes exports dearer and imports cheaper, while a weak currency does the opposite; exchange rates are covered fully in 2.4.2.
- Relative growth and incomes: matter, because a country that grows faster or has higher incomes than its trading partners tends to buy more imports.
- If a country's wages and costs rise faster than its rivals', its exports become dearer and it can slide towards deficit.
- A country with cheap, high quality exports and a competitive currency tends to run a surplus.
Faster growth than partners tends to widen a deficit
- When incomes rise, households spend more, and part of that extra spending goes on imported goods and holidays abroad.
- If a country grows faster than its trading partners, its demand for imports rises faster than their demand for its exports.
- A persistent imbalance usually comes from a lasting problem, such as weak competitiveness or a currency that stays too strong for too long.
- A deficit is not caused only by consumers spending too much, because competitiveness and the exchange rate matter just as much.
- A surplus is not proof of hard work, since it can simply reflect a weak currency or weak domestic demand.
A deficit or surplus changes demand in the economy
- Spending on imports is money leaving the economy, so a deficit is a net leakage of demand.
- Earnings from exports are money entering the economy, so a surplus is a net injection of demand.
- This is why a large, persistent imbalance can affect output, jobs, prices and the currency.
The main consequences of a persistent deficit
- Slower growth and fewer jobs: can follow, because a net leakage of demand reduces spending on domestic output.
- A financing need: arises, because a deficit must be paid for by borrowing from abroad or selling assets to foreigners.
- Downward pressure on the currency: can build up, because a persistent deficit means more of the currency is being sold to buy imports.
- If a weaker currency then raises the price of imports, it can add to inflation.
- A short deficit while a country invests in new machinery may pay off later, so timing matters.
A surplus brings benefits but is not always good
- A surplus adds to demand and can support output and jobs in export industries.
- A very large surplus can point to weak spending at home, or add to inflation if the extra demand is strong.
- A large surplus can also cause tension with trading partners who are running deficits.
Whether a deficit matters depends on several factors
- It depends on the size of the deficit relative to GDP, because a small deficit is easy to finance, while a large, persistent one signals a deeper problem.
- It depends on what is causing it, because a deficit caused by importing machinery to invest for the future may pay off later, while one caused by weak competitiveness can persist and worsen.
- It depends on how it is financed, because a deficit financed by stable, long-term investment is less risky than one financed by short-term borrowing that could be withdrawn quickly.
- It depends on how long it lasts, because a temporary deficit during one strong year of investment is less concerning than one that persists year after year.
A deficit is not automatically a problem: what matters is its size, its cause, how it is financed and whether it persists, not simply the fact that a minus sign appears in front of the figure.
- Define a current account surplus, deficit and balanced position.
- Give three causes of a current account imbalance.
- Explain why a strong currency tends to widen a deficit.
- Explain why a deficit is a leakage and a surplus is an injection.
- Explain why a large deficit is not automatically a serious problem.
2.2.5c Policies to influence the balance of payments
Governments can act on demand, trade or competitiveness
- To correct a deficit a government can try to reduce total spending, switch spending away from imports, or make its firms more competitive.
- The aim is to bring inflows and outflows closer together so the balance is more stable.
- Some measures work quickly on demand, while others work slowly by improving the supply side of the economy.
- Reducing spending lowers imports because people buy less of everything, including imports.
- Switching spending changes what people buy, steering them towards home-produced goods instead.
Expenditure-reducing policy cuts total demand in the economy
Expenditure-reducing policy: a policy that cuts total demand in the economy, through higher taxes, lower government spending or higher interest rates, so as to reduce spending on imports.
- Expenditure-reducing policy lowers growth and can raise unemployment, because it cuts demand across the whole economy, not just spending on imports.
- This also often leads the general price level to fall.
Expenditure-switching policy shifts spending towards home producers
Expenditure-switching policy: a policy that makes imports dearer or exports cheaper, using tariffs, quotas or a lower exchange rate, to switch spending towards home-produced goods.
- Expenditure-switching policy can raise the price of imports, which adds to the cost of living, and a lower exchange rate is covered fully in 2.4.2.
Tariffs and quotas are the main protectionist tools
- Tariff: a tax on imports; it raises the price shoppers pay, so some switch to home-produced substitutes, imports fall and the current account improves, and it also raises government revenue.
- Quota: a limit on the quantity that may be imported; it caps supply directly, so home producers fill the gap and the price often rises too, but unlike a tariff it raises no government revenue.
- The catch: other countries can retaliate, cutting UK exports, and the UK's trade agreements limit what it can impose; both tools are covered in full in 2.4.3a.
- A tariff on imported cars raises their price, so buyers switch towards cars made at home.
- Spending on training and infrastructure can lower firms' costs and make their exports easier to sell.
Supply-side policy raises long-term competitiveness and quality
Supply-side policy: a policy that raises productivity, quality and skills so exports become more competitive over the long term.
- Supply-side measures are usually slow to work and can be costly for the government to fund.
- The mechanism: supply-side policy targets producers' competitiveness rather than demand, so better quality, lower costs and higher productivity make UK goods easier to sell abroad and home substitutes more attractive than imports.
Two routes build long-run competitiveness
- Investment in skills and infrastructure: education, training and research and development raise workers' productivity and lower firms' costs.
- Lower taxes on profits: this encourages firms to invest in both areas.
- The limitation: these routes work slowly, over years not months, so they do nothing for this year's deficit and cost money upfront; covered in full in 2.3.3a and 2.3.3b.
- Protection is not a free fix, because trading partners can hit back with tariffs of their own.
- A lower exchange rate helps the balance but makes imports dearer, so it can raise living costs at home.
Choosing a policy means weighing cause against cost
- It depends on what is causing the deficit, because a demand-driven deficit responds well to expenditure-reducing policy, while a competitiveness problem needs supply-side reform instead.
- It depends on the impact on growth and jobs, because expenditure-reducing policy can correct the balance but slow the whole economy and raise unemployment.
- It depends on how trading partners react, because tariffs and other protectionist measures can invite retaliation that leaves both countries worse off.
- It depends on how quickly a result is needed, because supply-side measures can work well but take years, while demand-side measures act faster at a higher immediate cost.
There is no single best policy: the right choice matches the cause of the imbalance and accepts a trade-off between fixing the balance quickly and protecting growth, jobs and prices.
- Explain the difference between expenditure-reducing and expenditure-switching policies.
- Give one supply-side measure that improves competitiveness.
- Explain why a tariff raises revenue for the government but a quota does not.
- Explain why expenditure-reducing policy can cost jobs even as it corrects the balance.
- Explain why the best policy depends on the cause of the imbalance.
2.2.6a Income and wealth inequality in the UK
Income is a flow; wealth is a stock
Income: the money a person or household receives over a period of time, such as each week, month or year.
Wealth: the total value of the assets a person owns at a single point in time, minus any debts they owe.
- The main sources of income are wages and salaries from work, interest on savings, rent from property and benefits paid by the government.
- Common forms of wealth include a home, savings, shares and a pension fund.
- A person can have a high income but little wealth if they spend most of what they earn, such as a young footballer early in a well-paid career.
- A person can have a low income but high wealth, such as a retired homeowner living off savings.
- Income is a flow measured over time; wealth is a stock measured at one moment.
- Do not treat a high earner and a wealthy person as the same thing.
- Saving is the bridge between the two: income that is not spent adds to wealth.
Inequality means income and wealth are shared unevenly
Inequality: when income or wealth is spread unevenly across the population.
Distribution: how a total amount of income or wealth is divided up between different households.
- Income inequality compares how the flow of earnings is divided, while wealth inequality compares how ownership of assets is divided.
- Some inequality exists in every economy, because people differ in their jobs, savings and stage of life.
You can describe the gap using shares and quintiles
Quintile: one of five equal-sized groups a population is split into, ranked from poorest to richest.
- Economists split households into quintiles and compare the share of total income or wealth held by each group.
- The mean (average) can be pulled up by a few very high figures, so the median (middle value) often describes the typical household better.
- When reading a distribution table, check whether the figures show income or wealth, and compare the top group's share against the bottom group's share to judge how uneven the spread is.
ONS data shows the size of the UK gap
Gini coefficient: a single measure of inequality, expressed as a percentage from 0% (everyone has an equal income) to 100% (one person has all the income). A higher figure means more inequality.
Disposable income: income left after direct taxes have been deducted and any state benefits added, which is what a household actually has available to spend or save.
- In the financial year ending (FYE) 2024 (April 2023 to March 2024), the UK's Gini coefficient for disposable income was 32.9%, according to the Office for National Statistics (ONS).
- This was down slightly from 33.1% in FYE 2023, though the change was not large enough to be statistically significant.
- Median household disposable income in the UK was £36,700 a year in FYE 2024, up 0.8% on FYE 2023 and back in line with pre-pandemic (FYE 2020) levels.
- Both figures describe the distribution of income, not wealth: the ONS does not publish an equivalent Gini coefficient for wealth in this dataset.
The quintile ratio shows the richest to poorest gap
Quintile ratio: (also called the S80/S20 ratio) compares the total disposable income of the richest fifth of households with that of the poorest fifth.
- In FYE 2024, the UK's quintile ratio was 5.6, meaning the richest fifth of households had around 5.6 times the disposable income of the poorest fifth, according to the ONS.
- Suppose, for illustration, that a survey finds the poorest fifth of households has a mean disposable income of £15,000 a year. The quintile ratio can be used to estimate the richest fifth's mean income.
Step 1:
top quintile income=ratio×bottom quintile income \text{top quintile income} = \text{ratio} \times \text{bottom quintile income} top quintile income=ratio×bottom quintile incomeStep 2:
top quintile income=5.6×£15,000 \text{top quintile income} = 5.6 \times \pounds15{,}000 top quintile income=5.6×£15,000Step 3:
top quintile income=£84,000 \text{top quintile income} = \pounds84{,}000 top quintile income=£84,000Quintile ratios help compare inequality over time
- On these illustrative figures, the richest fifth's mean income would be about £84,000 a year, roughly £69,000 more than the poorest fifth.
- When a question asks you to find a group's income from a ratio, multiply the ratio by the income of the group you are given, rather than dividing.
- State clearly whether a figure is a ratio, a percentage or a cash amount, since these measures answer different questions about inequality.
- For a describe question, explain what the number means, such as the richest fifth having several times the income of the poorest fifth, rather than just restating the figure.
- What is the difference between income and wealth? Give one example of each.
- Why might a person have a high income but low wealth, or a low income but high wealth?
- What does a higher Gini coefficient tell you about a country's income distribution?
- Why is the median often a better guide to a typical household's income than the mean?
- What does a quintile ratio of 5.6 tell you about the gap between the richest and poorest fifths of households?
2.2.6b Causes and consequences of inequality
Differences in skills and wages widen income gaps
- Wage differences: are a major cause of income inequality, because some jobs pay far more than others.
- Education and skills: raise earning power, so a more qualified worker can usually command a higher wage.
- Workers with few qualifications are often stuck in low-paid jobs, which widens the income gap.
- Bargaining power: matters too, as workers in short supply, or represented by a strong trade union, can push wages up.
- An NHS consultant, after years of training, earns far more than an entry-level care worker.
- When a skill is in short supply, such as specialist software engineering, employers bid wages up to attract it.
Employment status affects who earns an income
- Unemployment: removes earnings from work, so households relying on benefits usually have low incomes.
- Insecure or part-time work: provides fewer hours and lower pay than a full-time job.
- People who cannot find full-time work, or who work only a few hours, fall further behind full-time earners.
Region and discrimination also widen the gaps
- Region: average pay and job opportunities are not the same across the UK; ONS figures consistently show household incomes are higher in London and the South East than in the North East and Wales.
- Discrimination: occurs when people are paid or treated differently because of their gender, ethnicity or disability rather than their skills or productivity.
- The ONS's annual gender pay gap statistics are a real, ongoing example of how discrimination and occupational differences can leave one group earning less on average than another for broadly similar work.
- Inequality is not simply the result of some people not trying hard enough.
- It also comes from differences in wages, skills, asset ownership, inheritance, region and discrimination that an individual cannot always control.
The causes reinforce one another over time
- Low wages make it hard to save, so little wealth builds up.
- Without wealth there is nothing to inherit, so the gap can pass to the next generation.
- Because these causes feed into each other, inequality can persist unless something breaks the cycle.
- An NHS consultant, after years of training, earns far more than an entry-level care worker.
- When a skill is in short supply, such as specialist software engineering, employers bid wages up to attract it.
Owning assets and inheritance widen wealth gaps
- Ownership of assets: creates wealth inequality, because those who own homes, shares or businesses earn rent, dividends and rising asset values.
- People who already have wealth can save and invest more, so their wealth grows faster.
- Inheritance: passes wealth from one generation to the next, giving some families a head start.
- Those who inherit property or money can buy assets early in life, while others start with nothing.
- Wealth tends to create more wealth, because assets earn returns that can be reinvested.
- This is why wealth gaps can widen even between people who earn similar wages.
Inequality can harm living standards and society
Social mobility: how easily a person can move to a different income or wealth group from the one they were born into.
- Inequality can leave those at the bottom in poverty, unable to afford a decent standard of living.
- Poorer households often have worse health and education, because they cannot afford good food, housing or extra support.
- Large gaps can reduce social mobility, making it harder for children from poor families to move up.
- Very wide gaps can create social tension and resentment between groups.
- In areas with high inequality, poorer children often attend worse-resourced schools, which limits their chances.
- This can trap talented people in low-paid work, which is a loss to them and to the economy.
Wide inequality can weaken the economy
- Poorer households spend a larger share of any income, so weak incomes at the bottom can reduce total spending in the economy.
- Wasted potential lowers productivity, as skills go undeveloped when people cannot afford training.
- Governments may have to spend more on benefits and public services to support low-income households.
- Money given to low-income households is usually spent quickly, which supports demand and jobs.
- So reducing extreme inequality can, in some cases, help the wider economy.
Some inequality can create useful incentives
- Some inequality can act as an incentive, rewarding effort, skill and risk-taking.
- The chance to earn more encourages people to gain skills, work hard and take on responsibility.
- The prospect of higher rewards encourages enterprise, as people start businesses hoping to succeed.
- Higher earners can save and invest, which may help fund investment and growth.
- Do not treat inequality and poverty as the same thing: inequality is about the gap between groups, while poverty is about being unable to afford basic needs.
- Some inequality can exist without anyone being in poverty.
Whether inequality helps or harms depends on degree
- It depends on how large the gap is, because a little inequality can motivate effort, while an extreme gap tends to cause more harm than good.
- It depends on social mobility, because if people born into poorer households can realistically move up, the same size of gap causes less lasting harm.
- It depends on what higher earners do with their money, because savings and investment by high earners only benefit growth if that money is actually invested, rather than left idle.
- On balance, a moderate degree of inequality can reward effort without much cost, but very wide and persistent gaps usually do more economic and social harm than good.
- For an evaluate question on inequality, weigh the harms, such as poorer health and lower social mobility, against the argument that some inequality rewards effort and enterprise.
- Reach a supported judgement rather than sitting on the fence, for example by linking the size of the gap and the level of social mobility to your conclusion.
- Avoid the common trap of listing causes without developing them: explain how each cause leads to a wider gap, rather than just naming it.
- Give three causes of income or wealth inequality.
- Explain how inheritance can widen wealth inequality.
- Give two ways in which inequality can harm the economy.
- Explain one way in which some inequality might be beneficial.
- Why does the effect of inequality on society depend on social mobility?
2.2.6c Redistributing income and wealth
Redistribution moves resources from richer to poorer households
Redistribution: the government moving income or wealth from richer households to poorer ones, mainly through taxation and government spending.
- Redistribution does not make everyone equal; it narrows the gap between rich and poor.
- It relies on the government collecting tax and then paying out support.
Progressive taxation takes more from higher earners
- Income tax: a progressive tax, charged in bands, so higher slices of income are taxed at higher rates.
- For the 2026/27 tax year, the first £12,570 of income (the Personal Allowance) is tax-free.
- Income from £12,571 to £50,270 is taxed at the basic rate of 20%.
- Income from £50,271 to £125,140 is taxed at the higher rate of 40%.
- Income over £125,140 is taxed at the additional rate of 45%.
- Taxes on wealth, such as inheritance tax, take a share of large estates when they are passed on.
- Because higher earners pay a higher percentage, not just a higher amount, this means those most able to pay contribute the most.
- Worked example: a worker earns £30,000 a year in 2026/27. How much income tax do they pay?
Step 1:
taxable income=£30,000−£12,570=£17,430 \text{taxable income} = \pounds30{,}000 - \pounds12{,}570 = \pounds17{,}430 taxable income=£30,000−£12,570=£17,430Step 2:
income tax=20 per cent×£17,430 \text{income tax} = 20\text{ per cent} \times \pounds17{,}430 income tax=20 per cent×£17,430Step 3:
income tax=£3,486 \text{income tax} = \pounds3{,}486 income tax=£3,486- Only the £17,430 above the Personal Allowance is taxed, all of it at the basic rate, since none of it reaches the higher-rate band.
Benefits and transfer payments support low-income households
- Benefits: such as Universal Credit and Child Benefit are cash transfer payments, meaning payments made with no good or service given directly in return, to households on low incomes.
- Some benefits are means-tested, going only to those below a certain income, while others such as the State Pension are paid more widely.
- A worker who loses their job may claim Universal Credit while looking for a new one.
- A retired person with little other income relies on the State Pension as their main income.
State provision of education and healthcare narrows gaps
- State provision: giving services free or cheaply at the point of use, such as NHS healthcare and state education.
- These services are worth more to poorer households as a share of their income, since a family on a low income could not otherwise easily afford them.
- Providing free state schooling and free NHS treatment is a form of redistribution in kind, rather than in cash.
- Free state schooling saves a low-income family the cost of educating their children.
- Free NHS treatment means a low-income patient is not deterred from seeking care by cost.
How far redistribution helps depends on its design
- It depends on how high marginal tax rates are set, because very high rates on extra earnings can reduce the incentive to work longer hours or take a promotion.
- It depends on how well targeted benefits are, because means-tested support reaches low-income households efficiently, while poorly designed schemes can be wasteful or blunt the incentive to find work.
- It depends on the value of in-kind support, because free healthcare and education raise living standards for low-income households even in years when cash benefits are not increased by much.
- Redistribution through tax and spending narrows inequality most effectively when it is well targeted and does not remove the reward for work.
- For an evaluate question on redistribution, name a specific policy, such as progressive taxation, benefits or state provision, so your analysis is concrete rather than general.
- Set the benefit, such as lower poverty or a narrower income gap, against the specific cost, such as a weaker incentive to work, before you give a judgement.
- Avoid the common trap of assuming every redistribution policy always works: its success depends on how well it is designed and targeted.
- What is meant by redistribution?
- Using the 2026/27 income tax bands, explain why income tax is a progressive tax.
- Give one example of a transfer payment and one example of state provision.
- Explain why free state education and NHS healthcare count as redistribution in kind rather than in cash.
- Explain one reason why a very high marginal tax rate could reduce the incentive to work.
