GDP measures the value of what a country produces
Definition
Gross Domestic Product (GDP): the total value of all goods and services produced within a country in a given period, usually a year, added up using current prices.
- Because output is hard to add up in units, GDP adds it up in money terms, using the prices of the goods and services.
- A rising GDP suggests the economy is producing more, so GDP is the main measure used to track economic growth.
- GDP counts production inside the country's borders, whoever owns the firms.
Note
- GDP is a flow, measured over a period of time such as a quarter (three months) or a year.
- It is usually reported as a total figure, for example in billions of pounds.
Real GDP strips out the effect of rising prices
Definition
Nominal GDP: GDP measured using the prices of goods and services in the current year.
Real GDP: GDP measured using prices from a fixed base year, so it removes the effect of price changes.
- If prices rise, nominal GDP can go up even when the actual quantity produced has not changed.
- Because it ignores price rises, real GDP is the figure used to judge genuine economic growth.
Common Mistake
- A rise in nominal GDP does not always mean more has been produced; it may just mean prices have risen.
- Always use real GDP to judge whether output has truly grown.
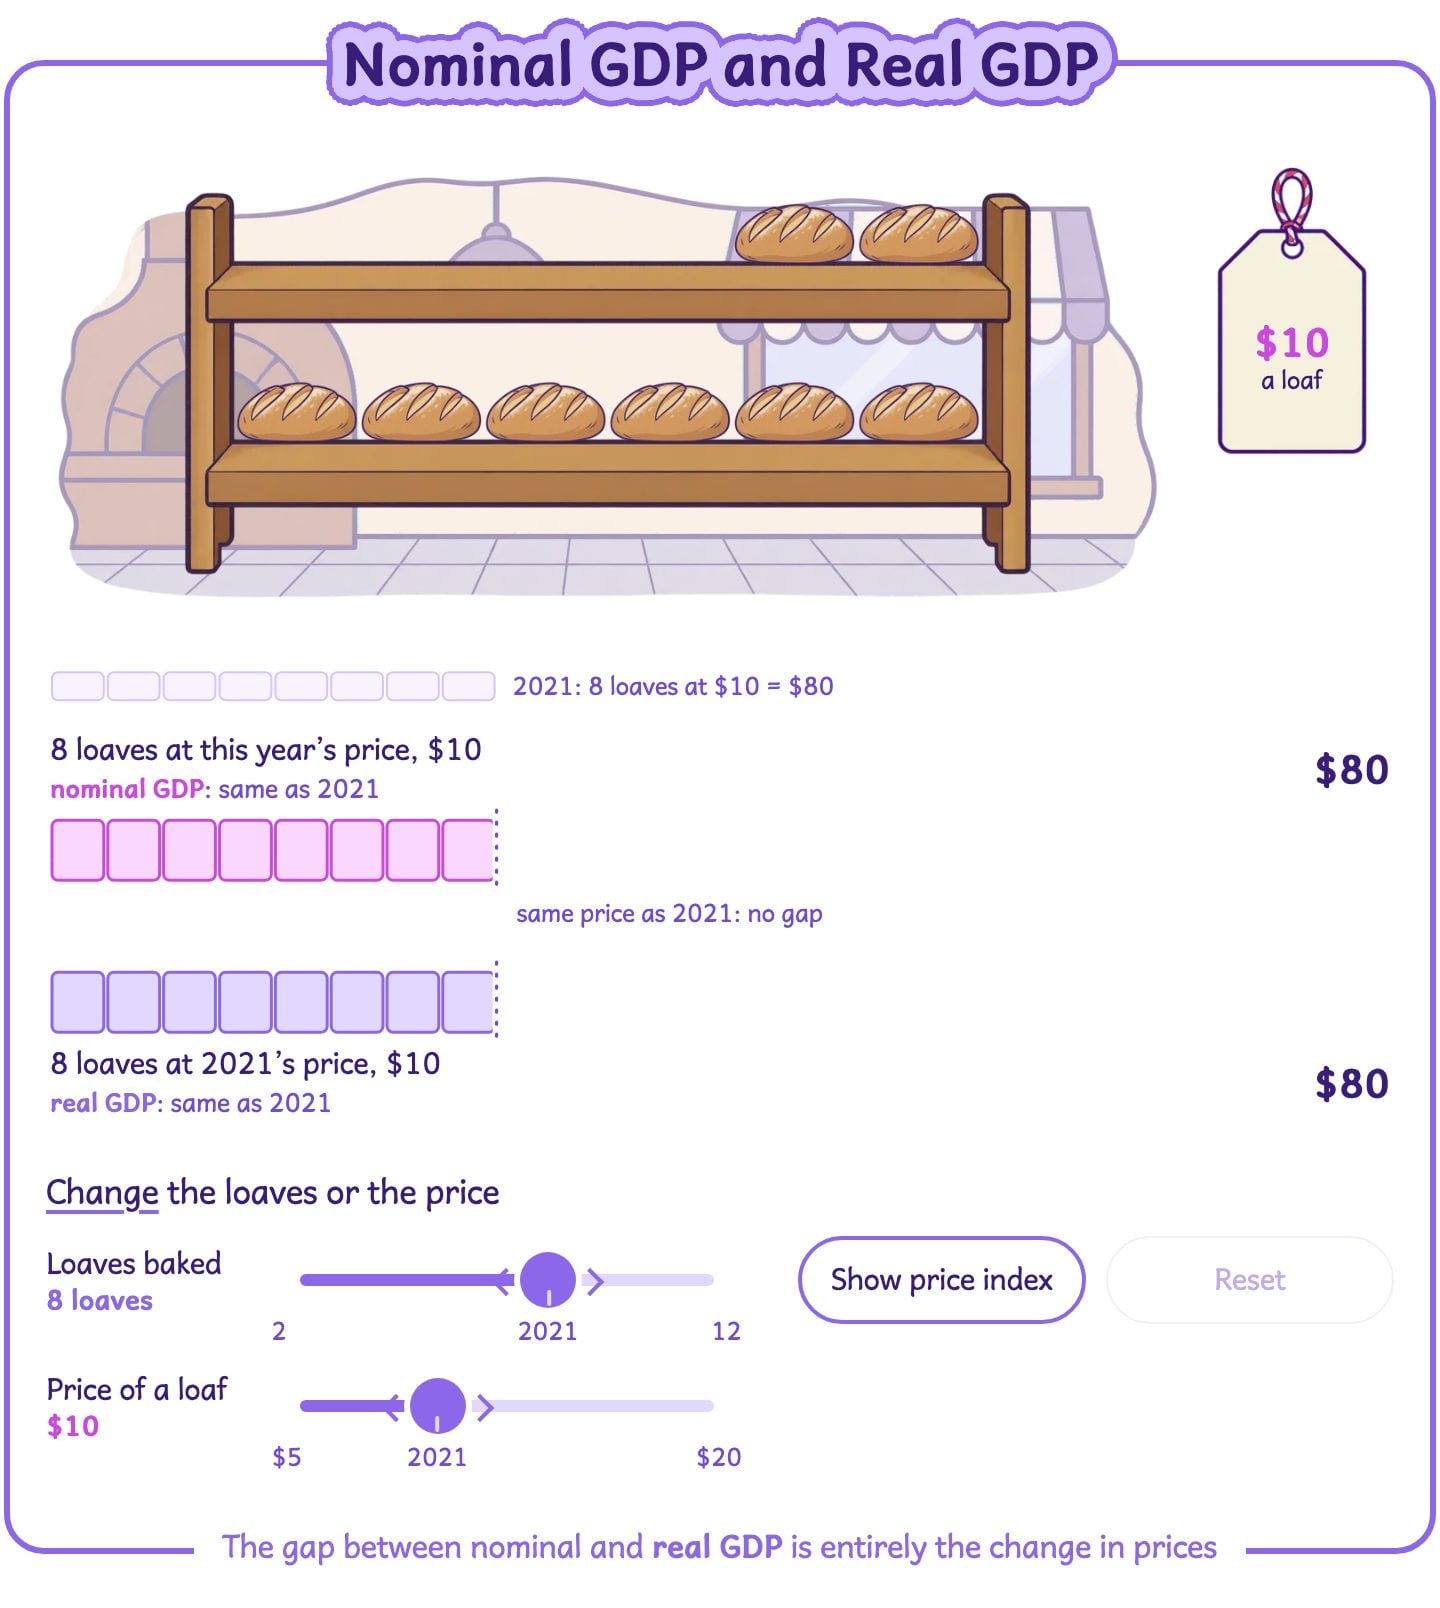
Change the price level and notice that real GDP removes the price rises that inflate nominal GDP.
Converting nominal GDP to real GDP removes price rises
- To convert nominal GDP into real GDP, divide nominal GDP by the price index for that year, expressed as a fraction of 100.
- The formula is:
Example
- A worked example economy has nominal GDP of £2,142bn in the current year, when the price index is 105 (base year = 100).
- So although nominal GDP was £2,142bn, once the 5 per cent rise in prices is removed, real GDP is only £2,040bn.
- The £2,142bn nominal GDP and price index of 105 here are invented figures chosen to make the method clear. They are not the UK's real GDP.
- In an exam, never invent a UK total. Use an official published figure, such as a growth rate given elsewhere in this article, or describe the direction and scale of change in words.
GDP per capita shows output for each person
Definition
GDP per capita: a country's GDP divided by its population, showing the average value of output, and roughly income, per person.
- GDP per capita is useful for comparing countries of different population sizes.
- A large country can have a high total GDP but a low GDP per capita if its population is very large.
Note
- When comparing living standards between countries, GDP per capita is usually more useful than total GDP.
- It answers the question how much output there is for each person, rather than how big the economy is.
GDP per capita is GDP divided by population
GDP per capita=GDP÷population \text{GDP per capita} = \text{GDP} \div \text{population} GDP per capita=GDP÷population- Keep the units consistent on the top and bottom of the division, for example pounds and people.
Example
- Using the invented real GDP of £2,040bn from the worked example above, and a made-up population of 34 million:
- So on average, each person in this invented example economy has £60,000 of output available to them, a result of the method, not a real UK figure.
The growth rate is real GDP's percentage change
- Economic growth is worked out as the percentage change in real GDP from one year to the next.
- Using real GDP means the result shows a true change in output, not just a change in prices.
Example
- Suppose, for a made-up economy (not the UK's actual GDP level), real GDP rises from £2,000bn to £2,024bn in one year.
Step 1: find the change:
£2,024bn−£2,000bn=£24bn \pounds2{,}024\text{bn} - \pounds2{,}000\text{bn} = \pounds24\text{bn} £2,024bn−£2,000bn=£24bnStep 2: divide by the original value and multiply by 100:
Growth rate=242,000×100=1.2 per cent \text{Growth rate} = \dfrac{24}{2{,}000} \times 100 = 1.2\text{ per cent} Growth rate=2,00024×100=1.2 per cent- This invented economy happens to give the same rate as the UK's real annual real GDP growth of 1.2 per cent in the year to Q2 2026, April to June 2026, but the £2,000bn and £2,024bn starting figures are not the UK's real GDP (Source: ONS, GDP first quarterly estimate, UK: April to June 2026).
A falling real GDP gives a negative growth rate
- If real GDP falls, the percentage change is negative, showing the economy has shrunk.
- For example, continuing the invented figures above, if real GDP fell from £2,040bn to £2,020bn, the change is about:
Note
A negative growth rate means output is lower than the year before.
Common Mistake
- Always divide the change by the starting value, not the final value.
- Using the wrong base gives a slightly wrong growth rate.
Always finish by saying what the number means
- A calculated figure is only useful once it is interpreted.
- A growth rate of 1.2 per cent means real output, and roughly average incomes, rose by that much over the year.
- A rise in GDP per capita suggests the average person has more goods and services available than before.
- Ending with an interpretation sentence turns a calculation into an economic conclusion.
Exam technique
- State whether a figure is real or nominal GDP, and whether the question asks for GDP, GDP per capita or the growth rate, since each answers a different question.
- Show your working line by line and substitute the numbers into the formula before you calculate, since a clear method still shows you understand it even if the final figure ends up wrong.
- Attach the correct unit to your final answer: a percentage for a growth rate, and pounds per person for GDP per capita.
Self review
- What does GDP measure, and what is the difference between real and nominal GDP?
- How is GDP per capita calculated and what does it show?
- Real GDP rises from £500bn to £515bn. Calculate the growth rate.
- Why must you always divide by the original value, not the final value, when finding a growth rate?
- A country's nominal GDP rises but its price index rises by the same percentage. What happens to real GDP?