Question 5
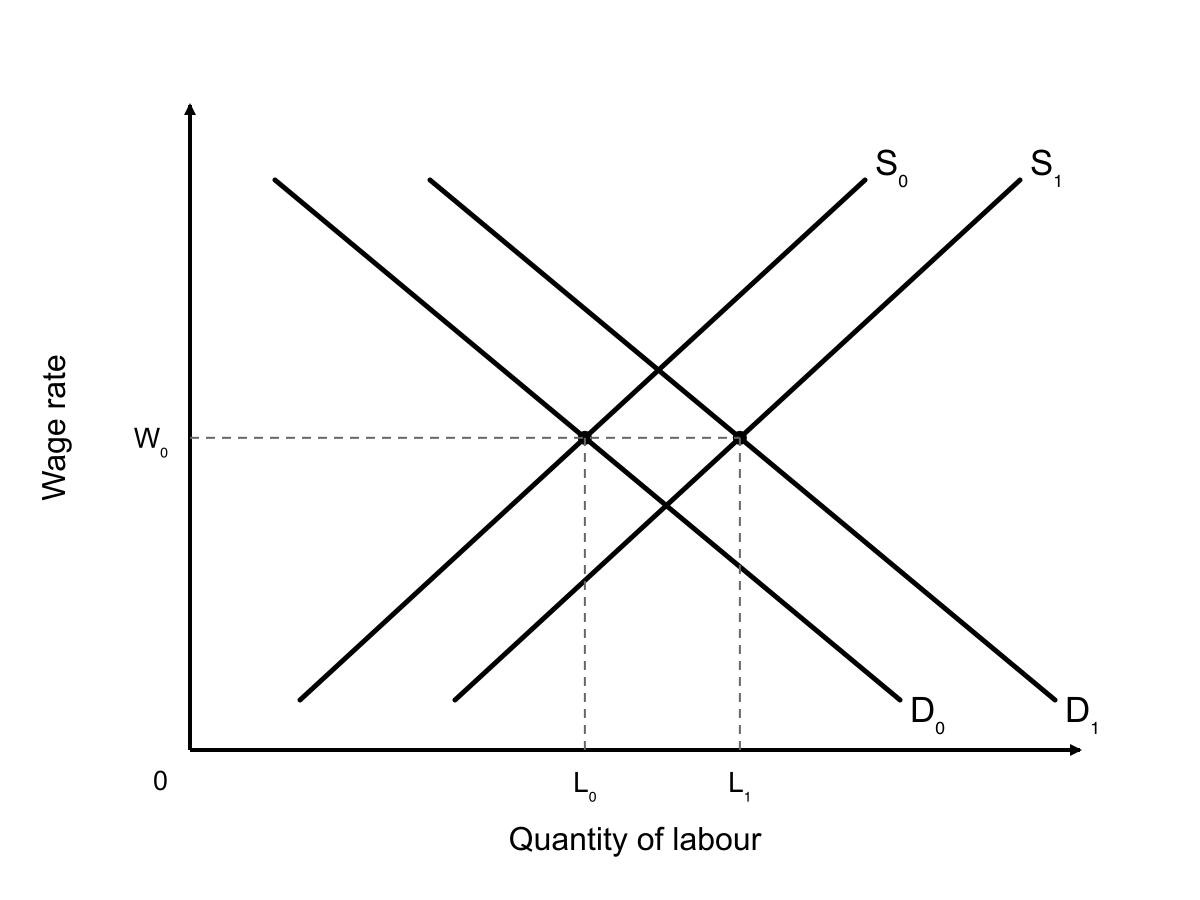 Demand for labour and supply of labour both shift right by the amounts shown. Which conclusion is supported by the diagram?
Both the equilibrium wage and employment remain unchanged
The equilibrium wage falls and employment remains at L₀
The equilibrium wage remains at W₀, while equilibrium employment rises from L₀ to L₁
The equilibrium wage rises and employment falls
1.5 Competitive and concentrated markets Questions
149 exam-style questions on AQA GCSE Economics 1.5 Competitive and concentrated markets, covering 1.5.1a The range of market structures, 1.5.1b Distinguishing between market structures, 1.5.2a Characteristics of a competitive market, 1.5.2b How producers operate in competitive markets, 1.5.2c The economic impact of competition, 1.5.3a Characteristics of a non-competitive market, 1.5.3b How producers operate in non-competitive markets, 1.5.3c Monopoly and oligopoly, 1.5.4a The labour market and wage determination, and 1.5.4b Gross and net pay. Each one has a worked solution and a mark scheme showing where the marks go.