Question 10
FA pure solid is heated steadily. The graph shows how its temperature changes. The diagram shows the particles in the sample at one moment during the heating.
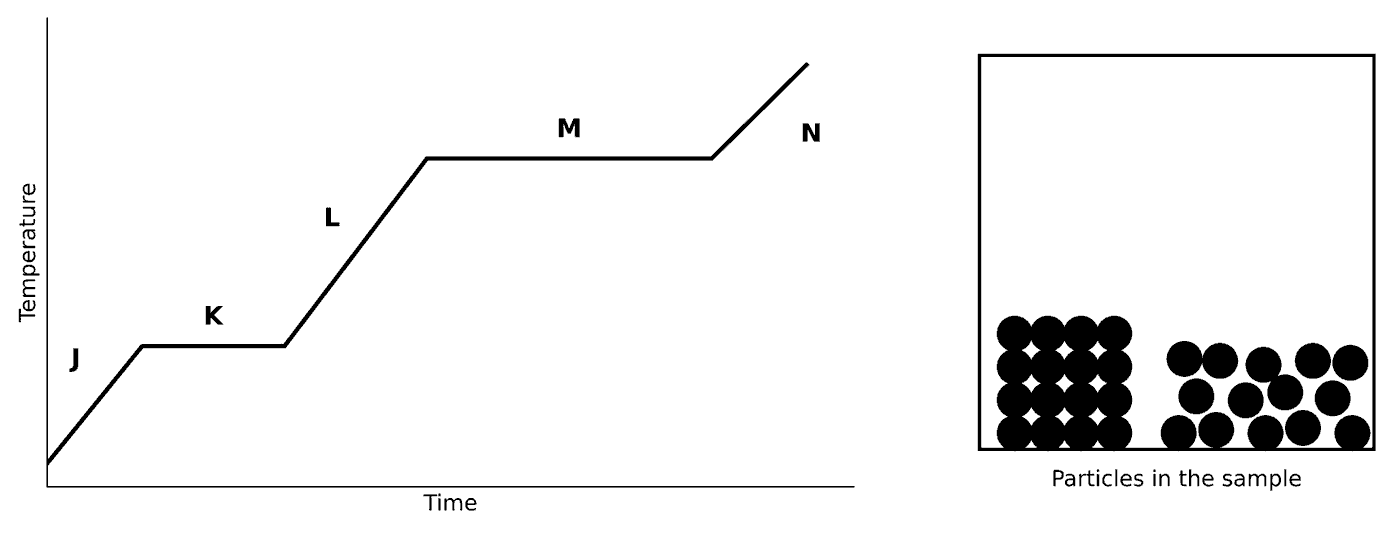
In which section of the graph was the diagram drawn?
Section J
Section K
Section L
Section M
1.1 The particle model Questions
48 exam-style questions on OCR GCSE Chemistry 1.1 The particle model, covering 1.1.1 The particle model and changes of state and 1.1.2 Limitations of the particle model. Each one has a worked solution and a mark scheme showing where the marks go.