Question 6
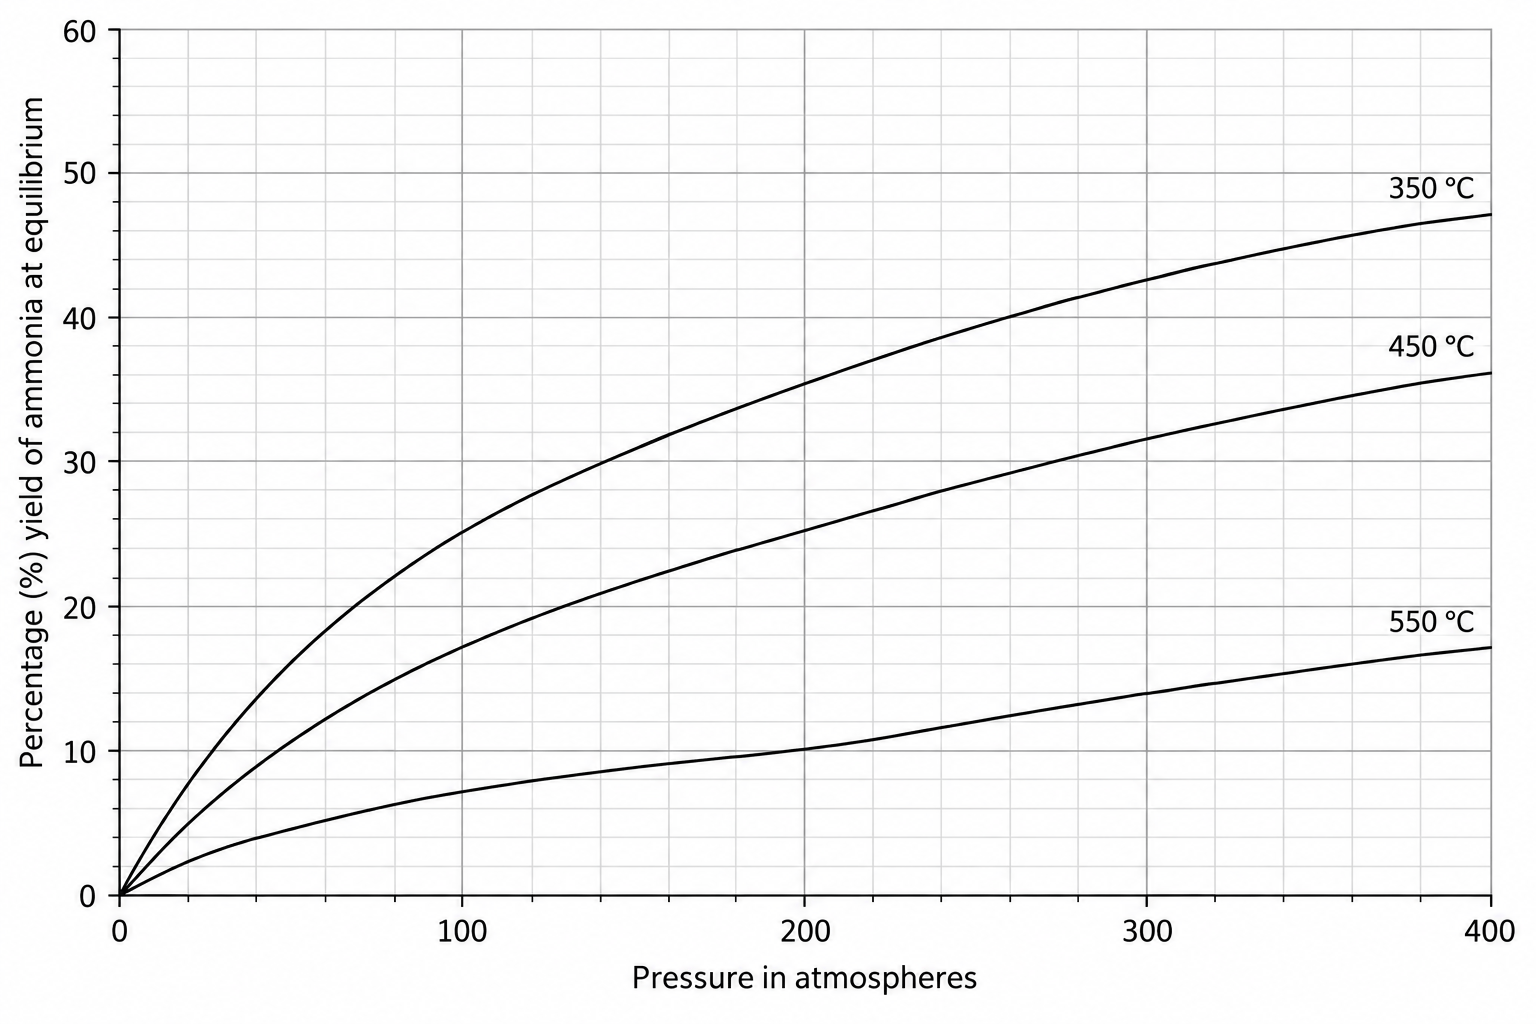
HFigure shows how the percentage yield of ammonia at equilibrium changes with pressure at three different temperatures.
Figure: The percentage yield of ammonia at equilibrium plotted against pressure at three different temperatures
a.[1]
Use Figure to give the percentage yield of ammonia at equilibrium at 200 atmospheres and 450 ∘C450\ ^\circ\text{C}450 ∘C.
b.[1]
Use Figure to describe how the percentage yield of ammonia at equilibrium changes as the pressure increases at 450 ∘C450\ ^\circ\text{C}450 ∘C.
c.[2]
Figure shows that 350 ∘C350\ ^\circ\text{C}350 ∘C gives a higher yield of ammonia than 450 ∘C450\ ^\circ\text{C}450 ∘C. Explain why a temperature of about 450 ∘C450\ ^\circ\text{C}450 ∘C is used in the Haber process instead of 350 ∘C350\ ^\circ\text{C}350 ∘C.
d.[1]
State the effect of the iron catalyst on the percentage yield of ammonia at equilibrium.
10.4 The Haber process and the use of NPK fertilisers Questions
39 exam-style questions on AQA GCSE Chemistry 10.4 The Haber process and the use of NPK fertilisers, covering 10.4.1a The Haber process, 10.4.1b Equilibrium and rate in the Haber process, and 10.4.2 Production and uses of NPK fertilisers. Each one has a worked solution and a mark scheme showing where the marks go.