Question 8
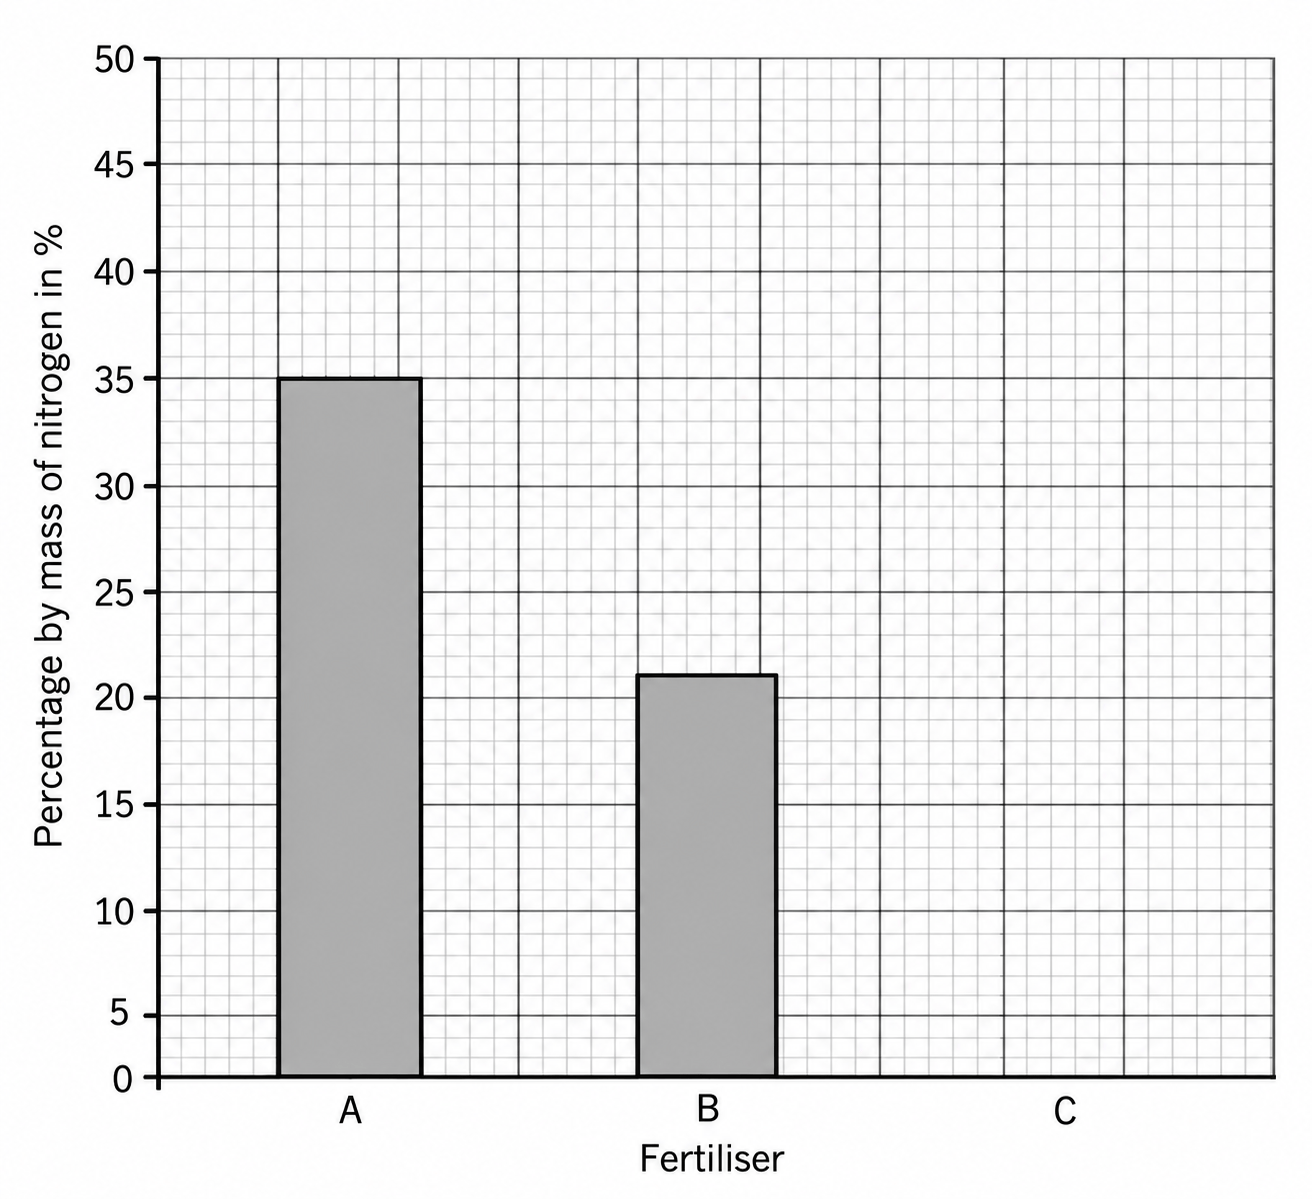
FA gardener is comparing three fertilisers, A, B and C. Figure shows the percentage by mass of nitrogen in each fertiliser. The bar for fertiliser C has not been drawn.
Figure: A bar chart of the percentage by mass of nitrogen in three fertilisers
Fertiliser C is urea, CO(NH2)2\text{CO(NH}_2\text{)}_2CO(NH2)2.
Relative atomic masses (ArA_rAr): H=1\text{H} = 1H=1 C=12\text{C} = 12C=12 N=14\text{N} = 14N=14 O=16\text{O} = 16O=16
a.[1]
Calculate the relative formula mass (MrM_rMr) of urea.
b.[2]
Calculate the percentage by mass of nitrogen in urea. Give your answer to 3 significant figures.
c.[1]
Complete Figure by drawing the bar for fertiliser C.
3.1 Chemical measurements, conservation of mass and the quantitative interpretation of chemical equations Questions
40 exam-style questions on AQA GCSE Chemistry 3.1 Chemical measurements, conservation of mass and the quantitative interpretation of chemical equations, covering 3.1.1 Conservation of mass and balanced chemical equations, 3.1.2 Relative formula mass, 3.1.3 Mass changes when a reactant or product is a gas, and 3.1.4 Chemical measurements. Each one has a worked solution and a mark scheme showing where the marks go.