Question 8
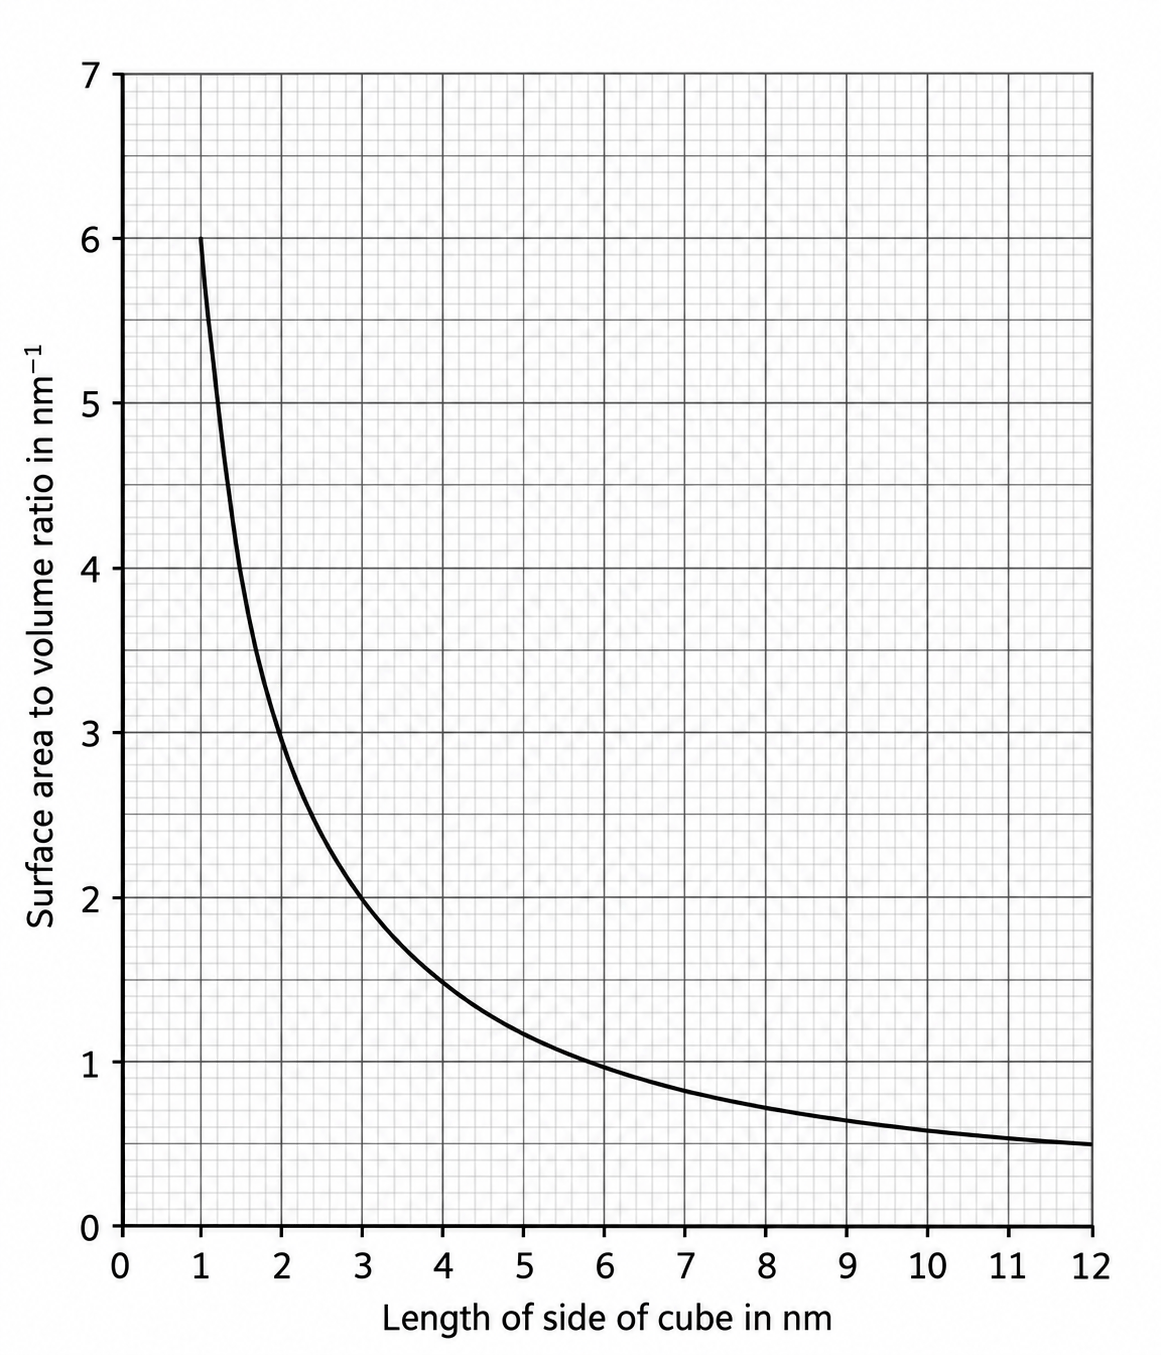
FThe figure shows how the surface area to volume ratio of a cube changes as the length of the side of the cube increases.
Figure: A graph of the surface area to volume ratio of a cube against the length of the side of the cube
a.[1]
Use the figure to determine the surface area to volume ratio of a cube with sides of length 4 nm4\ \text{nm}4 nm.
b.[2]
Use the figure to describe how the surface area to volume ratio changes as the length of the side of the cube increases.
2.4 Bulk and surface properties of matter including nanoparticles Questions
40 exam-style questions on AQA GCSE Chemistry 2.4 Bulk and surface properties of matter including nanoparticles, covering 2.4.1 Sizes of particles and their properties and 2.4.2 Uses of nanoparticles. Each one has a worked solution and a mark scheme showing where the marks go.