The four kinds of quantitative data and what each one is for
Definition
Quantitative data: information in the form of numbers, such as sales, costs and market share, that a business can measure, compare and calculate with.
Edexcel names four kinds of quantitative data, and each set answers a different question for the business.
| Data type | Contains | Helps decide |
|---|---|---|
| Graphs and charts | Trends, shares, comparisons | See movement at a glance |
| Financial | Revenue, costs, margins, cash | Cut costs, reprice, pay later |
| Marketing | Product sales, customers, share | Line to push, did offer work |
| Market | Size, growth, rival prices | Expand, hold back or reprice |
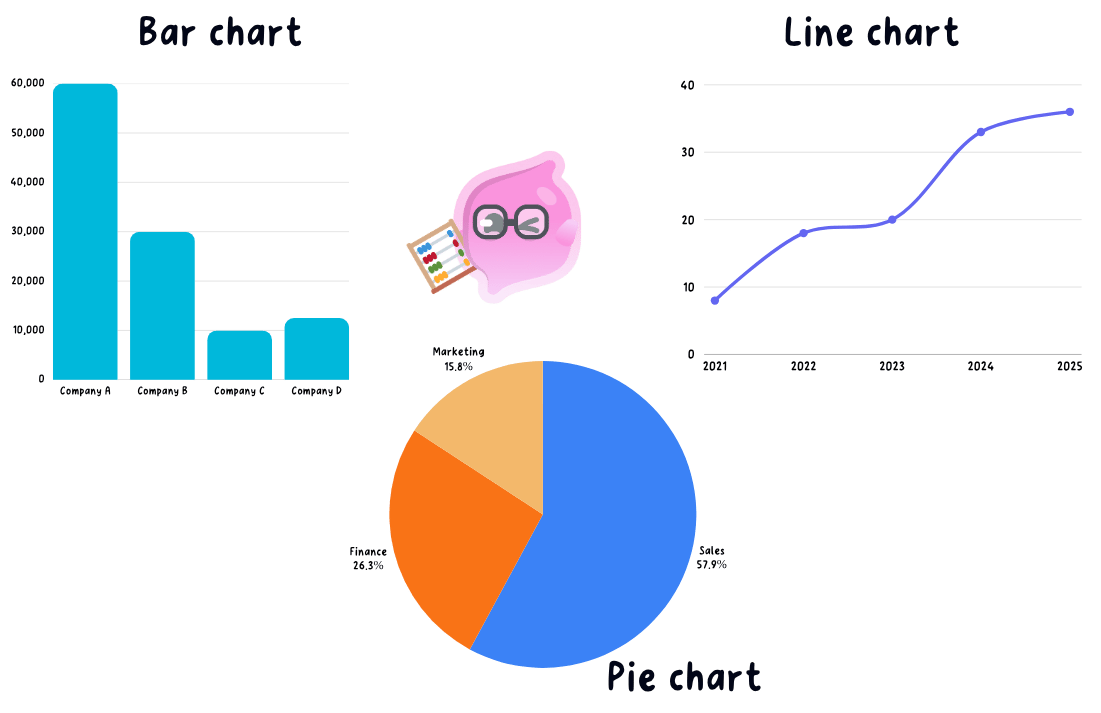
- Information from graphs and charts is the same figures drawn as a line, bar or pie so a trend or a share shows at a glance, which is how the source booklet usually hands you data, and reading one is worked through below.
- Financial data is revenue, costs, gross and net profit, the profit margins and the cash-flow forecast, which together say whether the business is making money and can still pay its suppliers.
- Output per worker, stock levels, waste and fault rates belong here as well, because scrap and rework land in costs, so a fault rate rising from 2 per cent to 6 per cent explains a falling margin that the revenue figure alone would hide.
- Marketing data is sales volume for each product, customer numbers, the share of the market held and how a promotion performed.
- Sales volume per product decides which lines get pushed and which get dropped, so a bakery selling 400 sausage rolls a day against 30 salads gives the salad shelf less space and its best seller the window.
- Customer numbers and share of the market separate growth taken from a rival from growth that simply came with the whole market, and only the first is evidence that the marketing worked.
- A promotion is judged by comparing sales in the weeks before, during and after the offer, and if the extra volume did not cover the money given away in discount the offer is not run again.
- Market data is the size of the whole market, whether it is growing or shrinking and the prices rivals charge, so a shrinking market tells a business that any growth has to be taken from a competitor rather than from new demand.
- The four sets are read together, because rising sales volume with falling profit points at costs rather than at demand.
How the data is used: a number only means something next to another number
- A single figure on its own is almost useless, so managers set every number against a benchmark of one of three kinds.
- This year against last year: comparing the same month or year gives the direction of travel, and three months of slipping customer numbers is a warning that can still be acted on.
- The business against a rival or an industry figure: revenue up 3 per cent looks healthy until the rest of the market grew 10 per cent.
- Actual against forecast: comparing what happened with what was budgeted shows whether the plan is working and where it went wrong.
- Build the chain when you use a figure: Greggs sells cheap hot food in high volume, so if its sales per shop per hour fall while total revenue holds up, customer numbers are dropping and the loss is being hidden by new shop openings, which means the board should look at footfall rather than at prices.
Note
Judging whether a set of figures means the business is performing well is the next guide, on understanding business performance.
Reading graphs, charts and tables, and working out a percentage change
- Read the title, the axis labels and the units before the shape of the line, because a heading of £000s means every figure on the chart is in thousands of pounds.
- A line graph shows a trend over time, a bar chart compares categories such as revenue in each branch, a pie chart shows shares of a whole such as a market, and a table gives the exact figures you can calculate with.
- Percentage change turns two raw figures into a size of movement you can set against a rival or a target.
- percentage change=new figure−old figureold figure×100\text{percentage change} = \dfrac{\text{new figure} - \text{old figure}}{\text{old figure}} \times 100percentage change=old figurenew figure−old figure×100
- A shop's sales rise from £40,000 to £46,000, so £46,000−£40,000£40,000×100=15%\dfrac{\pounds 46{,}000 - \pounds 40{,}000}{\pounds 40{,}000} \times 100 = 15\%£40,000£46,000−£40,000×100=15%.
- A 15 per cent rise is only good news against something: if the owner forecast 20 per cent the plan has missed, and if rivals grew 5 per cent the shop is winning customers from them.
Common Mistake
- Check where the vertical axis starts, because an axis beginning at £38,000 rather than zero makes the move from £40,000 to £46,000 look several times bigger than the 15 per cent rise it actually is.
- Divide by the OLD figure, not the new one, since dividing £6,000 by £46,000 gives 13 per cent and loses the mark.
The limits of numbers: what they cannot tell the business
- Quantitative data shows what happened but never why, so a 15 per cent sales rise does not say whether the cause was the new advert, warm weather or a rival closing.
- Data ages fast, so a market report from three years ago can send a business into a market that has already been taken by a cheaper rival.
- An average hides the variation underneath it, since average daily sales of £5,000 could mean £5,000 every day, or £2,000 on each of six quiet days and £23,000 on the Saturday, and those two businesses need completely different staffing.
Exam technique
- Quote the actual figure with its units from the table or chart rather than writing that sales went up.
- Follow every figure with a comparison, because the mark is for what the number means, not for copying it out.
- When the command word is calculate, show the working and the percentage sign, since method can be credited even if the arithmetic slips.
- When the question says analyse or justify, use the data as evidence in the chain and add one limitation of it, such as the figures being out of date.
Self review
- Name the four kinds of quantitative business data, which are information from graphs and charts, financial data, marketing data and market data, and give one example of each.
- Give three benchmarks a business can compare a figure against.
- Customer numbers fall from 2,500 to 2,200, so what is the percentage change?
- Which two pieces of marketing data would tell you whether a special offer was worth repeating?
- Why does an average sales figure hide a staffing problem?
