The curve: sales on the vertical axis, time on the horizontal
Definition
Product life cycle: the four stages a product passes through from launch to withdrawal, tracked by what happens to its sales over time.
Extension strategy: an action taken as sales flatten in maturity to lift them again and delay decline.
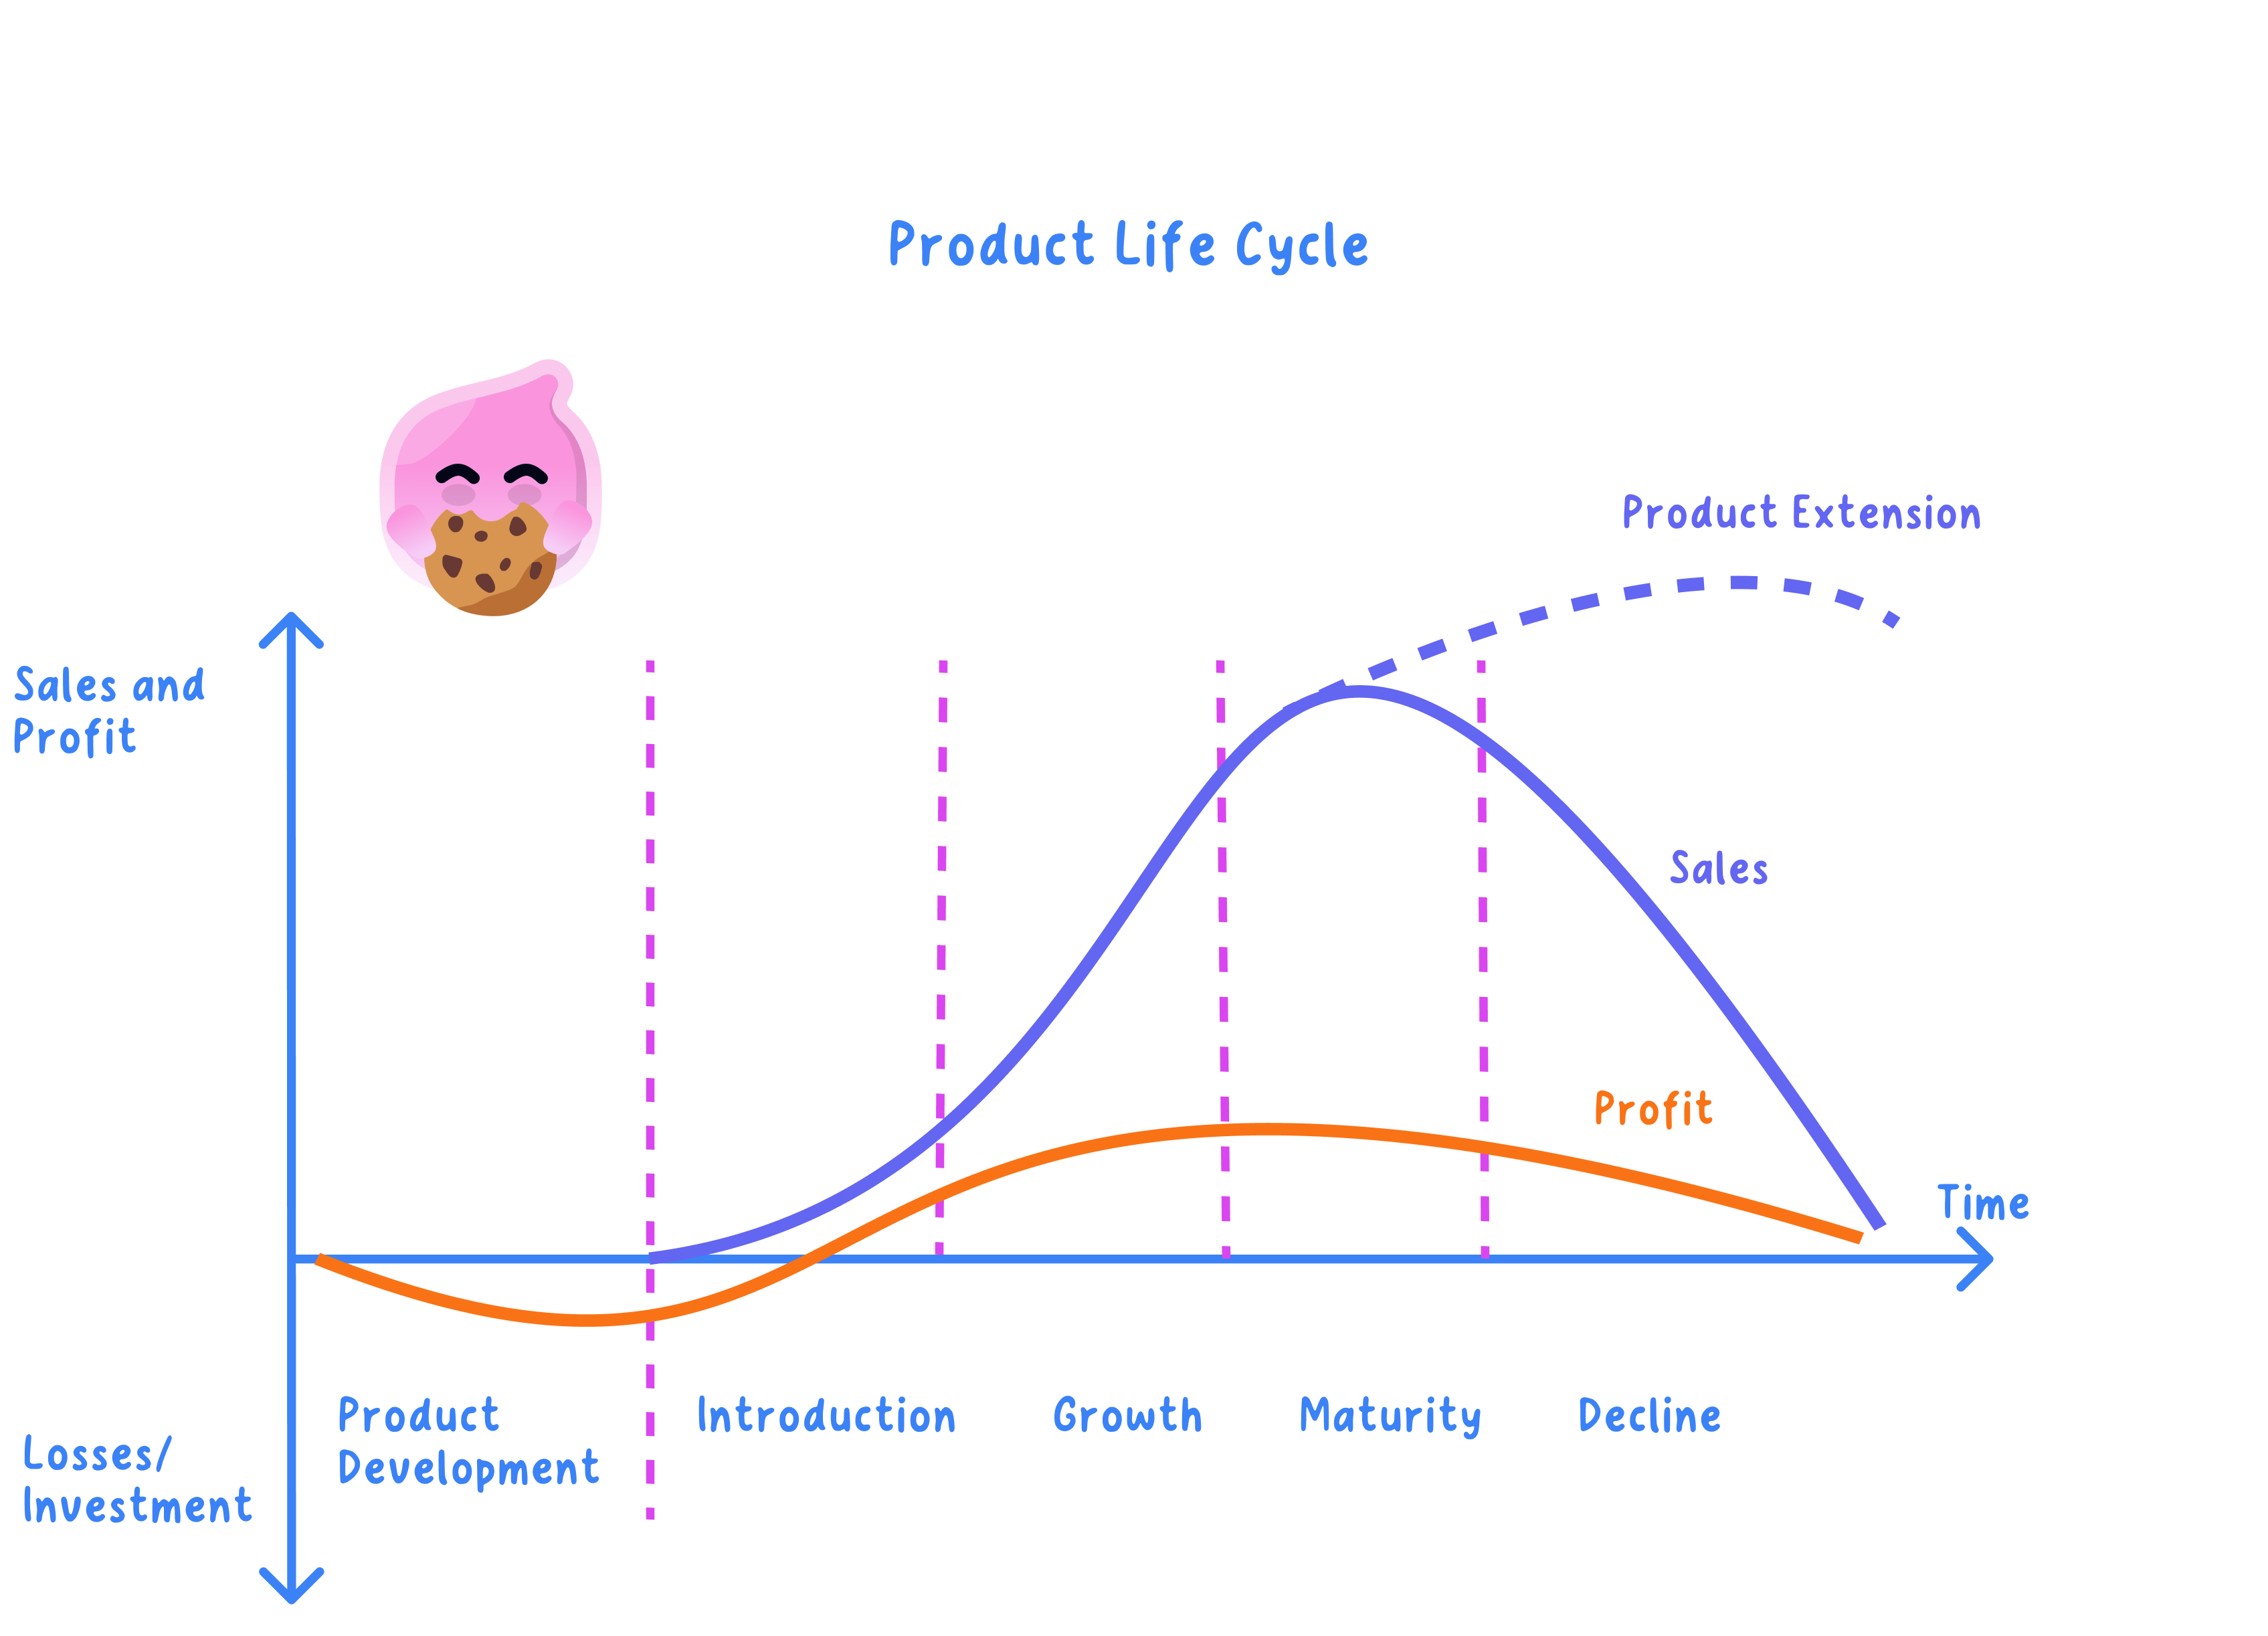
- The diagram plots sales on the vertical axis against time on the horizontal axis, following one product rather than the whole business.
- The curve starts low and almost flat at launch because few customers know the product exists, then climbs steeply through growth as word spreads.
- The slope then eases until the line runs flat along a peak through maturity, before falling away towards the axis in decline.
- An extension strategy bends the curve upward again from maturity, so instead of one peak and a slide you draw a run of smaller rises.
What each stage does to sales, spending and profit
- Introduction: sales are low and the business is still spending heavily on promotion and finishing the product, so it usually makes a loss.
- Cash leaves the business months before customers pay it back, so a launch is often funded from a loan or from the profits of an older product.
- Growth: sales rise fast as distribution widens, the product turns profitable for the first time, and rivals begin to copy it.
- Maturity: sales reach their peak and flatten, competition is at its strongest, and price cuts and special offers become common.
- Total profit is at its highest here because volume is greatest, but the profit on each unit is squeezed by those price cuts.
- Decline: sales fall as customers move to something newer, and the business chooses between extending the product, cutting the price to clear the remaining stock, and withdrawing it altogether.
- The four stages read most clearly side by side.
| Stage | Sales | Profit | Business action |
|---|---|---|---|
| Introduction | Low, rising slowly | Loss | Promote to build awareness |
| Growth | Rising fast | Turns positive, rises | Wider distribution, branding |
| Maturity | At peak, flat | Highest total, thin per unit | Extension strategies, offers |
| Decline | Falling | Falling | Extend, discount or withdraw |
- Profit lags behind sales, because the loss made in introduction has to be paid back out of the growth and maturity years before the product has earned its keep.
- Maturity is the row that matters most, since it is where the money is made and where the business must act if it wants to keep the curve up.
Example
- Blockbuster rented out DVDs from high-street shops, a product that ran through the whole cycle.
- Streaming, led by Netflix, gave customers the same films without a trip to a shop, which pushed DVD rental into decline.
- No repackaging or advertising could reverse that, because the fall came from a better way of delivering the same thing.
- The UK Blockbuster business entered administration in 2013.
Extension strategies: lifting the curve before it falls
- Extending a product customers already know is cheaper and less risky than developing a replacement, so a business acts while sales are still flat in maturity rather than halfway down the decline.
- Advertising: a fresh campaign reminds people the product exists or repositions it for a different buyer, such as a breakfast cereal advertised as an evening snack.
- A new or updated version: a games console re-released in a slimmer case with more storage gives owners of the old model a reason to buy again.
- New packaging: a resealable pouch or a seasonal design makes a familiar product look new on the shelf, which can lift sales without cutting the price.
- A new market or a new audience: Greggs launched a vegan sausage roll, putting a familiar product in front of customers who do not eat meat.
- Lowering the price: taking 50p off a £2.50 sandwich wins back shoppers who thought it had become dear, although every sale then earns less.
- Adding a new feature: a mobile phone contract that gains unlimited data at the same monthly price keeps customers who were about to switch.
- The life cycle is a model rather than a timetable, so a fashion item can run the whole curve in one season while a chocolate bar sits in maturity for decades.
- Knowing which stage a product has reached tells the business where to spend, because money spent building awareness suits introduction while money spent on extension suits maturity.
Exam technique
- Read the sales figures before naming a stage, because rising fast is growth while high but flat is maturity.
- When the command word is explain, name the strategy, say what it does to sales, then say what that does to profit.
- Match the strategy to the product in the source booklet, since a chocolate bar and a games console need different extensions.
- When the question says justify or evaluate, weigh the cost of extending against the extra revenue and say whether the cause of the fall can be reversed at all.
- Label both axes on any curve you draw, because an unlabelled diagram earns nothing.
Self review
- Name the four stages of the product life cycle in order.
- Which axis shows sales and which shows time?
- At which stage is total profit highest, and why is profit per unit squeezed there?
- Give three extension strategies with an example of each.
- Why does the same stage last far longer for some products than for others?
