2.4.1a Gross and net profit
What gross profit and net profit each measure
Gross profit: what is left out of sales revenue once the direct cost of the goods sold has been taken off.
Net profit: what is left out of gross profit once the other operating expenses and the interest have been taken off.
Gross profit
gross profit=sales revenue−cost of sales \text{gross profit} = \text{sales revenue} - \text{cost of sales} gross profit=sales revenue−cost of sales- This answers whether the product itself makes money, because the only cost taken off is the cost of the goods that were sold.
Net profit
net profit=gross profit−other operating expenses and interest \text{net profit} = \text{gross profit} - \text{other operating expenses and interest} net profit=gross profit−other operating expenses and interest- This answers whether the whole business makes money, because every running cost has now been paid out of what the trading earned.
- There are two profit figures because those are two different questions, and a business can be strong on one and weak on the other.
- A firm with a healthy gross profit and a thin net profit is selling its product well but paying too much to keep the doors open.
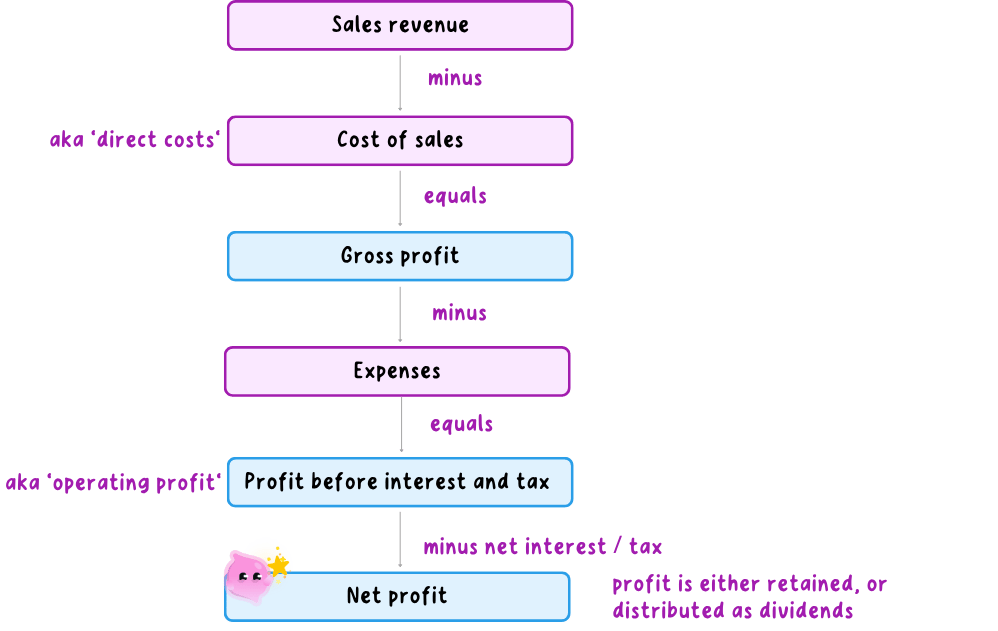
This diagram shows a fuller income-statement flow than you need here. For GCSE Edexcel, focus on gross profit and net profit. “Profit before interest and tax” is also commonly called operating profit.
The figures set out in full: two trading years
- The lines below are one business over two years, each column read downwards from sales revenue at the top to net profit at the bottom.
| £ | 2025 | 2026 |
|---|---|---|
| Revenue | 250,000 | 264,000 |
| Cost of sales | 150,000 | 171,600 |
| Gross profit | 100,000 | 92,400 |
| Other operating expenses | 64,000 | 66,000 |
| Interest | 6,000 | 6,600 |
| Net profit | 30,000 | 19,800 |
Working down the figures: what each line means
Interest: the charge a business pays on money it has borrowed, which is taken off below gross profit alongside the other operating expenses.
- Cost of sales: the direct cost of the goods actually sold, such as the materials in a product or the stock a shop has bought in.
- It is not the cost of running the business, so rent, wages and insurance never belong on this line.
- Gross profit
- This is the 2025 gross profit.
- That £100,000 is everything the trading itself produced before a single running cost has been paid.
- Other operating expenses: rent, wages, energy, insurance and marketing, the costs of keeping the business open whatever it sells.
- Interest: it sits below gross profit because it is the price of borrowed money rather than a cost of the goods, so it never touches the gross profit line.
- A business carrying a large loan can therefore report a strong gross profit and a weak net profit for that reason alone.
- Net profit
- This is the 2025 net profit.
- Only this bottom figure is money the owner can act on, since it is what remains to put back into the business or take as income.
Reading the change from 2025 to 2026: revenue up, profit down
- Revenue: revenue rose by £14,000 between the two years, which on its own looks like the better year.
- Gross profit: gross profit fell by £7,600 all the same, down from £100,000 to £92,400.
- Cost of sales rose by £21,600 over the same period, far faster than the £14,000 rise in revenue.
- Cost of sales as a share of revenue
- The first figure is 2025 and the second is 2026.
- Every £1 of sales cost 60p to buy in and now costs 65p, so either suppliers have raised their prices or the business has discounted to shift stock.
- Net profit: net profit fell by £10,200, a wider drop than the £7,600 lost at the gross profit line.
- Other operating expenses rose from £64,000 to £66,000 and interest rose from £6,000 to £6,600, so the shortfall grew as it travelled down the page.
- A rising interest charge points at extra borrowing taken on during the year, and that is a cost the owner carries into the next one.
- The owner should investigate the 5p rise in the cost of every £1 sold before anything else, because reversing it lifts every line beneath it.
Do not read a rise in revenue as a rise in profit, because this business sold £14,000 more and still ended the year £10,200 worse off.
- Recall both formulas and keep gross profit separate from net profit.
- For calculations, classify the costs correctly, show the formula and figures, then give the answer with a £ sign.
- For explanation or analysis, say what the profit figure or change means for the business rather than leaving the number on its own.
- State the formula for gross profit and the formula for net profit.
- A business has revenue of £80,000, cost of sales of £45,000, other operating expenses of £20,000 and interest of £3,000, so what are its gross profit and its net profit?
- Which costs belong in cost of sales, and which belong in other operating expenses?
- Why did gross profit fall in 2026 in a year when revenue rose?
- A firm has a healthy gross profit but a weak net profit, so where should the owner look first and why?
2.4.1b Margins and average rate of return
Gross and net profit margin: what each pound of sales leaves behind
Gross profit margin: gross profit written as a percentage of revenue, showing how much of each pound of sales survives the direct cost of the product.
Net profit margin: net profit written as a percentage of revenue, showing how much of each pound of sales survives every cost the business pays.
- The last guide left a shop with revenue of £250,000, gross profit of £100,000 and net profit of £30,000, and both margins are built from those three figures.
- Gross profit margin is found from gross profit margin=gross profitrevenue×100\text{gross profit margin} = \dfrac{\text{gross profit}}{\text{revenue}} \times 100gross profit margin=revenuegross profit×100.
- Substituting the shop's figures gives £100,000£250,000×100=40%\dfrac{\pounds 100{,}000}{\pounds 250{,}000} \times 100 = 40\%£250,000£100,000×100=40%.
- So 40p of every £1 of sales is left after the direct cost of the product, and that 40p is all the shop has to cover rent, wages, marketing and every other running cost.
- Net profit margin is found from net profit margin=net profitrevenue×100\text{net profit margin} = \dfrac{\text{net profit}}{\text{revenue}} \times 100net profit margin=revenuenet profit×100.
- Substituting the same revenue gives £30,000£250,000×100=12%\dfrac{\pounds 30{,}000}{\pounds 250{,}000} \times 100 = 12\%£250,000£30,000×100=12%.
- So 12p of every £1 of sales is left once every cost is paid, and that 12p is what the owner can take out of the business or reinvest in it.
Why a margin tells you more than the profit figure alone
- A margin strips out the size of the business, because £30,000 of profit would be a strong year for a market stall and an alarming one for a supermarket chain.
- That makes two comparisons possible: the same margin measured for a rival of a completely different size, and the same margin measured for this business last year.
- Revenue can rise while the margin falls, which tells the owner the shop is selling more but keeping less out of each sale, a warning the profit figure on its own hides.
- Greggs sells cheap hot food in very high volume, so a thin margin on each sausage roll is normal and the profit comes from the number of sales.
- Dyson sells on design and engineering at a premium price, so it works with a far wider margin on each machine and sells fewer of them.
- Setting Greggs's margin against Dyson's would tell you nothing useful, so compare a business with a rival in its own market or with its own last year.
Reading a falling margin: which one moved matters
The two margins fall for different reasons, so reading them side by side points at the cause.
| What has changed | Gross margin | Net margin | What it signals |
|---|---|---|---|
| Suppliers raise prices | Falls | Falls | The product costs more to make |
| Heavy discounting | Falls | Falls | Sales are being bought with price cuts |
| Rent or wages rise | Holds steady | Falls | Overheads have risen |
| Cheaper supplier found | Rises | Rises | Direct costs have been cut |
- The gross margin touches only revenue and the direct cost of the product, so when it slides the cause sits with suppliers or with the price being charged.
- A net margin that falls while the gross margin holds steady means the trading itself is unchanged and the overheads have grown, so the owner should look at rent, wages and marketing rather than at suppliers.
Average rate of return: judging money spent on an investment
Average rate of return (ARR): the average yearly profit an investment earns, written as a percentage of the money spent on it.
A business spends £60,000 on a new machine that is expected to earn £90,000 of profit over 5 years.
ARR is found from ARR=average annual profitcost of investment×100\text{ARR} = \dfrac{\text{average annual profit}}{\text{cost of investment}} \times 100ARR=cost of investmentaverage annual profit×100.
Average annual profit comes first, from £90,0005=£18,000\dfrac{\pounds 90{,}000}{5} = \pounds 18{,}0005£90,000=£18,000.
Putting that into the formula gives £18,000£60,000×100=30%\dfrac{\pounds 18{,}000}{\pounds 60{,}000} \times 100 = 30\%£60,000£18,000×100=30%.
The machine returns 30 per cent of its cost each year on average, which can be set against another project or against the interest the £60,000 would earn sitting in the bank.
- Treat the answer with care, because it rests on forecast profits, and a forecast that turns out to be optimistic makes a weak project look strong.
- ARR also ignores when the money arrives, so a project that returns most of its profit in year five scores exactly the same as one that returns it in year one, even though the second frees up cash far sooner.
- For calculations, write the formula first, show the figures clearly and give margins or ARR as percentages.
- For ARR, calculate average annual profit before dividing by the cost of the investment.
- For interpretation or comparison, explain what the percentage means for this business and use the relevant rival, year or project.
- State the formula for the gross profit margin.
- A shop has revenue of £250,000 and net profit of £30,000, so what is its net profit margin?
- A machine costs £40,000 and is forecast to earn £50,000 of profit over 5 years, so what is its ARR?
- A business's gross margin holds steady while its net margin falls, so what has happened?
- Give one reason an ARR figure can mislead a business.
2.4.2a Using quantitative business data
The four kinds of quantitative data and what each one is for
Quantitative data: information in the form of numbers, such as sales, costs and market share, that a business can measure, compare and calculate with.
Edexcel names four kinds of quantitative data, and each set answers a different question for the business.
| Data type | Contains | Helps decide |
|---|---|---|
| Graphs and charts | Trends, shares, comparisons | See movement at a glance |
| Financial | Revenue, costs, margins, cash | Cut costs, reprice, pay later |
| Marketing | Product sales, customers, share | Line to push, did offer work |
| Market | Size, growth, rival prices | Expand, hold back or reprice |
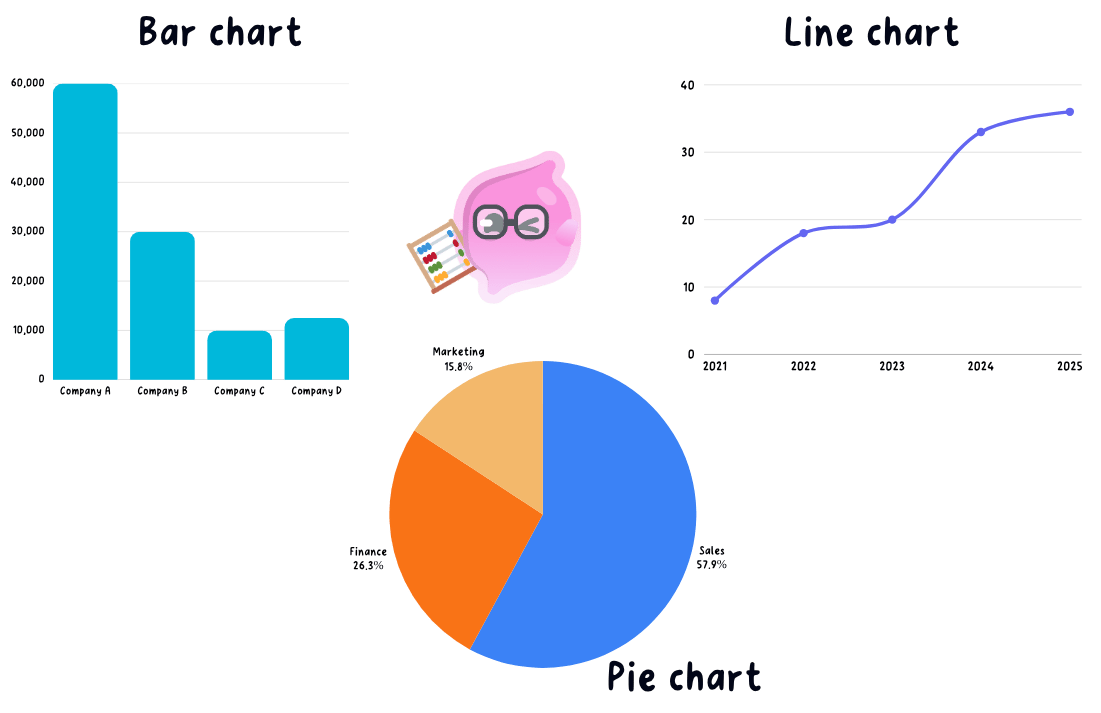
- Information from graphs and charts is the same figures drawn as a line, bar or pie so a trend or a share shows at a glance, which is how the source booklet usually hands you data, and reading one is worked through below.
- Financial data is revenue, costs, gross and net profit, the profit margins and the cash-flow forecast, which together say whether the business is making money and can still pay its suppliers.
- Output per worker, stock levels, waste and fault rates belong here as well, because scrap and rework land in costs, so a fault rate rising from 2 per cent to 6 per cent explains a falling margin that the revenue figure alone would hide.
- Marketing data is sales volume for each product, customer numbers, the share of the market held and how a promotion performed.
- Sales volume per product decides which lines get pushed and which get dropped, so a bakery selling 400 sausage rolls a day against 30 salads gives the salad shelf less space and its best seller the window.
- Customer numbers and share of the market separate growth taken from a rival from growth that simply came with the whole market, and only the first is evidence that the marketing worked.
- A promotion is judged by comparing sales in the weeks before, during and after the offer, and if the extra volume did not cover the money given away in discount the offer is not run again.
- Market data is the size of the whole market, whether it is growing or shrinking and the prices rivals charge, so a shrinking market tells a business that any growth has to be taken from a competitor rather than from new demand.
- The four sets are read together, because rising sales volume with falling profit points at costs rather than at demand.
How the data is used: a number only means something next to another number
- A single figure on its own is almost useless, so managers set every number against a benchmark of one of three kinds.
- This year against last year: comparing the same month or year gives the direction of travel, and three months of slipping customer numbers is a warning that can still be acted on.
- The business against a rival or an industry figure: revenue up 3 per cent looks healthy until the rest of the market grew 10 per cent.
- Actual against forecast: comparing what happened with what was budgeted shows whether the plan is working and where it went wrong.
- Build the chain when you use a figure: Greggs sells cheap hot food in high volume, so if its sales per shop per hour fall while total revenue holds up, customer numbers are dropping and the loss is being hidden by new shop openings, which means the board should look at footfall rather than at prices.
Judging whether a set of figures means the business is performing well is the next guide, on understanding business performance.
Reading graphs, charts and tables, and working out a percentage change
- Read the title, the axis labels and the units before the shape of the line, because a heading of £000s means every figure on the chart is in thousands of pounds.
- A line graph shows a trend over time, a bar chart compares categories such as revenue in each branch, a pie chart shows shares of a whole such as a market, and a table gives the exact figures you can calculate with.
- Percentage change turns two raw figures into a size of movement you can set against a rival or a target.
- percentage change=new figure−old figureold figure×100\text{percentage change} = \dfrac{\text{new figure} - \text{old figure}}{\text{old figure}} \times 100percentage change=old figurenew figure−old figure×100
- A shop's sales rise from £40,000 to £46,000, so £46,000−£40,000£40,000×100=15%\dfrac{\pounds 46{,}000 - \pounds 40{,}000}{\pounds 40{,}000} \times 100 = 15\%£40,000£46,000−£40,000×100=15%.
- A 15 per cent rise is only good news against something: if the owner forecast 20 per cent the plan has missed, and if rivals grew 5 per cent the shop is winning customers from them.
- Check where the vertical axis starts, because an axis beginning at £38,000 rather than zero makes the move from £40,000 to £46,000 look several times bigger than the 15 per cent rise it actually is.
- Divide by the OLD figure, not the new one, since dividing £6,000 by £46,000 gives 13 per cent and loses the mark.
The limits of numbers: what they cannot tell the business
- Quantitative data shows what happened but never why, so a 15 per cent sales rise does not say whether the cause was the new advert, warm weather or a rival closing.
- Data ages fast, so a market report from three years ago can send a business into a market that has already been taken by a cheaper rival.
- An average hides the variation underneath it, since average daily sales of £5,000 could mean £5,000 every day, or £2,000 on each of six quiet days and £23,000 on the Saturday, and those two businesses need completely different staffing.
- Quote the actual figure with its units from the table or chart rather than writing that sales went up.
- Follow every figure with a comparison, because the mark is for what the number means, not for copying it out.
- When the command word is calculate, show the working and the percentage sign, since method can be credited even if the arithmetic slips.
- When the question says analyse or justify, use the data as evidence in the chain and add one limitation of it, such as the figures being out of date.
- Name the four kinds of quantitative business data, which are information from graphs and charts, financial data, marketing data and market data, and give one example of each.
- Give three benchmarks a business can compare a figure against.
- Customer numbers fall from 2,500 to 2,200, so what is the percentage change?
- Which two pieces of marketing data would tell you whether a special offer was worth repeating?
- Why does an average sales figure hide a staffing problem?
2.4.2b Financial information: understanding performance
What each figure tells you about performance
The table sets out what a movement in each measure signals, before you go looking for the cause.
| Measure | What a rise signals | What a fall signals |
|---|---|---|
| Revenue | Selling more, or at higher prices | Fewer sales, or discounting |
| Gross profit margin | Cheaper to make, or a higher price | Cost of sales up, or prices cut |
| Net profit margin | Overheads under control | Overheads rising faster than sales |
| Closing cash balance | More cover for bills due | Risk of not paying bills on time |
- Revenue rising while profit falls means the business is selling more at a worse margin, because it has discounted to win those extra sales or each sale now costs more to supply.
- Gross profit and gross profit margin test the product itself, before rent, wages and marketing are paid, so a fall means either it costs more to make or the price charged has dropped.
- Net profit and net profit margin test the whole business once overheads are paid, so a healthy gross margin sitting above a weak net margin places the problem in running costs rather than in the product.
- Cash-flow figures answer a different question, whether the business can pay its bills as they fall due, and a profitable business can still run dry while it waits for customers to pay.
- Greggs sells at low prices in high volume, so the profit made on one sausage roll is small.
- A margin that slips by a penny in the pound looks trivial on one sale and removes a large sum across millions of them.
- A business working on thin margins therefore watches the margin percentage as closely as the revenue total.
Why one figure means nothing on its own
- A figure becomes performance only when it is set beside something else, and three comparisons do that work.
- Against last year: this gives the direction of travel, which tells you more than the level does.
- Against a rival or the industry average: this shows whether a 4% net margin is weak or normal for the trade, since Aldi and Lidl work on far thinner margins than a jeweller does.
- Against the forecast or target: this shows whether the plan the owner set, and may have borrowed against, is being met.
- Two shops both made £40,000 net profit this year, but one made £20,000 last year and the other made £80,000, so the identical figure hides a doubling in one and a halving in the other.
Worked interpretation: a gross margin falling while the net margin holds
- A business had a gross profit margin of 40% last year and 34% this year, while its net profit margin stayed at 12% in both years.
- The gross margin lost six percentage points, so either the cost of making each item rose, through dearer ingredients, materials or wages in production, or the price charged was cut to keep sales moving.
- Net profit is what survives of gross profit once overheads are paid, so a net margin holding at 12% while the gross margin fell six points means overheads must have been cut by roughly six pence in every pound of revenue.
- The owner has paid for a weaker product margin with a cut in running costs, which is a one-off rescue rather than a recovery, so three questions come before any decision.
- Why the gross margin fell: a supplier price rise is imposed on the business, while a deliberate discount is a choice that can be reversed.
- Which overheads were cut: cutting marketing or staff hours protects this year's net margin and can shrink next year's sales, so the same trick will not work twice.
- Whether revenue grew: 34% of a much larger revenue can be more pounds of gross profit than 40% of a smaller one, so the percentage on its own does not settle whether the year was good.
What the figures do not tell you
- Financial information is backward looking, because it describes the year that has ended while the business is judged on the year that is starting.
- The accounts are also silent on three things that will shape next year's figures.
- Staff morale: high labour turnover, weak training and a demotivated team reach the accounts a year late, through slower service and lost custom.
- Customer satisfaction: complaints, reviews and repeat custom predict revenue in a way that this year's revenue figure cannot.
- The market and rivals: a competitor opening nearby or a shift in what shoppers want can undo a strong year, as Wilko found when it entered administration in August 2023 after trading since 1930.
- Quote the figure, compare it with last year, a rival or the target, then say what that comparison means for this business, because the comparison is where the mark sits.
- When revenue and profit move in opposite directions, name which margin moved, since that locates the problem in the product or in the overheads.
- Compare businesses of different sizes using margins rather than raw £ figures.
- When the question says analyse, carry the chain through to an effect on the business, and when it says evaluate or justify, weigh what the figures show against what they cannot show.
- What does rising revenue alongside falling profit tell you about the margin?
- Which margin do you check to find out whether overheads are the problem?
- A business has a gross profit margin of 40% and a net profit margin of 12%, so what share of revenue is taken by overheads?
- Name the three comparisons that give a single figure meaning.
- Give two things about a business that its accounts cannot show you.
2.4.2c Financial information: making business decisions
How financial information supports a decision: three worked chains
- Financial information supports a decision by narrowing the options rather than by choosing between them, and each figure points at a different kind of choice.
- A gross profit margin that has slipped from 42% to 35% in a year means every £1 of sales now leaves 7p less to cover wages and rent, which points at a decision about price or supplier.
- Raising the price protects the margin but risks losing customers to a cheaper rival, while switching supplier protects it without touching the price and risks a drop in quality.
- An average rate of return of 18% on a new oven against 6% on a second delivery van points £8,000 of spare cash at the oven, because each £1 invested there earns three times as much a year.
- A cash-flow forecast showing a closing balance of -£3,200 in March points at arranging an overdraft in January, because a business still in credit negotiates from strength while one that has already bounced a payment to a supplier faces a higher rate or a refusal.
- The types of quantitative data a business collects are covered in 2.4.2a, and reading what a set of figures says about performance is 2.4.2b.
- The formulae behind gross and net profit, the two margins and ARR belong to 2.4.1, so here you use the results rather than work them out.
Qualitative information: why the numbers are never enough on their own
Qualitative information: descriptions, opinions and judgements about a business and its market that cannot be reduced to a number, such as what customers say, how staff feel and what a supplier's reputation is.
- Qualitative information covers five things a decision usually turns on.
- Customer opinions and reviews: what people say about the product tells you whether last year's sales are likely to repeat.
- Staff morale: a team already working extra shifts may not absorb the large order the figures say is profitable.
- The reputation and ethics of a supplier: a firm caught underpaying its workers becomes your story too once a newspaper names the brands it supplies.
- The state of the market and what rivals are likely to do: if Aldi and Lidl cut prices across their narrow range, a small shop's forecast of steady sales stops being safe.
- The owner's own aims: an owner who started the business to stay in control will turn down an expansion the numbers support.
- In the table below, a bakery choosing between three flour suppliers shows how the two kinds of information can point in opposite directions.
- Supplier A is £1.50 a sack cheaper than Supplier B, which on 40 sacks a week is 40×£1.50×52=£3,12040 \times \pounds 1.50 \times 52 = \pounds 3{,}12040×£1.50×52=£3,120 saved in a year.
- That saving buys a supplier whose deliveries are late almost three times in ten, so the bakery risks mornings with nothing to sell and a working conditions record that could cost it a wholesale contract.
- Quantitative information tells you what is happening, qualitative information tells you why it is happening and what is likely to happen next, so a decision built on one of them alone is half made.
| Supplier A | Supplier B | Supplier C | |
|---|---|---|---|
| Price per 16kg sack (£) | 12.00 | 13.50 | 14.00 |
| Deliveries on time | 72% | 94% | 99% |
| Working conditions | Complaints reported | No concerns | Audited yearly |
| Reviews from other bakeries | Poor | Good | Good |
Judging whether to rely mainly on financial information
- Financial information is objective and useful for comparing options, but historical figures may be out of date and forecasts depend on assumptions that may prove wrong.
- The more important or irreversible the decision, the more the business should combine reliable recent figures with qualitative evidence such as customer views, staff capacity and supplier reputation.
- Overall, financial information should set what the business can afford, while qualitative judgement helps choose between the realistic options.
- Use a figure from the source booklet and explain what it means for the decision rather than leaving the number unexplained.
- Add a relevant qualitative factor from the case material, especially where the figures cannot capture customer, staff, supplier or market issues.
- For a judgement, use the figures to rule options in or out, then make a conditional recommendation using the wider evidence.
- Define qualitative information and give two examples of it.
- A gross profit margin falls from 42% to 35%: name the two decisions that points at.
- Supplier A charges £12.00 a sack and Supplier B £13.50, so how much does a bakery using 40 sacks a week save in a year by choosing A?
- Give two reasons why financial information cannot settle a decision on its own.
- State the three things that decide how far a business should lean on its figures.
