5.3.1 Purpose of market research
What market research is for
Market research: gathering and analysing information about customers, competitors and the market so that business decisions are based on evidence.
- Before it commits money to a product, a price or a new site, a business gathers information so the decision rests on evidence rather than a hunch.
- Research is aimed at three things: how much demand there is likely to be, who the competition is, and who exactly the target market is.
Finding out likely demand
- Demand is the quantity of a product customers are willing and able to buy, and research tries to size it before the business spends anything.
- The business asks how many potential customers there are, how often they would buy and what they would be prepared to pay.
- A café owner who counts 1,800 people walking past a proposed site between 7am and 10am has evidence about demand that a hunch could never provide.
- If the answers show too few customers, the business can change the product, pick a different site or drop the idea altogether while it is still cheap to do so.
Greggs tested its vegan sausage roll in a limited number of shops first, so it had evidence of real demand before putting the product into shops nationwide.
Understanding the competition
- Research also looks outwards at rivals: how many there are, what they sell, what they charge and how customers rate them.
- That shows whether there is room to enter the market at all, and what the business would have to do differently to win customers away from firms already there.
- Aldi checks rivals' shelf prices constantly, which is how it can advertise direct price comparisons against Tesco and Sainsbury's.
- Rivals' weaknesses are where the market opportunities sit, such as slow service, short opening hours or a part of the range that nobody stocks.
- Deliveroo grew out of one such opportunity, that thousands of restaurants had customers who wanted delivery and no way of delivering to them.
A customer need that no competitor currently satisfies is called a gap in the market, and finding one is the clearest opportunity research can hand a business.
Identifying the target market
Target market: the specific group of customers a business aims its product and its marketing at.
- Research shows which customers actually want the product, so the business can aim at them rather than at everybody and hope.
- Knowing the target market then sets the whole marketing mix, because the product, the price, the promotion and the place all follow from who the customer is.
- Monzo found that younger customers wanted instant notifications and simple budgeting on a phone, so it built an app-only bank instead of a branch network.
Reducing risk
- Every business decision carries risk, the chance that the money, time and reputation put into it are lost.
- Research reduces that risk by finding out what customers want first, so the business is far less likely to launch something nobody wants.
- The cost of a few hundred questionnaires is tiny next to the cost of fitting out a shop that then stands empty.
- Research reduces risk without ever removing it, because a sample may not represent everyone, people do not always do what they say they will, and tastes can move after the research is finished.
- Do not confuse market research, which gathers information from customers, with advertising, which sends information to them.
- Never write that research guarantees success, because a business can still be beaten by a rival or overtaken by a change in taste.
- A common wording is explain why this business carries out market research before launching a new product, so give the purpose and then its consequence for the business.
- Say what the research would find out, such as whether enough local customers would pay £3.50 for a coffee, rather than just naming a method.
- The mistake to avoid is describing how research is carried out when the question asks why it is carried out.
- What is market research?
- Name the three things a business collects information about.
- What is a gap in the market?
- How does research reduce the risk of a new product failing?
- Why can research never remove risk completely?
5.3.2 Primary and secondary research methods
Primary research and its methods
Primary research: new, first-hand information collected by a business, or by an agency working for it, to answer its own specific question. It is also called field research.
- The business either gathers the data itself or pays a market research agency to gather it, and because it is collected for one purpose it is up to date and matched to the decision being made.
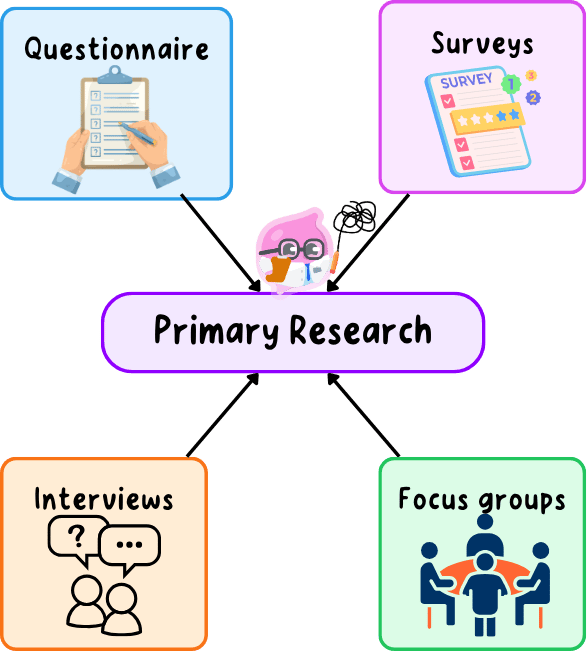
- Questionnaires: a set list of written questions, on paper or online, put to a large number of people, like the short feedback form Nando's prints on its receipts. Hundreds of replies can be collected cheaply and counted, but most customers ignore them, and a tick box cannot ask why a customer answered as they did.
- Surveys: the process of putting those questions to a sample of customers face to face, by phone or online, so the answers can be added up and compared; the questionnaire is the document, the survey is the exercise. A large sample gives figures the business can act on, though customers do not always do at the till what they said they would do.
- Interviews: a one-to-one conversation in which the researcher can ask follow-up questions and push for the reason behind an answer, giving depth no tick box can. Each interview takes up an hour of staff time, so only a handful of customers are ever reached and the sample stays small.
- Focus groups: a small group of customers brought together to discuss a product or an idea, which uncovers opinions and objections the business never thought to ask about. Someone has to be paid to run the session, and one confident voice can pull the group towards a view none of them arrived with.
- Before adding a new range, Greggs invites customers to taste samples and answer a short questionnaire in store.
- Both the tasting and the questionnaire are primary research, because the information is new and collected for that one decision.
Benefits and drawbacks of primary research
- Specific to the business: the questions are written to answer exactly what this business needs to know, about its own customers and its own product.
- Up to date and private: the data describes customers as they are now, and no competitor has a copy of it.
- Costly: printing, staff time, incentives for participants and agency fees all cost money that a start-up may not have.
- Slow: writing the questions, reaching a sample and analysing the replies takes weeks, so it is no help for a decision needed this week.
- Only as good as the sample: asking twenty friends, or asking shoppers only on a Tuesday morning, produces answers that do not represent the target market.
Secondary research and its sources
Secondary research: information that already exists, collected by somebody else or by the business earlier for a different purpose. It is also called desk research.
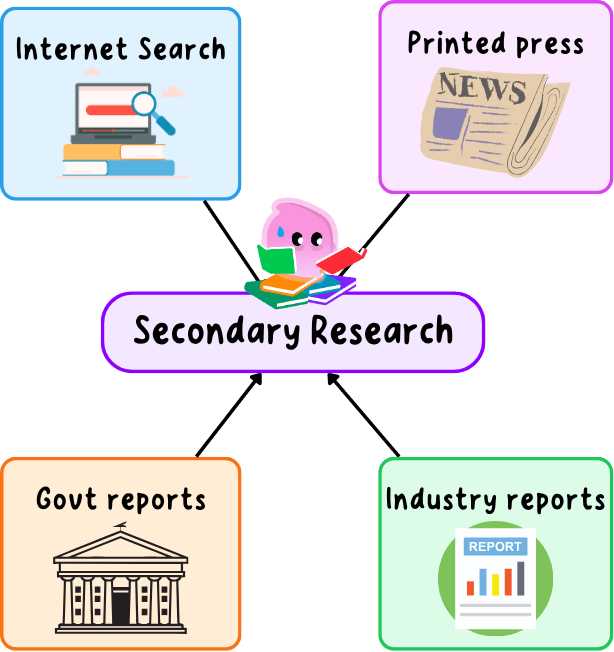
- Internet research: competitors' websites and price lists, customer reviews and published market reports can be searched in minutes and are mostly free. Anyone can publish online, so a figure with no named source behind it may be wrong or out of date.
- Printed press: newspapers, magazines and trade publications report on markets, new competitors and changing tastes, and a trade title is written by people who follow that industry closely. The articles are written for readers in general, so they may say nothing about this business's own customers.
- Government reports: population, income and spending figures published by the Office for National Statistics show how many people live in an area and what they earn, free of charge. The data is collected for the whole population rather than for this business, so it describes an area without telling you anything about your own customers or your own product, and it can be a year or more out of date by the time it is published.
- Industry reports: research firms and trade bodies publish reports on whole markets, giving sales figures and market shares that a single business could never collect for itself. Full reports are expensive, often costing hundreds of pounds, and every competitor can buy the same report, so it gives no advantage that rivals do not also have.
A baker deciding whether to open in a new town can read the council's population figures, the trade press on bakery sales and rivals' menus online without leaving the office.
Benefits and drawbacks of secondary research
- Quick and cheap: the data already exists, so it can be gathered in an afternoon and much of it costs nothing at all.
- Broad: it covers whole markets and long periods, which is how a business finds the size of the market it is thinking of entering.
- Not specific to this business: it was collected to answer somebody else's question, so it may say nothing about this firm's customers or its particular product.
- No control over how it was gathered: the business cannot see how large the sample was or how the questions were worded, and it cannot go back and ask a follow-up, so it has to decide how far to trust a figure it did not produce.
- Always ask who collected secondary data, why and how long ago, because an unsourced blog is not the equal of official statistics.
- If the information existed before the business went looking for it, it is secondary, however recent and however useful it turns out to be.
Choosing the best method for a given business
- Budget: a sole trader can afford a clipboard and an afternoon, while Tesco can commission an agency to run focus groups in six cities.
- Time: a decision needed before the weekend rules out fieldwork that would take a month to design and analyse.
- What it needs to know: numbers on how many customers would buy come from questionnaires and surveys, while the reasons customers stopped buying come from interviews and focus groups.
- Most businesses use both, starting with cheap secondary research to size the market and study rivals, then spending on targeted primary research to answer the questions the existing data leaves open.
- A common wording is recommend which method of market research this business should use, which means choosing one and justifying it with the firm's budget, its deadline and what it needs to find out.
- Name the method precisely, so 'a focus group with eight regular customers' rather than 'doing some market research'.
- The mistake to avoid is claiming primary research is always better, because a reliable national sales figure is only available second-hand.
- Define primary research and secondary research.
- Name four methods of primary research.
- Name four sources of secondary research.
- Give one benefit and one drawback of using a focus group.
- Why might a new start-up rely mostly on secondary research?
5.3.2b Qualitative and quantitative research
The difference between the two
Quantitative research: the collection of information in the form of numbers and quantities, which can be counted, compared and turned into percentages, tables and charts.
Qualitative research: the collection of opinions, feelings and reasons, which explains why customers behave as they do but cannot be counted.
- The two answer different questions: quantitative research tells a business what is happening and how much of it, while qualitative research tells it why.
- One piece of research can produce both, because a questionnaire can count ticked boxes and still leave space for a written comment.
Quantitative research
- It comes from closed questions with fixed answers, such as tick boxes and ratings out of five, and from counting things like footfall, website visits and till receipts.
- Large samples are possible because each answer takes seconds to give and seconds to add up, so a survey can cover thousands of customers.
- The results can be turned into percentages, charts and comparisons over time, which makes a pattern easy to see and easy to present to a bank or an investor.
- A Greggs survey finding that 68% of morning customers buy a hot drink with their food is a quantitative result the business can act on immediately.
- The limit is that numbers describe behaviour without explaining it, so a business can see that sales of a range fell without knowing what put customers off.
Tesco's Clubcard turns every scanned purchase into quantitative data, showing exactly which products sell, in which stores and at which times of day.
Qualitative research
- It comes from focus groups, one-to-one interviews, open questions on a questionnaire and the wording customers use in online reviews.
- The value is depth, because customers explain their reasons, describe what annoyed them and raise problems the business never thought to ask about.
- A focus group told a sandwich maker that the bread went soggy by lunchtime, which no rating out of five would ever have revealed.
- The limits are that samples are small, opinions cannot be added up or compared cleanly, and two managers can read the same comments differently.
How the two work together
- The strongest research uses both, because the numbers show the size of a pattern and the comments explain what is causing it.
- If sales of a sandwich range are down and customers say the bread is soggy, the business knows both how serious the problem is and exactly what to fix.
- Which type matters more depends on the decision, since ordering stock needs quantitative evidence of how much will sell, while redesigning packaging needs qualitative feedback on what customers dislike about it.
- Qualitative data is not simply less reliable than quantitative data, because a large survey with badly worded questions misleads just as easily.
- Name the specific weakness, such as a small sample or subjective interpretation, rather than writing that opinions are 'just opinions'.
- A common wording is state whether the information in the extract is qualitative or quantitative, so look for numbers, since figures and percentages are quantitative while comments and reasons are qualitative.
- If asked which type the business should rely on, tie your choice to the decision it faces instead of answering that both are useful.
- The mistake to avoid is muddling this pair with primary and secondary, because primary and secondary research can each produce either type of data.
- Define qualitative research and quantitative research.
- Which methods produce mainly qualitative data, and which produce mainly quantitative data?
- Give one strength and one limit of quantitative research.
- Why are qualitative findings hard to compare?
- Why do businesses use the two types together?
5.3.3 Use of market research
Using findings to make decisions
- Research only earns its cost if it changes a decision, so findings are organised into tables and charts, read for a pattern, then acted on.
- The findings feed straight into the marketing mix: what to sell, what to charge for it, how to promote it and where to sell it.
- Quantitative findings show the size of a pattern and qualitative findings explain what is causing it, and a business normally wants both before committing money.
- How far the business can act on the findings depends on its type, because a sole trader can change a menu on Monday morning while Tesco has to trial a change in a few stores before rolling it out to hundreds.
- Deliveroo uses its order data to see which cuisines customers search for but cannot get in an area, then recruits restaurants to fill the gap.
- The finding becomes an action, which is the whole point of collecting it.
Market size and market share
Market size: the total value or volume of sales made by every business selling in that market.
Market share: the proportion of that total held by one business, expressed as a percentage.
- Market size is measured either by value, the total £ spent, or by volume, the number of units sold, so the same market can be described as worth £40m a year or as selling 2 million units a year.
- Market size tells a business whether a market is big enough to be worth entering, and whether it is growing or shrinking.
- Market share tells it how it is performing against rivals, which its own sales figures alone cannot, because sales can rise while competitors grow faster still.
Calculating and interpreting market share
- The formula is not supplied in the exam, so learn it and write it out before you substitute anything.
- A bakery chain sells £3.5m of bread in a regional market worth £25m in total, and the year before it sold £2.4m in a market worth £20m.
- A 14% share means £14 of every £100 spent on bread in that market goes to this bakery and £86 goes to its rivals, so it is a serious player but a long way from dominating.
- The rise from 12% to 14% tells the owner that sales grew faster than the market as a whole, because the chain's own sales rose from £2.4m to £3.5m while the market grew only from £20m to £25m, so it has won customers from rivals rather than simply riding a growing market.
- Rising sales can still mean a falling share, so check what the whole market did before calling a sales increase a success.
- Check the units before you divide, because mixing figures in £000s with figures in £ turns a 14% share into 14,000%.
Reading data from tables and charts
- Read the title, the row and column headings, the units and the time period before you look at a single figure.
- Tables give exact figures, which is what you need for a calculation or a precise comparison between two years.
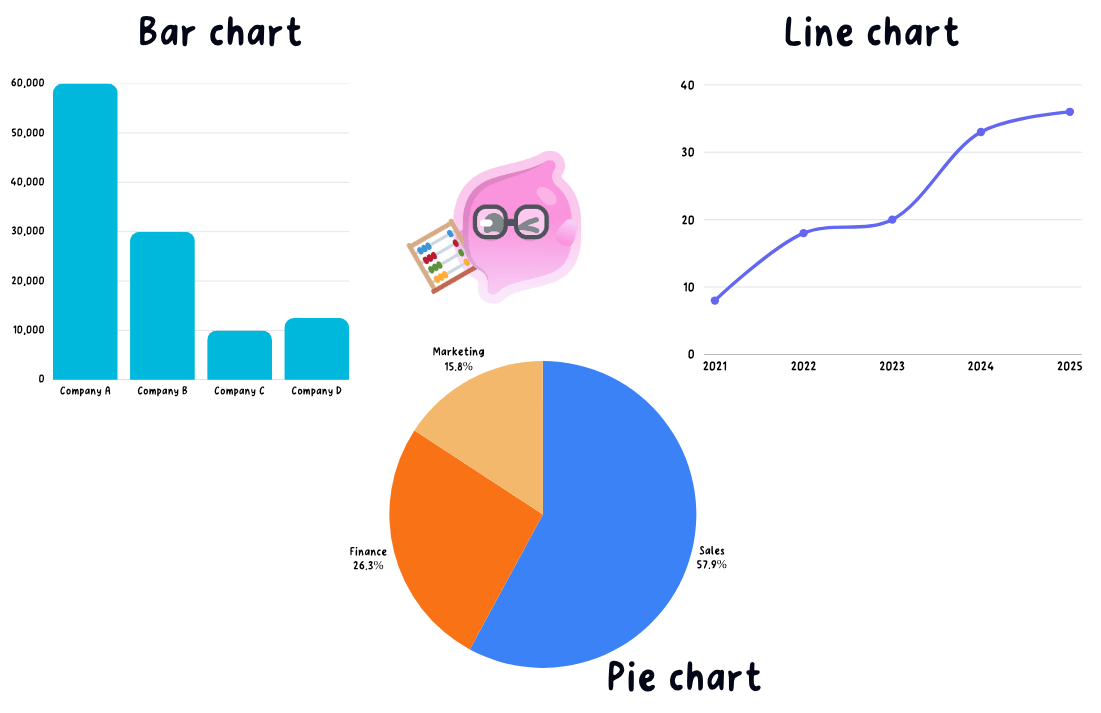
- Bar charts compare quantities across categories, so read each bar against the scale rather than judging heights by eye.
- If one rival's bar reaches £60,000 and another's reaches £30,000 the first sells twice as much, but only if the vertical axis starts at zero.
- Line graphs show a trend over time, so describe the direction and the speed of the change and look for a pattern that repeats each year.
- Pie charts show proportions of a whole, which makes them the natural way to present market share.
Drawing a conclusion from the figures
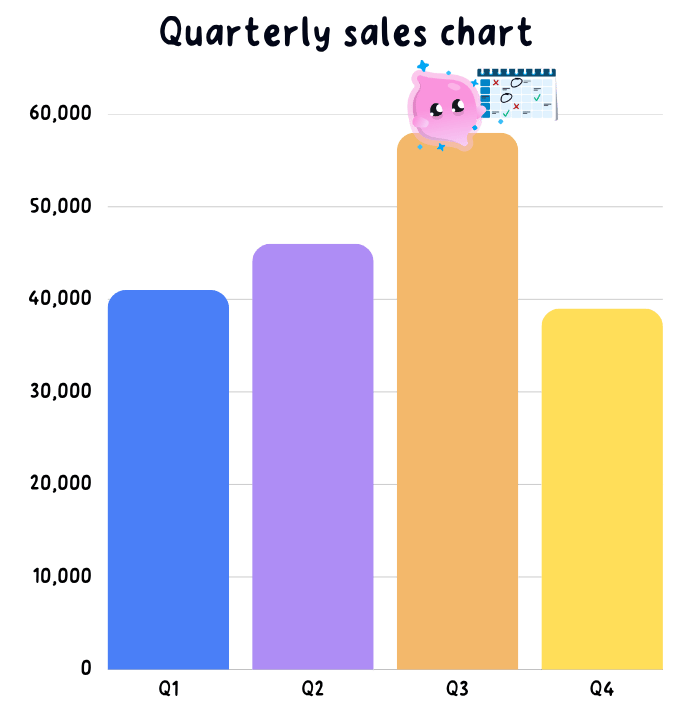
- A café owner's sales table shows takings of £41,000 in quarter 1, £46,000 in quarter 2, £58,000 in quarter 3 and £39,000 in quarter 4.
- The pattern is a summer peak and a winter dip rather than a business in decline, because quarter 4 is still close to quarter 1.
- Measure the change rather than describing it, rounding the percentage to one decimal place.
- A fall of almost a third from quarter 3 to quarter 4 is big enough to plan for, so the owner should cut winter staffing hours and promote hot food from October rather than conclude that the café is failing.
- Sense-check the data before spending on the strength of it, because a striking figure taken from 20 responses or from a single week is a weak basis for a decision.
- A common wording is calculate the market share of this business, so write the formula, substitute the figures with their units, then say in a sentence what the answer means for the firm.
- Quote figures from the table with their units, because 'sales fell from £58,000 to £39,000' is evidence while 'sales fell' is not.
- The mistake to avoid is walking through the chart line by line without ever reaching a conclusion the owner could act on.
- Define market size and market share.
- State the formula for market share from memory.
- Why can rising sales still mean a falling market share?
- What does a share rising from 12% to 14% tell the owner?
- Name two things to check on a table or chart before drawing a conclusion from it.
