6.3.1 Basic financial terms
Revenue: the money coming in
Revenue: the total money a business receives from selling its goods or services, before any costs are taken away.
Turnover: another name for the same figure, sometimes also called sales revenue.
- Revenue depends on two things only, the price charged and the number of units sold.
- Greggs earns revenue the same way, taking the price of each sausage roll, coffee and sandwich and multiplying it by the number sold, added up across every shop.
- Every figure in this article comes from one business, Craft and Crumb, an independent bakery in Leeds.
- Craft and Crumb sells sourdough loaves at £4.50 each, and in March it sold 2,000 of them.
- That £9,000 is everything customers handed over during March, and none of it is the owner's to keep yet, because every bill for the month still has to come out of it.
Fixed costs, variable costs and total costs
Fixed costs: costs that do not change when output changes, such as rent, insurance and salaries.
Variable costs: costs that rise and fall directly with output, such as raw materials and packaging.
Total costs: the fixed costs and the variable costs added together for a given level of output.
- To sort any cost into one group or the other, ask a single question: does this cost change when output changes?
- The fixed costs stay put. Craft and Crumb pays £1,800 rent, £200 insurance and a £1,000 manager's salary each month, so £3,000 is owed whether the bakery makes 2,000 loaves or none at all.
- The variable costs move with output. Each loaf swallows £1.20 of flour, yeast, packaging and oven energy, so this bill grows with every extra loaf baked.
- Variable costs are found per unit and then scaled up to the output, and the two groups of cost are then added together to give total costs.
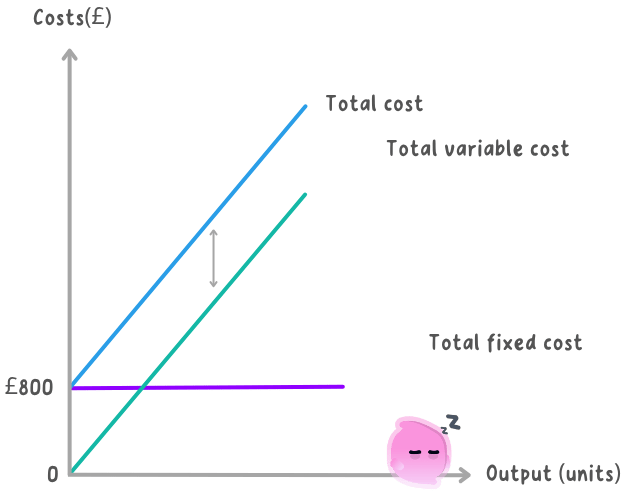
- In March, Craft and Crumb carried £3,000 of fixed costs and baked 2,000 loaves at a variable cost of £1.20 each.
- That £2,400 vanishes completely in a month with no baking, because every penny of it is attached to a loaf.
- Running the bakery in March cost £5,400, and because £3,000 of that is fixed, a quiet month is dangerous: the rent arrives even when the customers do not.
- Fixed does not mean permanent, because a landlord can raise the rent and Greggs takes on more rent every time it opens another shop.
- Fixed means only that the cost does not move when output moves.
Profit: what is left when the costs come out
Profit: the amount left when total costs are subtracted from revenue.
Loss: what a business makes when its total costs are greater than its revenue, so the subtraction gives a negative answer.
- Profit is the gap between two figures that have already been worked out, the revenue and the total costs, so both have to be found before the subtraction can be done.
- A positive answer is a profit, and it is the only money in the business the owner is free to take out, reinvest, or save for later.
- March gave Craft and Crumb revenue of £9,000 and total costs of £5,400.
- That £3,600 is what March actually earned the owner, and it is the money she can pay herself with, put towards a second oven, or hold back for a thinner month.
A month that makes a loss
- A loss appears whenever total costs are greater than revenue, so the same subtraction gives a negative answer.
- January was far quieter, with only 600 loaves sold, though the £4.50 price, the £3,000 of fixed costs and the £1.20 a loaf all stayed exactly where they were.
- January's 600 loaves have to be run through all three calculations again.
- The answer is negative, so January was a loss of £1,020.
- Nothing had gone wrong with the baking: sales fell while £3,000 of fixed costs stayed put, and the owner had to cover the gap from savings or an overdraft.
Write a negative answer up in words as a loss of £1,020, rather than leaving a minus sign to make the point for you.
Why revenue is not profit
- Revenue measures how much money came in, while profit measures what survives once total costs come back out, so the two figures answer different questions.
- Craft and Crumb took £9,000 in March and kept £3,600 of it, and in January it took £2,700 and kept nothing at all.
- A business can grow its revenue and still make a bigger loss, if its costs are growing faster than its sales.
- When a question asks how much a business made, decide whether it wants revenue or profit before you pick figures out of the data.
- Which two figures are multiplied together to find revenue?
- What single question tells you whether a cost is fixed or variable?
- A bakery has fixed costs of £3,000 and variable costs of £2,400: what are its total costs?
- Revenue is £2,700 and total costs are £3,720: what is the result, and what is it called?
- Why can a business with high revenue still make a loss?
6.3.2 Average rate of return
The investment projects businesses undertake
- New machinery: a business buys equipment to make more units, make them faster, or make them at a lower cost per unit, in the way JCB installs a new production line or a bakery replaces a worn oven.
- Buildings: Greggs fitting out another shop, or a manufacturer adding a warehouse, spends heavily now to reach more customers or hold more stock later.
- Vehicles: a wholesaler buying delivery vans can serve customers further away, and can control its own deliveries instead of paying a courier.
- All three share the same shape. One large payment leaves the business at the start, and the profit it is supposed to earn is spread across several future years, all of it forecast rather than known.
- So the owner needs a single figure that sets the size of the return against the size of the outlay, and the average rate of return does exactly that.
Investment here means spending on things the business will use for years, such as machinery, premises and vehicles, not the everyday spending on wages and raw materials.
Calculating the average rate of return
Average rate of return: the average annual profit an investment earns, expressed as a percentage of what the investment cost to buy.
- Getting there takes two formulae, and neither of them is supplied in the exam, so both have to be learnt.
- First flatten the whole project into one typical year, by sharing the total profit equally across the years the investment will last.
- Then turn that yearly profit into a percentage of the sum paid at the start, which is the step that makes projects of different sizes comparable.
- Stonegate Coffee, which runs three coffee shops in York, is considering a roasting machine costing £40,000.
- The roaster is forecast to earn £60,000 of extra profit across its five-year life.
- The roaster's figures go through the two formulae in that order.
- So every £1 Stonegate puts into the roaster brings back an average of 30p of profit a year.
- The machine earns £60,000 on a £40,000 outlay, so it more than repays its cost within the five years, and 30% is far above anything a bank would pay on the same £40,000 sitting in a savings account.
- Divide by the number of years first, because feeding the total £60,000 straight into the second formula gives 150% instead of 30%.
- The cost of investment is the sum paid at the start, so keep it separate from any year's profit figure.
Comparing two projects
- Stonegate can only afford one project this year, and the alternative is a delivery van costing £25,000 that should earn £28,000 of profit over the same five years.
- Because the answer is a percentage rather than an amount of money, projects of different sizes can be compared fairly, so the £25,000 van and the £40,000 roaster can be judged side by side.
- The van costs £25,000 and is forecast to earn £28,000 of profit over five years.
- Each pound put into the van brings back 22.4p of profit a year, quoted to one decimal place.
| Project | Cost of investment | Total profit over five years | Average annual profit | Average rate of return |
|---|---|---|---|---|
| Roasting machine | £40,000 | £60,000 | £12,000 | 30% |
| Delivery van | £25,000 | £28,000 | £5,600 | 22.4% |
- On the numbers alone the roaster wins, because each pound invested in it works harder: 30p a year against 22.4p a year.
- The van still earns more than a savings account would, so neither project is a waste of money, but the roaster uses Stonegate's cash more productively.
Why the higher percentage is not automatically the better choice
- Risk: both percentages rest on forecast profits. If the roaster's 30% assumes Stonegate can sell far more coffee than it does today, a safer 22.4% from the van may be worth more than an optimistic 30%.
- How long the money is tied up: once £40,000 is locked into a roaster for five years it cannot mend a roof or carry the business through a quiet January, so a firm short of cash may take the cheaper van despite its lower return.
- The timing of the profit is invisible. Because the calculation averages the years, a project earning most of its profit in year one and one earning most of it in year five can show exactly the same average rate of return, even though the first hands the cash back much sooner.
- Non-financial factors: the van may be the only way to keep the three shops supplied, and the roaster may cut waste and improve the coffee, and neither of those shows up anywhere in the percentage.
- Stonegate's owner buys the van, even though its 22.4% is the weaker figure, because without it the three shops cannot be supplied at all.
- The 30% roaster stays on the list for next year, when there is more spare cash to tie up in it.
- Name three kinds of investment project a business might undertake.
- How do you turn a project's total profit over its life into its average annual profit?
- A £50,000 machine earns £8,000 of average annual profit: what is its average rate of return?
- Give two reasons a business might pick the project with the lower percentage.
- What does this calculation tell you nothing about, even when two projects share the same percentage?
6.3.3 Break-even output
What break-even output means
Break-even output: the level of output at which total revenue exactly equals total costs, so the business makes neither a profit nor a loss.
Break-even point: the place on a break-even chart where the total revenue line and the total cost line cross.
- At break-even the business has covered every cost it faces, fixed and variable together, and has nothing whatsoever left over, so its profit for the period is zero.
- At any output below break-even, total costs are larger than total revenue, so the business makes a loss, and the further below it trades the larger that loss becomes.
- At any output above break-even, total revenue is larger than total costs, so the business makes a profit that grows with every further unit sold.
- Break-even output is therefore the minimum a business must sell simply to stay level, which turns it into a concrete sales target: an owner can divide it down into a weekly or daily number of units the business has to shift.
- The scale changes but the idea does not: Nissan Sunderland carries enormous fixed costs for its plant and robots, so it has to build and sell a large number of cars each year before those costs are covered, and only the cars sold beyond that point earn the plant any profit.
- Treat the fixed costs as a hole the business has to fill before it can keep any money for itself.
- Break-even is the moment the hole is finally level with the ground, and only the sales made after that leave anything behind.
How to read a break-even chart
- Get your bearings first. Output runs along the horizontal axis, measured in units such as bikes or loaves, and money runs up the vertical axis in £. Check the labels to see which sloping line is total revenue and which is total costs, because every value you take off the chart depends on telling those two apart.
- The fixed cost line: this one is flat, running straight across the chart, because fixed costs are the same whatever the output.
- The total cost line: it starts partway up the £ axis, level with the fixed costs, because rent and insurance are owed even at zero output, and it then slopes upwards as the variable costs of each unit are added on.
- The total revenue line: it starts at the origin, in the very corner of the chart, because a business that sells nothing earns nothing.
- The break-even point: find where the total revenue and total cost lines cross, then trace straight down to the output axis to read the break-even output, and straight across to the £ axis to read the revenue and the total cost at that point, which are the same figure.
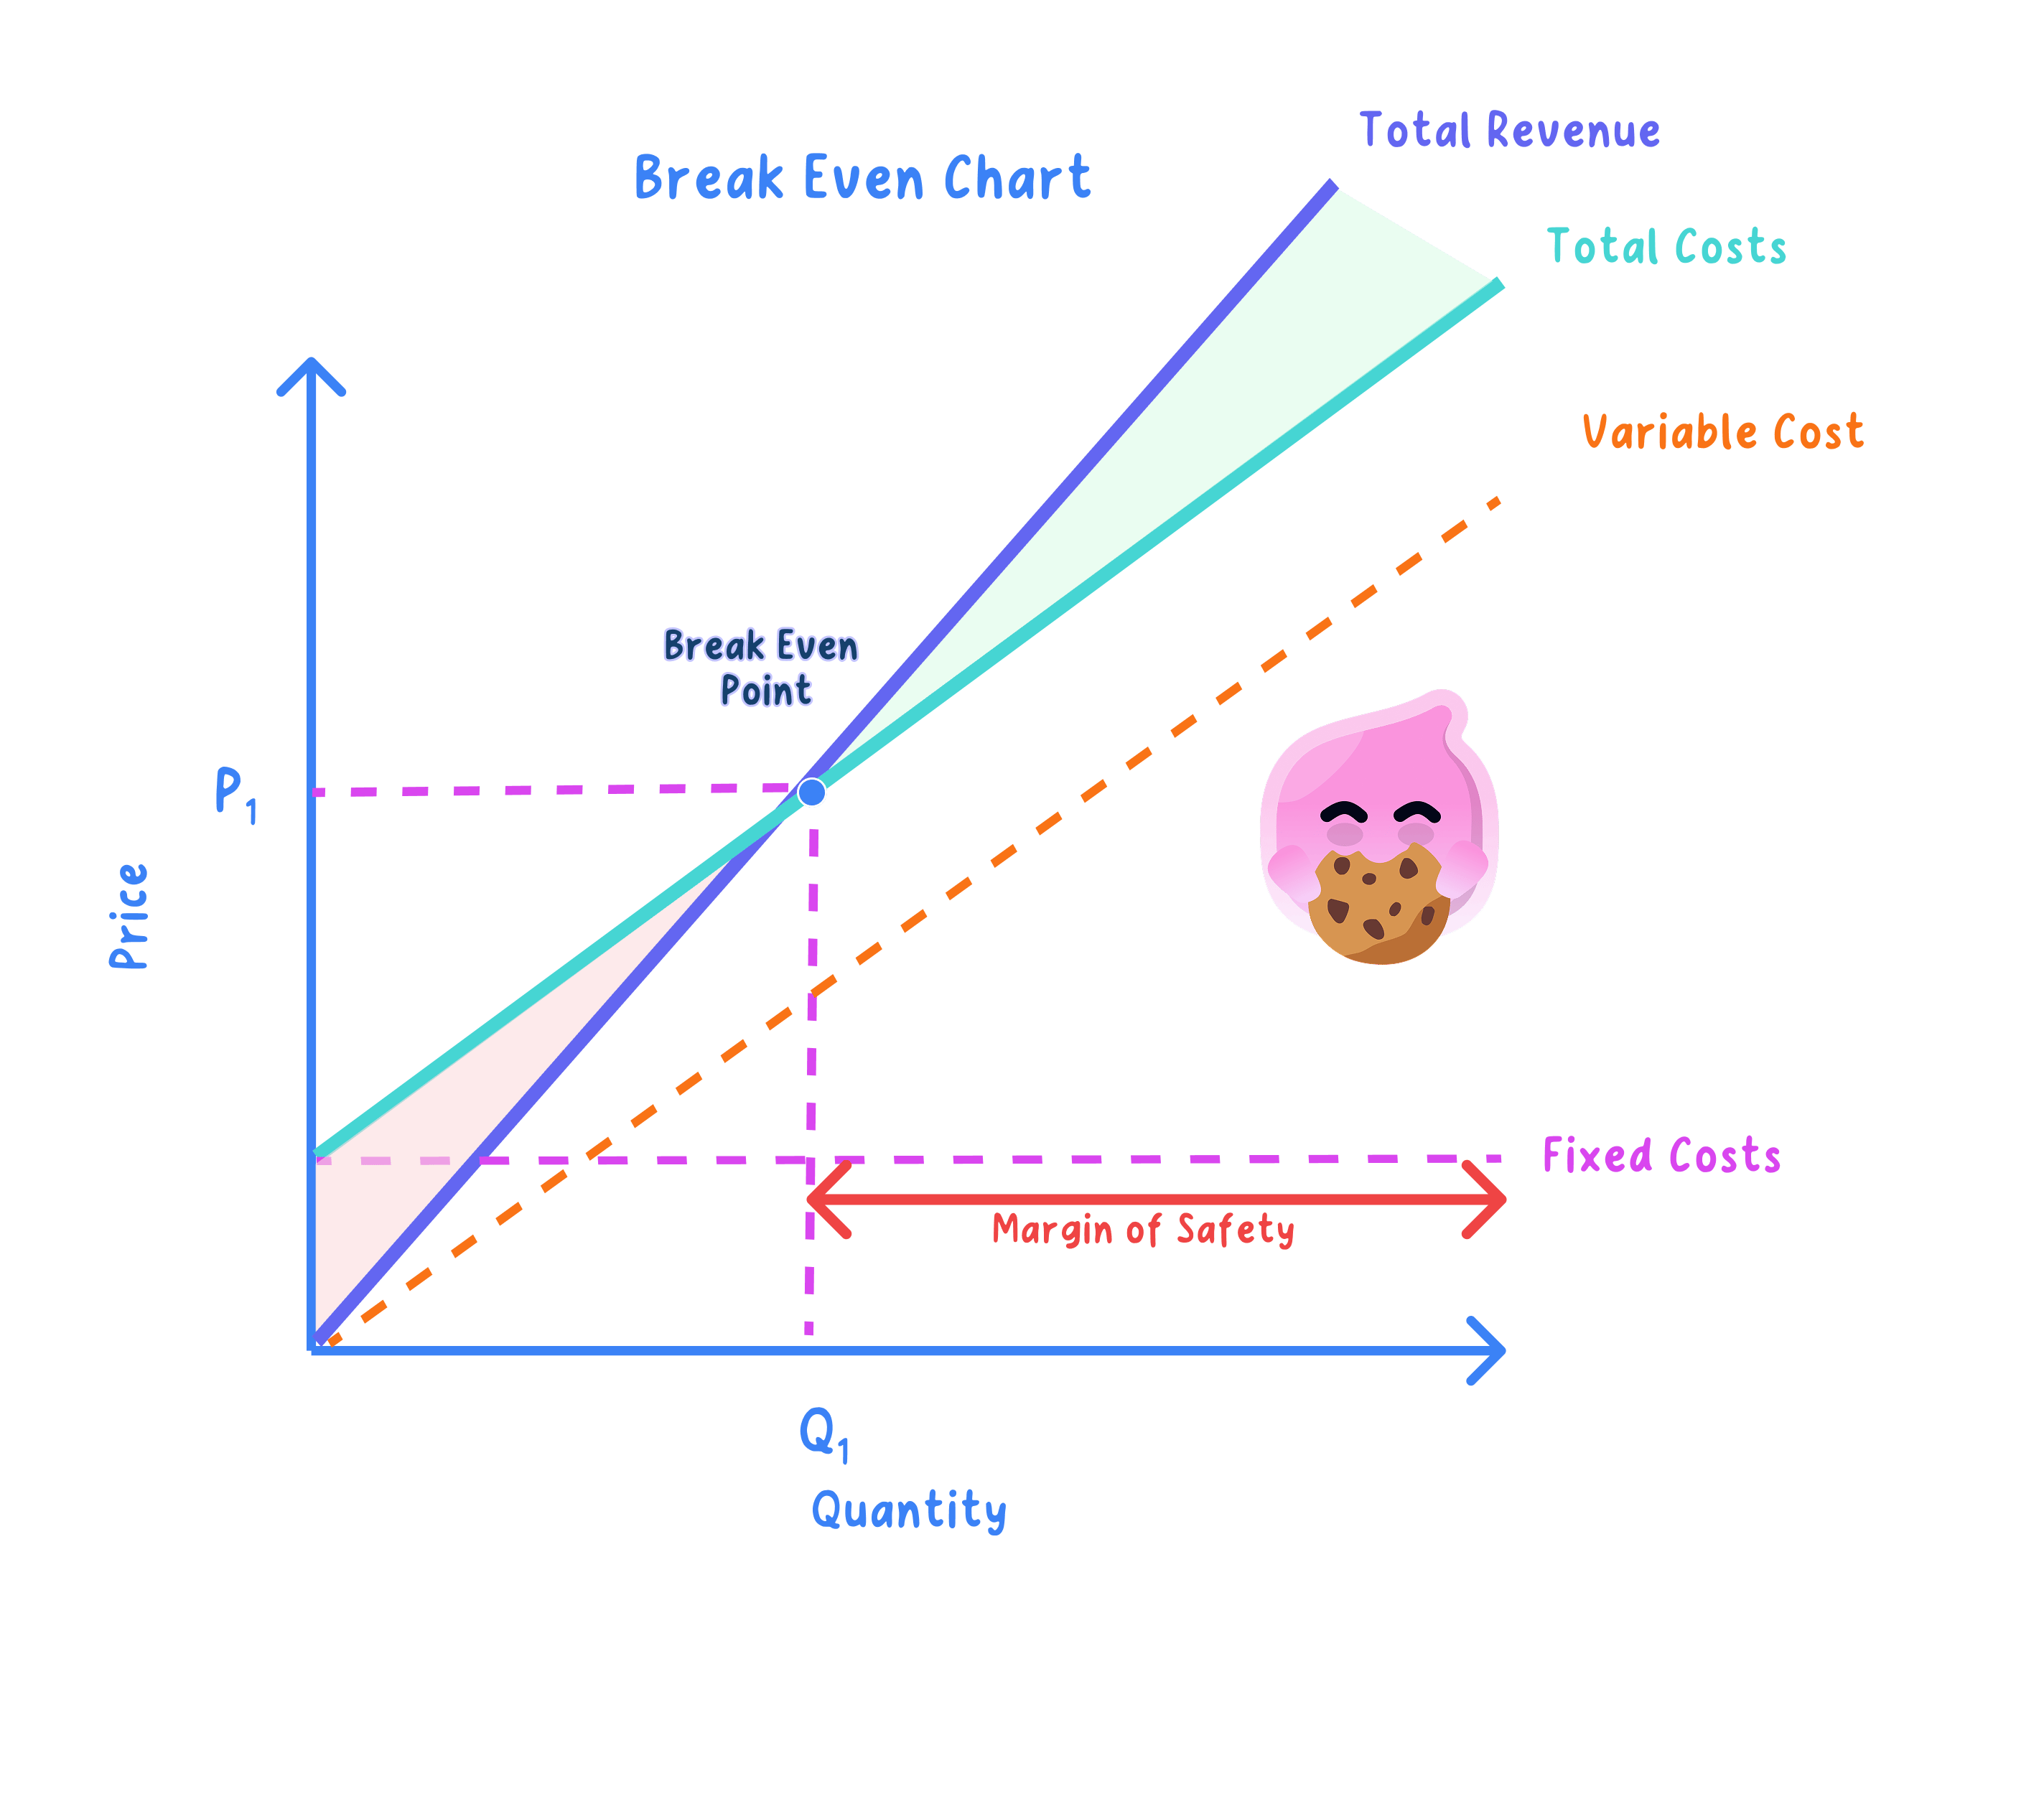
- Ridgeway Cycles assembles bikes in Bristol, and the workshop's fixed costs come to £6,000 a month.
- Its total revenue and its total costs are equal at an output of 40 bikes, so the break-even output is 40 bikes a month.
- Both of those totals come to £10,000 at that output, and on a chart of Ridgeway's own figures that is where the total revenue line and the total cost line meet.
Reading profit and loss off the chart
- To the left of the crossing point the total cost line sits above the total revenue line, and the vertical gap between them is the size of the loss at that output.
- To the right of it the total revenue line sits above the total cost line, and the vertical gap is the size of the profit. Because both lines are straight, that gap widens steadily the further right you look.
- Where the axes carry a scale, you can put a figure on that gap: read both lines at the output you are asked about, then subtract one reading from the other.
- Ridgeway is working at 65 bikes a month, and reading its own break-even chart at that output gives total revenue of £16,250 and total costs of £12,500.
- That £3,750 a month is what Ridgeway keeps at its current output of 65 bikes.
- The chart also shows the owner how fast profit builds once output passes 40, which is why pushing sales from 40 to 65 bikes matters far more to the workshop than it looks.
- The gap between the break-even output and the output the business actually achieves is called the margin of safety, and it is read off this same chart.
- That measurement, and how far a business should trust break-even analysis at all, are covered in 6.3.3b Break-even and margin of safety.
- When a question says identify the break-even output from the chart, give the answer in units, such as 40 bikes a month, because the bare number 40 does not say what has been counted.
- When a question says explain what is meant by break-even output, say that total revenue equals total costs so there is neither profit nor loss, rather than saying the business has no money.
- Which two totals are exactly equal at the break-even output?
- Which two lines on a break-even chart cross at the break-even point?
- Why does the total cost line start partway up the £ axis instead of at the origin?
- A chart shows revenue of £16,250 and total costs of £12,500 at 65 units: what is the profit at that output?
- What is happening to a business trading at any output below its break-even output?
6.3.3b Break-even and margin of safety
Finding the margin of safety on a chart
Margin of safety: the amount by which a business's actual or planned output exceeds its break-even output, so how far sales could fall before it starts making a loss.
- Start with the break-even output, found where the total revenue line and the total cost line cross, then find the output the business actually reaches, which sits further along the same horizontal axis.
- The margin of safety is the horizontal distance between those two outputs, so it is measured in units of output and both readings come off the output axis.
- Ridgeway Cycles assembles bikes in Bristol, and its chart shows the two lines crossing above 40 bikes.
- The workshop is currently turning out 65 bikes a month.
- So Ridgeway could lose the sale of 25 bikes a month, close to two in every five it currently makes, and still cover all of its costs.
- Anything worse than that and the workshop slips below 40 bikes and starts losing money.
- The margin of safety is a number of units, not an amount of money, so a margin of 25 bikes is not £25 and not £25 of profit.
- Take both figures from the output axis, because reading one of them off the £ axis by mistake produces an answer that means nothing.
What a large or small margin tells the owner
- A large margin of safety means the business can absorb a fall in demand without tipping into a loss, whether that is a wet summer, a rival opening nearby, or losing one large customer.
- A small margin means even a modest dip in sales pushes the business below break-even, which is a risky place to trade, so the owner needs to cut fixed costs, lift the price, or push sales up.
- Banks and investors read it the same way, because a lender deciding on a loan for Ridgeway wants to see output sitting well clear of break-even before it hands over the money.
- Tracking the margin month by month shows whether a business is drifting towards break-even, which is how a seasonal firm spots trouble coming before the quiet months arrive.
- Aldi sells in enormous volumes far above the output at which a store covers its costs, so its margin of safety is wide and a slow week barely registers.
- A single restaurant that fills only half its tables has a narrow margin, so one quiet fortnight can wipe out the month.
How the margin of safety changes
- When fixed costs rise: Ridgeway's landlord raises the workshop rent, so the whole total cost line on the chart sits higher, and it now meets the total revenue line further along the output axis, at 50 bikes instead of 40.
- When the selling price rises: a higher price on each bike makes the total revenue line steeper, so it climbs to meet the total cost line sooner, and the crossing point moves back to 30 bikes.
- After the rent rise Ridgeway breaks even at 50 bikes, while output stays at 65 bikes a month.
- The same 65 bikes now leaves only 15 bikes of room instead of 25, so a rent increase on its own has left Ridgeway trading much nearer to a loss, which is why higher fixed costs make a business more fragile.
- A price rise instead pulls break-even output back to 30 bikes, with output still at 65.
- The margin widens from 25 bikes to 35, so the price rise makes Ridgeway safer on paper.
- The owner still has to check whether customers will buy 65 bikes at the new price, because a price rise that drives sales down eats the margin away from the other end.
A discount works the other way, flattening the total revenue line so that the crossing point moves further along the output axis, which raises break-even output and narrows the margin of safety.
Where break-even analysis earns its place
- It is quick and cheap. A handful of figures produces a clear sales target, which suits a small firm like Ridgeway that has no finance department and no time to spare.
- It supports real decisions. Before signing a lease, taking on a mechanic, or launching a second model of bike, the owner can see how many extra units those higher costs would have to sell.
- It helps raise finance. A bank reading a business plan can see the output needed before the business covers its costs, and the margin of safety tells it how much slack there is protecting the loan.
The assumptions that weaken it
- It assumes everything made is sold. Ridgeway might assemble 65 bikes and sell only 58, leaving the rest as unsold stock, so the real position is worse than the chart suggests.
- It assumes one selling price. In practice the workshop discounts last season's frames and gives trade customers a better rate, so total revenue is not really the single straight line the chart shows.
- It rests on forecast costs. Rent reviews, energy prices and supplier increases all move the total cost line after the figures were put together, which is exactly what the rent rise did to Ridgeway's margin.
- Break-even analysis is therefore worth most as a first check rather than a final answer, and it is at its most reliable over a short period for a business with steady costs and one main product. Ridgeway should redo it whenever the rent or the trade price of frames moves, and read it next to market research on whether 65 bikes a month will genuinely sell.
Break-even analysis shows the output a business needs, never the output customers will actually buy, so a low break-even output is no comfort at all if demand is lower still.
When a question says evaluate the value of break-even analysis to this business, do not simply list the assumptions: pick the one that matters most for that particular firm and say why it does.
- Which two outputs do you subtract to find the margin of safety, and where do you read them from?
- A chart shows break-even at 40 bikes and actual output of 65 bikes: what is the margin of safety?
- What happens to the margin of safety when fixed costs rise, and why?
- Why does a bank want to see a wide margin of safety before lending?
- Name two assumptions behind break-even analysis that may not hold in reality.
