What break-even output means
Definition
Break-even output: the level of output at which total revenue exactly equals total costs, so the business makes neither a profit nor a loss.
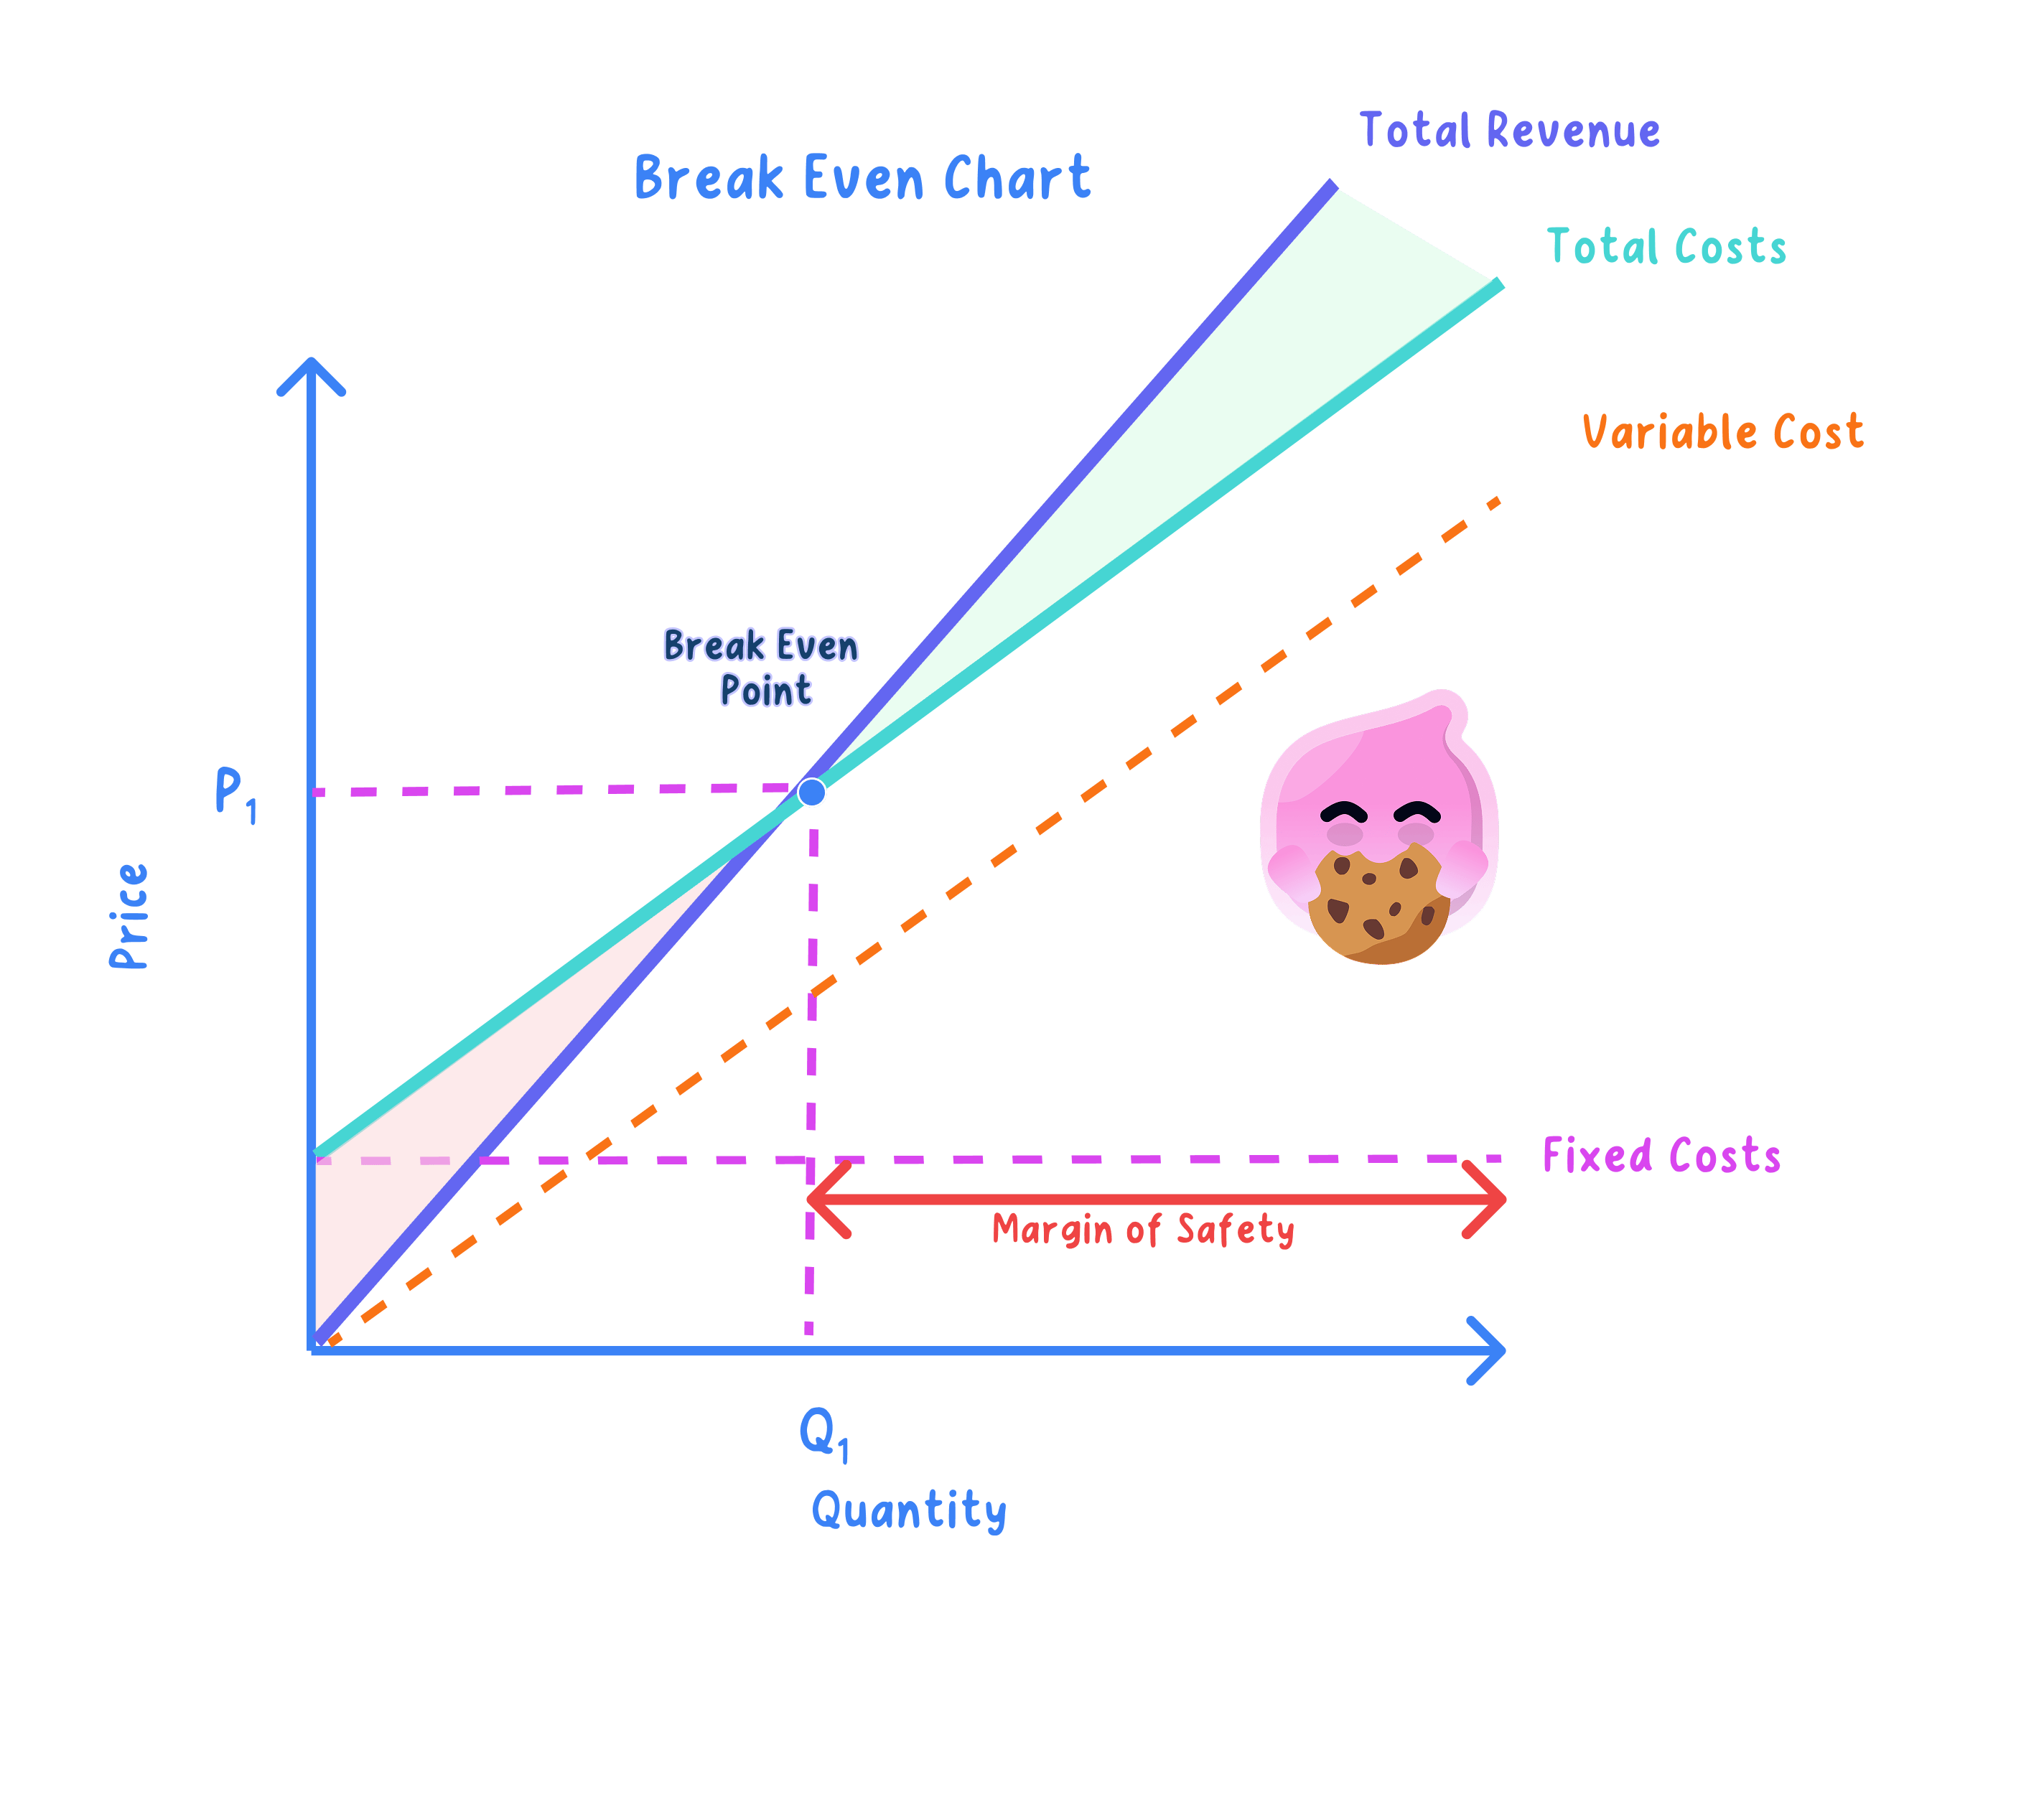
Break-even point: the place on a break-even chart where the total revenue line and the total cost line cross.
- At break-even the business has covered every cost it faces, fixed and variable together, and has nothing whatsoever left over, so its profit for the period is zero.
- At any output below break-even, total costs are larger than total revenue, so the business makes a loss, and the further below it trades the larger that loss becomes.
- At any output above break-even, total revenue is larger than total costs, so the business makes a profit that grows with every further unit sold.
- Break-even output is therefore the minimum a business must sell simply to stay level, which turns it into a concrete sales target: an owner can divide it down into a weekly or daily number of units the business has to shift.
- The scale changes but the idea does not: Nissan Sunderland carries enormous fixed costs for its plant and robots, so it has to build and sell a large number of cars each year before those costs are covered, and only the cars sold beyond that point earn the plant any profit.
Analogy
- Treat the fixed costs as a hole the business has to fill before it can keep any money for itself.
- Break-even is the moment the hole is finally level with the ground, and only the sales made after that leave anything behind.
How to read a break-even chart
- Get your bearings first. Output runs along the horizontal axis, measured in units such as bikes or loaves, and money runs up the vertical axis in £. Check the labels to see which sloping line is total revenue and which is total costs, because every value you take off the chart depends on telling those two apart.
- The fixed cost line: this one is flat, running straight across the chart, because fixed costs are the same whatever the output.
- The total cost line: it starts partway up the £ axis, level with the fixed costs, because rent and insurance are owed even at zero output, and it then slopes upwards as the variable costs of each unit are added on.
- The total revenue line: it starts at the origin, in the very corner of the chart, because a business that sells nothing earns nothing.
- The break-even point: find where the total revenue and total cost lines cross, then trace straight down to the output axis to read the break-even output, and straight across to the £ axis to read the revenue and the total cost at that point, which are the same figure.
Example
- Ridgeway Cycles assembles bikes in Bristol, and the workshop's fixed costs come to £6,000 a month.
- Its total revenue and its total costs are equal at an output of 40 bikes, so the break-even output is 40 bikes a month.
- Both of those totals come to £10,000 at that output, and on a chart of Ridgeway's own figures that is where the total revenue line and the total cost line meet.
Reading profit and loss off the chart
- To the left of the crossing point the total cost line sits above the total revenue line, and the vertical gap between them is the size of the loss at that output.
- To the right of it the total revenue line sits above the total cost line, and the vertical gap is the size of the profit. Because both lines are straight, that gap widens steadily the further right you look.
- Where the axes carry a scale, you can put a figure on that gap: read both lines at the output you are asked about, then subtract one reading from the other.
Example
- Ridgeway is working at 65 bikes a month, and reading its own break-even chart at that output gives total revenue of £16,250 and total costs of £12,500.
- That £3,750 a month is what Ridgeway keeps at its current output of 65 bikes.
- The chart also shows the owner how fast profit builds once output passes 40, which is why pushing sales from 40 to 65 bikes matters far more to the workshop than it looks.
Note
- The gap between the break-even output and the output the business actually achieves is called the margin of safety, and it is read off this same chart.
- That measurement, and how far a business should trust break-even analysis at all, are covered in 6.3.3b Break-even and margin of safety.
Exam technique
- When a question says identify the break-even output from the chart, give the answer in units, such as 40 bikes a month, because the bare number 40 does not say what has been counted.
- When a question says explain what is meant by break-even output, say that total revenue equals total costs so there is neither profit nor loss, rather than saying the business has no money.
Self review
- Which two totals are exactly equal at the break-even output?
- Which two lines on a break-even chart cross at the break-even point?
- Why does the total cost line start partway up the £ axis instead of at the origin?
- A chart shows revenue of £16,250 and total costs of £12,500 at 65 units: what is the profit at that output?
- What is happening to a business trading at any output below its break-even output?
