6.4.1 Purpose of financial statements
Why a business produces financial statements
Financial statements: the formal reports a business produces at the end of its trading year to record what it earned, what it spent, and what it owns and owes, so its performance and position can be judged.
- Every day a business records sales, purchases, wages and bills, and at the end of the trading year those thousands of entries are pulled together into one small set of formal statements.
- The statements do two jobs: they record what has happened in a form that can be checked, and they report it to the people who need to know.
- Because they are prepared to a common standard every year, a reader can compare this year with last year, or one business with another, and trust that the two sets of figures mean the same thing.
The two statements themselves, the income statement and the statement of financial position, and the lines inside each one, are taught in the article on the components of financial statements.
Assessing business performance
- Profit or loss: the statements show whether the year ended in profit or in loss, which is the clearest single test of whether the business is working.
- Direction of travel: because earlier statements are kept, this year's revenue and profit can be set against last year's.
- That turns one isolated result into a trend, which is what tells the owner whether the business is improving or slipping.
- Where the money went: costs are listed separately from revenue, so a fall in profit can be traced to a cause such as ingredients getting dearer or the rent going up, rather than being a mystery.
- Greggs publishes its financial statements every year, so anyone can see whether its revenue grew and whether profit grew with it.
- If revenue rose while profit fell, the statements have already told you that costs rose faster than sales, which is the point at which managers start looking at suppliers and overheads.
Helping make business decisions
- Prices and costs: if the statements show costs climbing faster than revenue, the owner can raise prices, change supplier or cut a particular expense, and can point to a figure that justifies the change.
- Expansion: a business deciding whether to open a second branch uses past profit to judge whether it can fund the move from its own money or afford the repayments on a loan.
- Stopping something: where one product or one branch is losing money, the statements make the loss visible so it can be changed or closed instead of being quietly subsidised by the rest of the business.
- Ashworth Joinery, a small furniture maker in Nottingham, compares two years of statements and finds revenue flat while expenses have risen by £9,000.
- The owner takes the workshop rent and the insurance renewal as her first targets, because the statements show her exactly which expense lines grew.
Who reads the statements inside the business
- Owners and shareholders: they judge whether the business performed well and whether the return on the money they put in is worth staying invested for.
- Managers: they use the statements to make the decisions above and to catch problems such as creeping overheads while they are still small.
- Employees: they read them to judge how secure their jobs are and whether the business can afford the pay rise they are about to ask for.
Who reads the statements outside the business
- Lenders: a bank such as Barclays reads them before agreeing to lend, because it wants evidence that profit is large enough and steady enough to cover the repayments.
- Investors: somebody thinking of buying shares reads the published statements to decide whether the business is worth putting money into, because that is the only detailed financial information available to them.
- Suppliers: they check them before offering credit, because supplying goods now and being paid in 30 days is only safe if the buyer will still be trading and able to pay.
- HMRC: the UK tax authority uses the profit figure to work out how much tax the business owes, which is why the figures have to be accurate as well as useful.
The statements do not change from reader to reader; each reader brings a different question to the same pages, which is why one set of figures has to be reliable enough to answer all of them at once.
Published accounts and who can read them
- A limited company must produce financial statements every year and file them at Companies House, so they stop being private notes and become public documents.
- That means anyone can look them up, including people the company would rather not show them to: Aldi can read Tesco plc's published revenue and profit, and a small Ltd company's rival on the same high street can read its accounts just as easily.
- A sole trader does not publish accounts, so no competitor can look them up, but the owner still needs statements for HMRC and for any lender who asks.
Publishing is a real cost of becoming a limited company: the loss of privacy lets a competitor see your revenue, your profit and how much you have borrowed.
When asked to explain why a business produces financial statements, pair a purpose with the reader who needs it, because a purpose with nobody reading it is only half an answer.
- What two jobs do financial statements do?
- Give two decisions a business could make better after reading its own statements.
- What does a bank look for in a set of financial statements, and how is that different from what HMRC looks for?
- Why can a competitor read a limited company's financial statements but not a sole trader's?
- Why does an employee have an interest in the accounts?
6.4.1b Components of financial statements
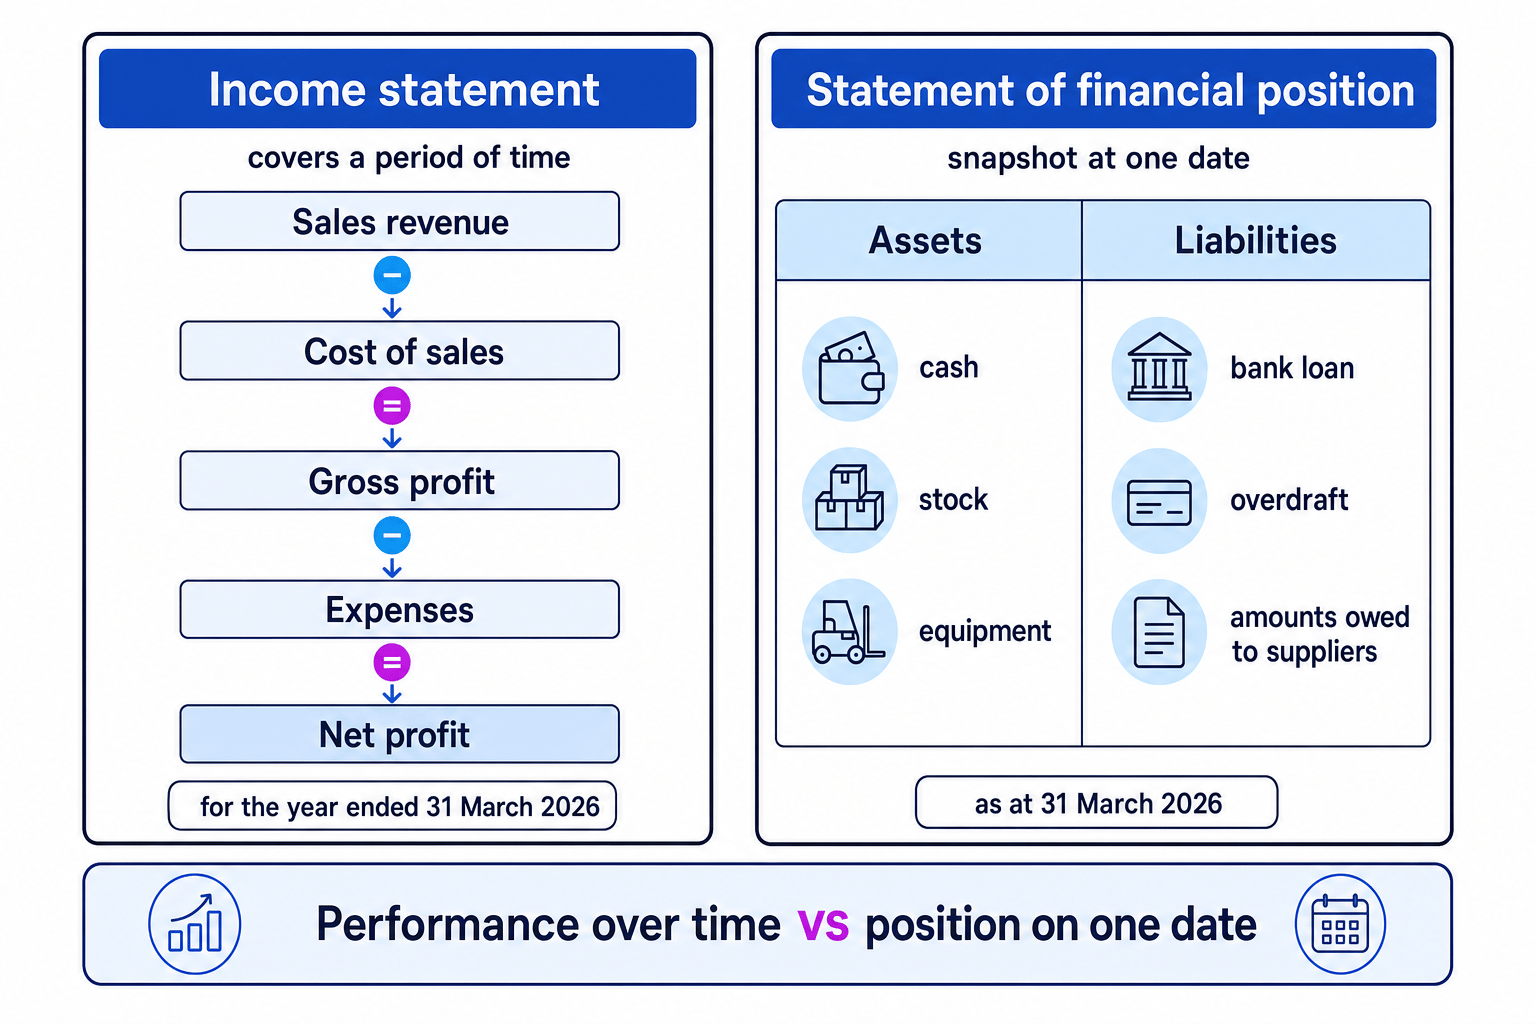
The income statement covers a period of time
Income statement: a financial statement showing the revenue a business earned, the costs it paid and the profit or loss it made over a period of time, normally one trading year.
- The period is part of the statement: it is headed for the year ended 31 March, so every figure in it is a total built up over twelve months of trading.
- One busy week and one dead week both disappear into those totals, which is why this is the statement used to judge how the business performed.
A limited company has to publish these statements every year; who reads them and why is covered in the article on the purpose of financial statements.
The five lines of the income statement
- Revenue, also called turnover or sales, is the money earned from selling goods or services during the period, before any cost has been taken off.
- Cost of sales is the direct cost of the goods actually sold, such as the frames, tyres and parts a bike shop bought for the bikes it sold that year.
- Gross profit is what is left when the cost of sales has been taken off revenue, so it measures the profit on the trading itself, before any running cost of the business is counted.
- Expenses, also called overheads, are the indirect costs of running the business, such as rent, salaries, insurance, advertising and utility bills.
- Net profit is what is left when those expenses have been taken off gross profit, and it is the figure that finally belongs to the owners.
- Gross profit and net profit are two different figures and swapping them changes the answer: gross profit ignores every expense, net profit ignores nothing.
- If a question says only profit, look at which line the figures you have been given come from before you answer.
Working out gross profit and net profit
Kirkstall Cycles, an independent bike shop in Leeds, had revenue of £180,000 last year, a cost of sales of £108,000 and expenses of £45,000.
| Kirkstall Cycles | Year ended 31 March | £ |
|---|---|---|
| Revenue | 180,000 | |
| Cost of sales | 108,000 | |
| Gross profit | 72,000 | |
| Expenses | 45,000 | |
| Net profit | 27,000 |
- Three of those figures are ones the shop records from its own trading, revenue, cost of sales and expenses, while the other two, gross profit and net profit, are worked out from them, which is why the statement is read downwards.
- Neither of the two formulae below is given to you, so both have to be learned.
- Take the shop's £180,000 of revenue and £108,000 of cost of sales straight from the table above.
- That £72,000 is what the trading generated, and it is the only pot the shop has to pay its rent, its wages and every other running cost out of.
- The owner should read it as the ceiling on what she can afford to spend on overheads.
- The £45,000 of expenses then comes off that trading profit.
- The £45,000 of expenses swallowed nearly two thirds of the trading profit, leaving £27,000 as the reward for the year's work.
- The shop is profitable, but a £10,000 rent rise would cut that reward by more than a third, so the owner has a reason to fix her rent on a longer lease.
The statement of financial position is a snapshot in time
Statement of financial position: a financial statement listing what a business owns and what it owes on one single date, giving a snapshot of its position at that moment in time.
- It does not cover a period at all. Where the income statement adds up twelve months of trading, this statement is true for one day only, the date printed at the top of it.
- That is why the picture can change fast: if Kirkstall Cycles buys a £6,000 van the day after its statement date, or pays off £5,000 of its loan, the published snapshot is already out of date.
- Size makes no difference to this. Tesco plc reports its position as at one date at the end of February, so the stock it sells and the suppliers it pays in the following week appear nowhere on that statement.
- It answers a different question from the income statement: not whether the year made a profit, but what the business owns and owes right now.
- The income statement is a film of the whole year, while the statement of financial position is one photograph taken on one day.
- A photograph taken a week later could look quite different, which is why the date on it matters as much as the figures on it.
Assets and liabilities
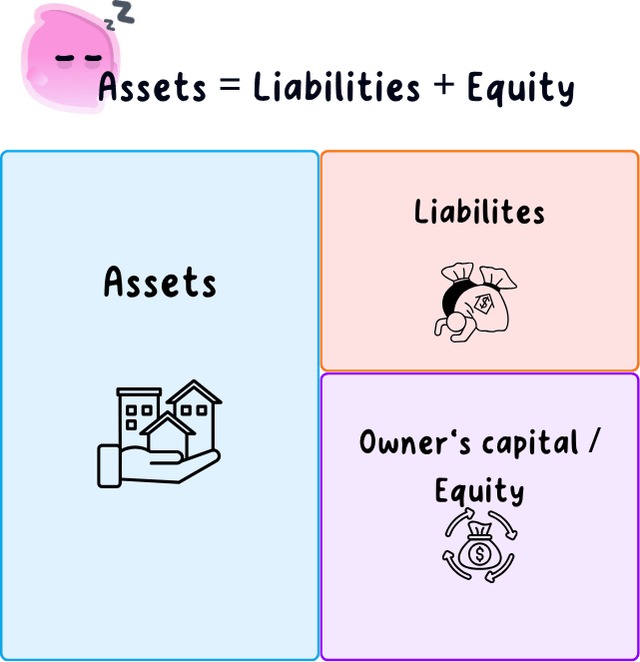
Assets: the things a business owns or is owed, such as premises, equipment, stock, money owed by customers and cash.
Liabilities: the amounts a business owes to somebody else, such as a bank loan, an overdraft and money owed to suppliers.
- Kirkstall Cycles lists as assets £16,000 of shop fittings and £6,000 of workshop tools, £24,000 of bikes and parts held as stock, £3,200 owed to it by a local school for a repair contract, and £4,500 of cash in the bank.
- It lists as liabilities an £18,000 bank loan, a £2,000 overdraft and £5,400 owed to its wholesaler for stock delivered but not yet paid for.
- The test that separates the two is the direction the money is owed: money owed to the business is an asset, money owed by the business is a liability.
The £3,200 owed by the school is an asset even though it is a debt, because the debt belongs to the shop rather than being owed by it, and reversing assets and liabilities in this way is the commonest error on this statement.
How the statement groups what is owned and owed
- The statement does not leave those items in one long list. It sorts them into the components below, splitting both assets and liabilities by how soon they turn into cash or fall due for payment.
- Non-current assets are the things the business keeps and uses for more than a year, such as Kirkstall's £16,000 of shop fittings and £6,000 of workshop tools.
- Current assets are expected to become cash within a year: the £24,000 of stock, the £3,200 the school owes and the £4,500 in the bank.
- Current liabilities have to be paid within a year, so the £2,000 overdraft and the £5,400 owed to the wholesaler both sit here.
- Non-current liabilities are repaid over more than a year, which is where the £18,000 bank loan belongs.
- Capital, also called equity, is the money the owners put in plus the profit kept in the business, and it matches what is left once the liabilities are set against the assets.
- The split is what makes the statement readable, because it shows the owner that £7,400 of Kirkstall's debts fall due within the year while the £18,000 loan does not, so the two are nothing like the same worry.
Kirkstall Cycles set out as a statement of financial position
The statement always balances, because everything the business owns had to be paid for by somebody, either a lender or the owner.
total assets=total liabilities+capital \text{total assets} = \text{total liabilities} + \text{capital} total assets=total liabilities+capital| As at 31 March | £ | |
|---|---|---|
| Non-current assets | ||
| Shop fittings | 16,000 | |
| Workshop tools | 6,000 | |
| Total non-current assets | 22,000 | |
| Current assets | ||
| Stock of bikes and parts | 24,000 | |
| Owed by the school | 3,200 | |
| Cash at bank | 4,500 | |
| Total current assets | 31,700 | |
| Total assets | 53,700 | |
| Current liabilities | ||
| Overdraft | 2,000 | |
| Owed to the wholesaler | 5,400 | |
| Total current liabilities | 7,400 | |
| Non-current liabilities | ||
| Bank loan | 18,000 | |
| Total non-current liabilities | 18,000 | |
| Total liabilities | 25,400 | |
| Capital | ||
| Capital introduced by the owner | 12,000 | |
| Retained profit | 16,300 | |
| Total capital | 28,300 | |
| Total liabilities and capital | 53,700 |
- Check the balance before you read anything else off the statement.
- That is exactly the £53,700 of total assets higher up the table, so the two halves agree.
- If those two totals do not match, a figure has been missed or put in the wrong section, so the shop's own bookkeeper treats the check as the first thing she does each year.
- Most of what the shop owns is stock rather than money, because £24,000 of the £31,700 of current assets is bikes and parts while only £4,500 is cash at the bank, so the owner depends on selling that stock to get at the value shown here.
- That is why the £7,400 due within the year is the tighter half of the borrowing: the overdraft and the wholesaler have to be paid largely out of bikes that have not sold yet.
- The £16,300 of retained profit is profit from earlier years that was left in the business rather than taken out by the owner, which is why a profitable year strengthens this statement as well as the income statement.
When you are asked to identify the components of a statement, or handed a list of items to sort, decide which of the two statements each item belongs to before you write anything.
- What period does an income statement cover, and what does a statement of financial position refer to?
- Name the five lines of the income statement in order from revenue to net profit.
- Revenue is £180,000 and cost of sales is £108,000: what is gross profit, and what formula did you use?
- Name the five components of the statement of financial position, and say why total assets must equal total liabilities plus capital.
- Is money owed by a customer an asset or a liability, and why?
6.4.2 Interpreting financial performance
What the two profit margins measure
Gross profit margin: gross profit expressed as a percentage of revenue, showing how much of every £1 of sales survives after the cost of sales has been paid.
Net profit margin: net profit expressed as a percentage of revenue, showing how much of every £1 of sales survives after every cost has been paid.
- A profit in £ tells you the size of the prize but not how hard the business had to work for it, so a margin restates that profit as a percentage of the revenue that produced it.
- That makes businesses of very different sizes comparable: £40,000 of profit is excellent on £200,000 of sales and disappointing on £2 million of sales.
- Brookfield Bakery, an independent bakery in Sheffield, had revenue of £250,000 in 2024, a cost of sales of £100,000 and expenses of £105,000.
- In 2025 its revenue rose to £280,000, its cost of sales was £126,000 and its expenses were £112,000.
Calculating the gross profit margin
- The margin needs two figures, gross profit and revenue, so gross profit has to be worked out first by taking the cost of sales off revenue.
- Brookfield Bakery's 2024 revenue was £250,000 and its cost of sales was £100,000.
- Learn the margin formula, because it is not given to you.
- A margin of 60% means that of every £1 taken over the counter, 60p is left once the flour, butter and packaging behind that sale have been paid for.
- That 60p is all the bakery has to cover rent, wages and every other overhead, so the owner should treat it as the money available to run the business rather than as profit she can keep.
- Divide by revenue, never by the cost of sales, because profit divided by cost measures something else entirely.
- Match the profit to the margin, gross profit for the gross margin and net profit for the net margin, and finish the answer with a % sign rather than a £ amount.
Calculating the net profit margin
- Net profit takes the expenses off gross profit, so the net margin uses the same revenue as before but a smaller profit figure on top of the fraction.
- Brookfield's 2024 expenses were £105,000, which come off the £150,000 of gross profit.
- The second formula also has to be learned.
- Of every £1 the bakery takes, 18p is genuinely profit and 82p has gone on costs.
- If the owner wants to draw £60,000 a year out of the business, 18p in the £1 on this level of sales will not deliver it, so either revenue has to grow or the margin has to widen.
The gap between the 60% gross margin and the 18% net margin is the whole of the bakery's expenses, so 42p out of every £1 of sales is spent on running the business rather than on making the product.
Reading a margin that has moved
| Brookfield Bakery | 2024 £ | 2025 £ |
|---|---|---|
| Revenue | 250,000 | 280,000 |
| Cost of sales | 100,000 | 126,000 |
| Gross profit | 150,000 | 154,000 |
| Expenses | 105,000 | 112,000 |
| Net profit | 45,000 | 42,000 |
- The 2025 column gives revenue of £280,000, a cost of sales of £126,000 and expenses of £112,000.
- Both margins have narrowed, the gross margin from 60% to 55% and the net margin from 18% to 15%.
- Revenue grew by £30,000 and yet net profit fell by £3,000, from £45,000 to £42,000.
- Selling more has made the bakery less profitable, and only the margins show that; the £ revenue figure on its own says the year was a success.
What a change in each margin points to
- A falling gross margin has only two possible causes, because the calculation contains only revenue and cost of sales: the cost of sales has risen faster than revenue, or prices have been cut.
- For Brookfield, 60% down to 55% would be explained by the wholesale price of butter and flour jumping, or by the discount it offered to win a new café contract, and the owner has to work out which before she reacts.
- A healthy gross margin above a weak net margin points somewhere completely different, at the expenses.
- If Brookfield's gross margin had held at 60% while the net margin still fell to 15%, buying and pricing would be under control and the damage would be in rent, wages, marketing or another overhead, so cutting an overhead is the fix rather than changing supplier.
Judging performance against a standard
- Against previous years: the bakery's own history is the fairest comparison, because the shop, the site and the customers are broadly the same, so the slide from 18% to 15% is hard to explain away as bad luck.
- Against competitors: a margin only becomes good or bad next to a rival's, so the owner has to find a comparable business and work its margin out too.
- Against what is normal for the industry: compare like with like, because Greggs works on thin margins and enormous volume, so an independent bakery that judged itself against a national chain's percentages would draw the wrong conclusion about its own pricing.
- Halliwell's Bakery, two streets away, made £34,000 of net profit on revenue of £310,000.
- That answer has been rounded to one decimal place.
- Brookfield at 15% still turns each £1 of sales into more profit than Halliwell's does, even though it sells less.
- Its 2025 figures therefore look weak against its own past and strong against its neighbour, and a good answer says both rather than picking whichever suits.
How different stakeholders read the same figures
- The owner reads the margins as a verdict on her own decisions and on the return she gets for the hours she works, so the drop from 18% to 15% matters to her even though the bakery is still comfortably profitable.
- A lender asks one question, whether the profit reliably covers the repayments, so it reads £42,000 of net profit as ample cover for a loan costing £6,000 a year and worries less about the level than about the direction it is moving in.
- An employee reads the same pages for job security and pay: a bakery making £42,000 is not about to close, but a margin that is narrowing is a poor moment to ask for a rise or expect extra hours.
- A judgement on performance therefore has to name the viewpoint it is made from, because the same 15% is a disappointment to the owner, ample cover to the lender and a warning sign to the employee.
- Write out the formula for the gross profit margin and the formula for the net profit margin from memory.
- Revenue is £280,000 and net profit is £42,000: what is the net profit margin?
- What does a gross profit margin of 55% mean in pence out of every £1 of sales?
- A business has a steady gross margin but a falling net margin: where is the problem, and where is it not?
- Name three things a profit margin can be compared with, and say why a lender and an employee would read the same margin differently.